GSP934

Overview
Looker is a modern data platform in Google Cloud that lets you analyze and visualize your data interactively. You can use Looker to do in-depth data analysis, integrate insights across different data sources, build actionable data-driven workflows, and create custom data applications.
In this lab, you will explain how Liquid parameters and templated filters can be used to enhance interactivity by users in Looker and use Liquid parameters and templated filters to create dynamic dimensions and measures.
Objectives
In this lab, you will learn how to:
- Create a dynamic dimension using a Liquid parameter
- Create a dynamic dimension using templated filters
- Create a dynamic measure using templated filters
Prerequisites:
Familiarity with LookML and Liquid are necessary. It is recommended to complete the Getting Started with Liquid to Customize the Looker User Experience lab before beginning this lab.
Setup
Before you click the Start Lab button
Read these instructions. Labs are timed and you cannot pause them. The timer, which starts when you click Start Lab, shows how long Google Cloud resources are made available to you.
This hands-on lab lets you do the lab activities yourself in a real cloud environment, not in a simulation or demo environment. It does so by giving you new, temporary credentials that you use to sign in and access Google Cloud for the duration of the lab.
To complete this lab, you need:
- Access to a standard internet browser (Chrome browser recommended).
Note: Use an Incognito or private browser window to run this lab. This prevents conflicts between your personal account and the Student account, which may cause extra charges incurred to your personal account.
- Time to complete the lab—remember, once you start, you cannot pause a lab.
Note: If you already have a personal Google Cloud account or project, do not use it for this lab to avoid extra charges to your account.
How to start your lab and sign in to Looker
-
When ready, click Start Lab.
The Lab Details pane appears with the temporary credentials that you must use for this lab.
If you need to pay for the lab, a pop-up opens for you to select your payment method.
Notice your lab credentials in the Lab details pane. You use them to sign in to the Looker instance for this lab.
Note: If you use other credentials, you will get errors or incur charges.
-
Click Open Looker.
-
Enter the provided Username and Password in the Email and Password fields.
Username:
{{{looker.developer_username | Username}}}
Password:
{{{looker.developer_password | Password}}}
Important: You must use the credentials from the Lab Details pane on this page. Do not use your Google Cloud Skills Boost credentials. If you have a personal Looker account, do not use it for this lab.
-
Click Log In.
After a successful login, you see the Looker instance for this lab.
Task 1. Using Liquid to enhance interactivity
In LookML, we call lots of things parameters, like a dimension or measure type, sql, and drill_fields. There is also an object itself called a parameter, which we can call a Liquid parameter for clarity.
Parameters and templated filters use Liquid to increase interactivity in Explores, Looks, and dashboards. The use case for this is: sometimes you want more flexibility in influencing the generated SQL. When you use a dimension filter, it only ever updates the WHERE clause of the outer query. When you use a measure filter, it updates the HAVING clause of the outer query. Either option might be filtering your results set “too much.”
Parameters & templated filters
“Parameters and templated filters” is often said together in one phrase because they basically achieve the same purpose when using Liquid. The main difference is that a parameter only allows one specific, fixed value, whereas a templated filter leverages the full range of filter operators for a given data type. For a string, that would be “is equal to,” “is not equal to,” “contains,” “starts with,” etc. The differences are outlined as follows:
-
Parameters: Specific, fixed values that can be entered by users and then passed directly into a SQL query using Liquid
-
Templated Filters: user-entered values that are passed into SQL queries using intelligently written conditional logic
Using parameters and templated filters provides greater flexibility in how user inputs can influence the SQL queries written. You can use parameters and templated filters to create:
- Dynamic dimensions and measures, which not only consolidate code but can also provide a smoother user experience
- Dynamic derived tables, in terms of data granularity and filtering
- Conditionally displayed values in the results set and labels
So this all sounds great, but what does this cycle of behavior look like in Looker?
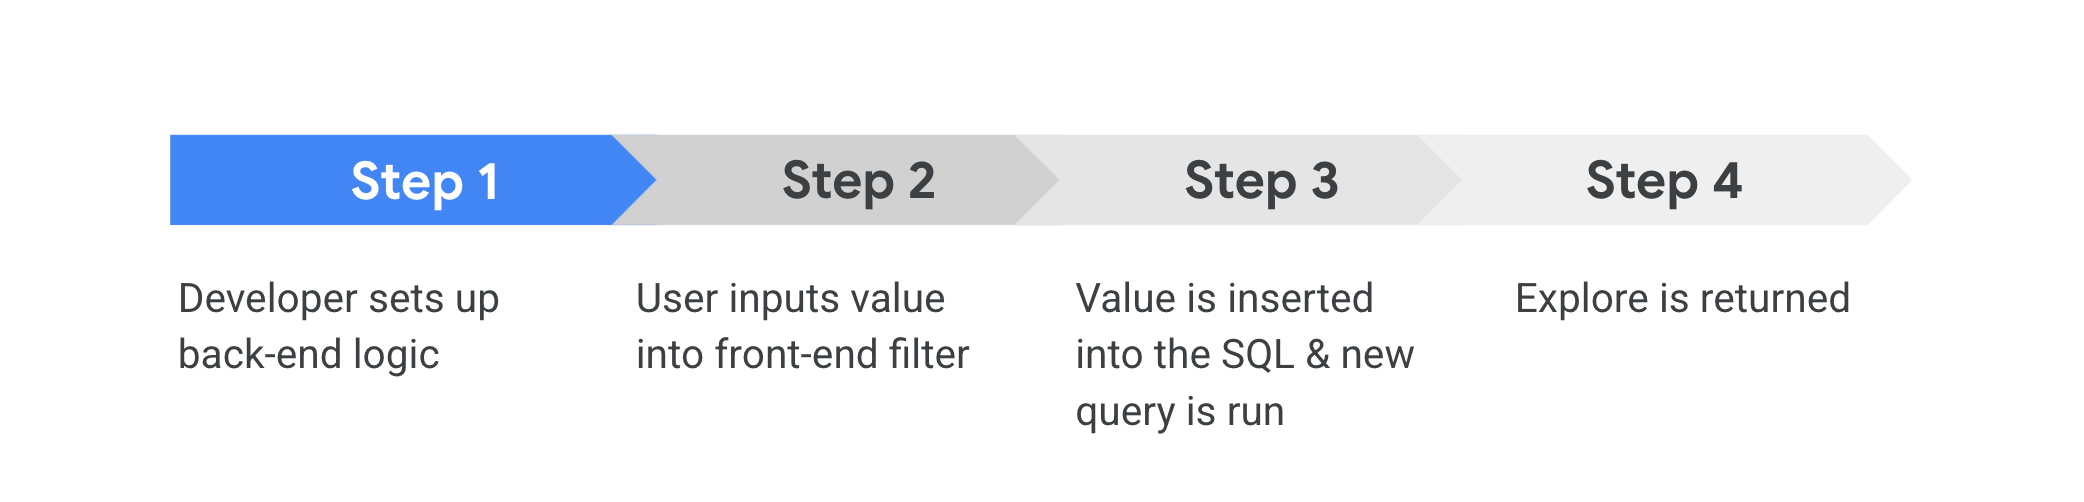
-
Step 1: It starts with the developer setting up the back end logic, which has two parts:
- A parameter or templated filter, which appears in the UI for the user to interact with
- A place in the sql parameter that summons the parameter or filter value and does something with it
-
Step 2: The end user then inputs a value into the parameter or templated filter, which resembles a “normal” dimension or measure filter in an Explore, Look, or dashboard.
-
Step 3: That value is then inserted into the SQL, and a query is formed with the changed SQL.
-
Step 4: That query runs and returns an Explore that reflects the value the user put in. This cycle applies to both templated filters and parameters
Parameters are little easier to understand conceptually, so that’s where we’ll start.
Task 2. Create a dynamic dimension using a Liquid parameter
Liquid parameters are defined to receive specific, hard-coded values selected by users, then these values are then passed onto the generated SQL query.
In this section, you will create a parameter and dynamic dimension within the order_items view that together enable users to choose between different order creation date fields in the Order Items Explore. Users should be able to choose between Date, Week, and Month and see that the query results change depending on which is selected.
- First, on the bottom left of the Looker User Interface, click the toggle button to enter Development mode.

- Click the Develop tab and then select the qwiklabs-ecommerce LookML project. Navigate to the
order_items view file.
To start, you need to give the user something to interact with in the UI. This would be the parameter object. Give it a name as you would a dimension or measure: select_timeframe. The type should be unquoted, because you don’t want Looker to generate single quotes around the value for us.
Next, hard-code one or more allowed_values. The value sub-parameter is what actually gets plugged into the SQL query, and the label sub-parameter determines how the value is displayed in the UI. You can also choose to set one of these allowed_value values as the default_value. For this, you can select the month.
You will now create the Liquid parameter that can receive the user input; only three values are hard-coded and thus available for the user to select: created_date, created_week, and created_month.
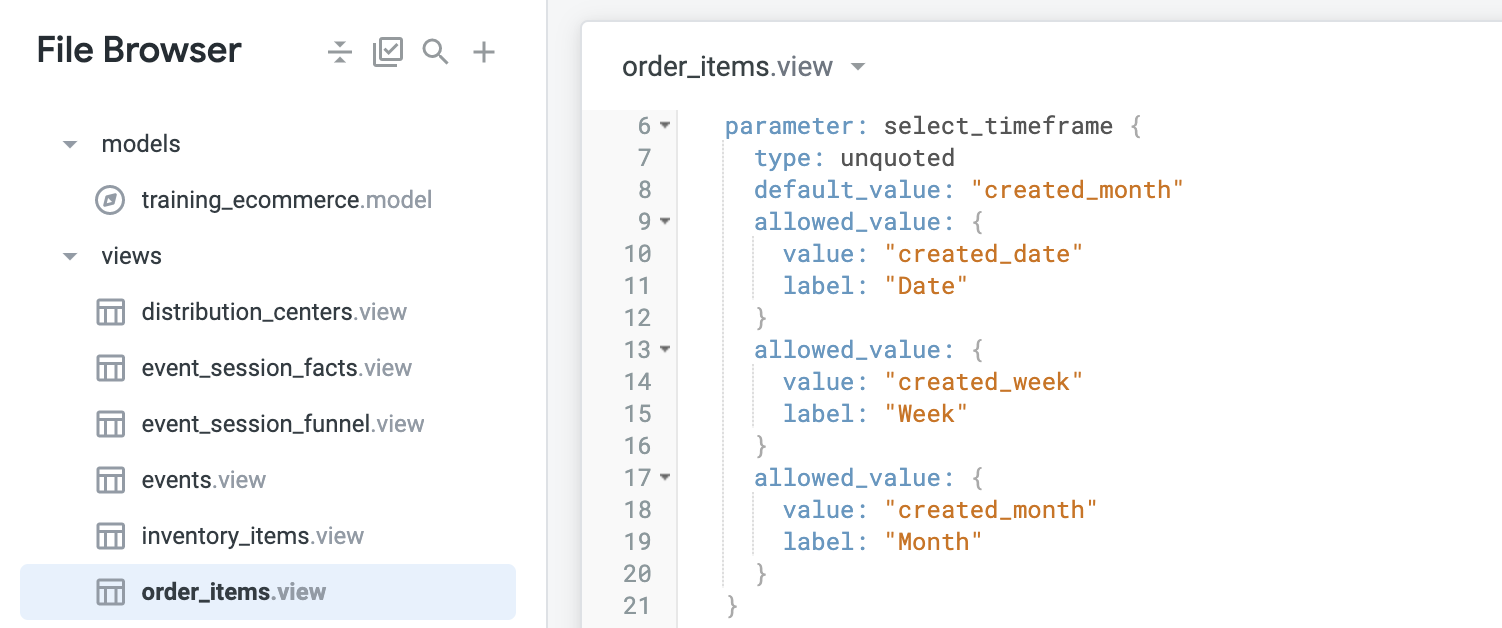
- In the order_items view file, above all dimensions, add the following syntax for the new parameter (~line 6 under
drill_fields):
parameter: select_timeframe {
type: unquoted
default_value: "created_month"
allowed_value: {
value: "created_date"
label: "Date"
}
allowed_value: {
value: "created_week"
label: "Week"
}
allowed_value: {
value: "created_month"
label: "Month"
}
}
To recap, the sub-parameters are defined as follows:
-
label: what the user will see in the filter options
-
value: the value that will be inserted into the SQL query
-
default_value: the value that will be inserted automatically if a user has not yet made a selection
Your file should now resemble the following:
Next, you may want the fields displayed in a dashboard or Look to be dynamic, based on a user's selection of the metrics or data granularity they wish to see. Now you can use the LookML parameter you just created to apply this parameter to a dimension that ties the parameter's filter values to your different timeframe fields.
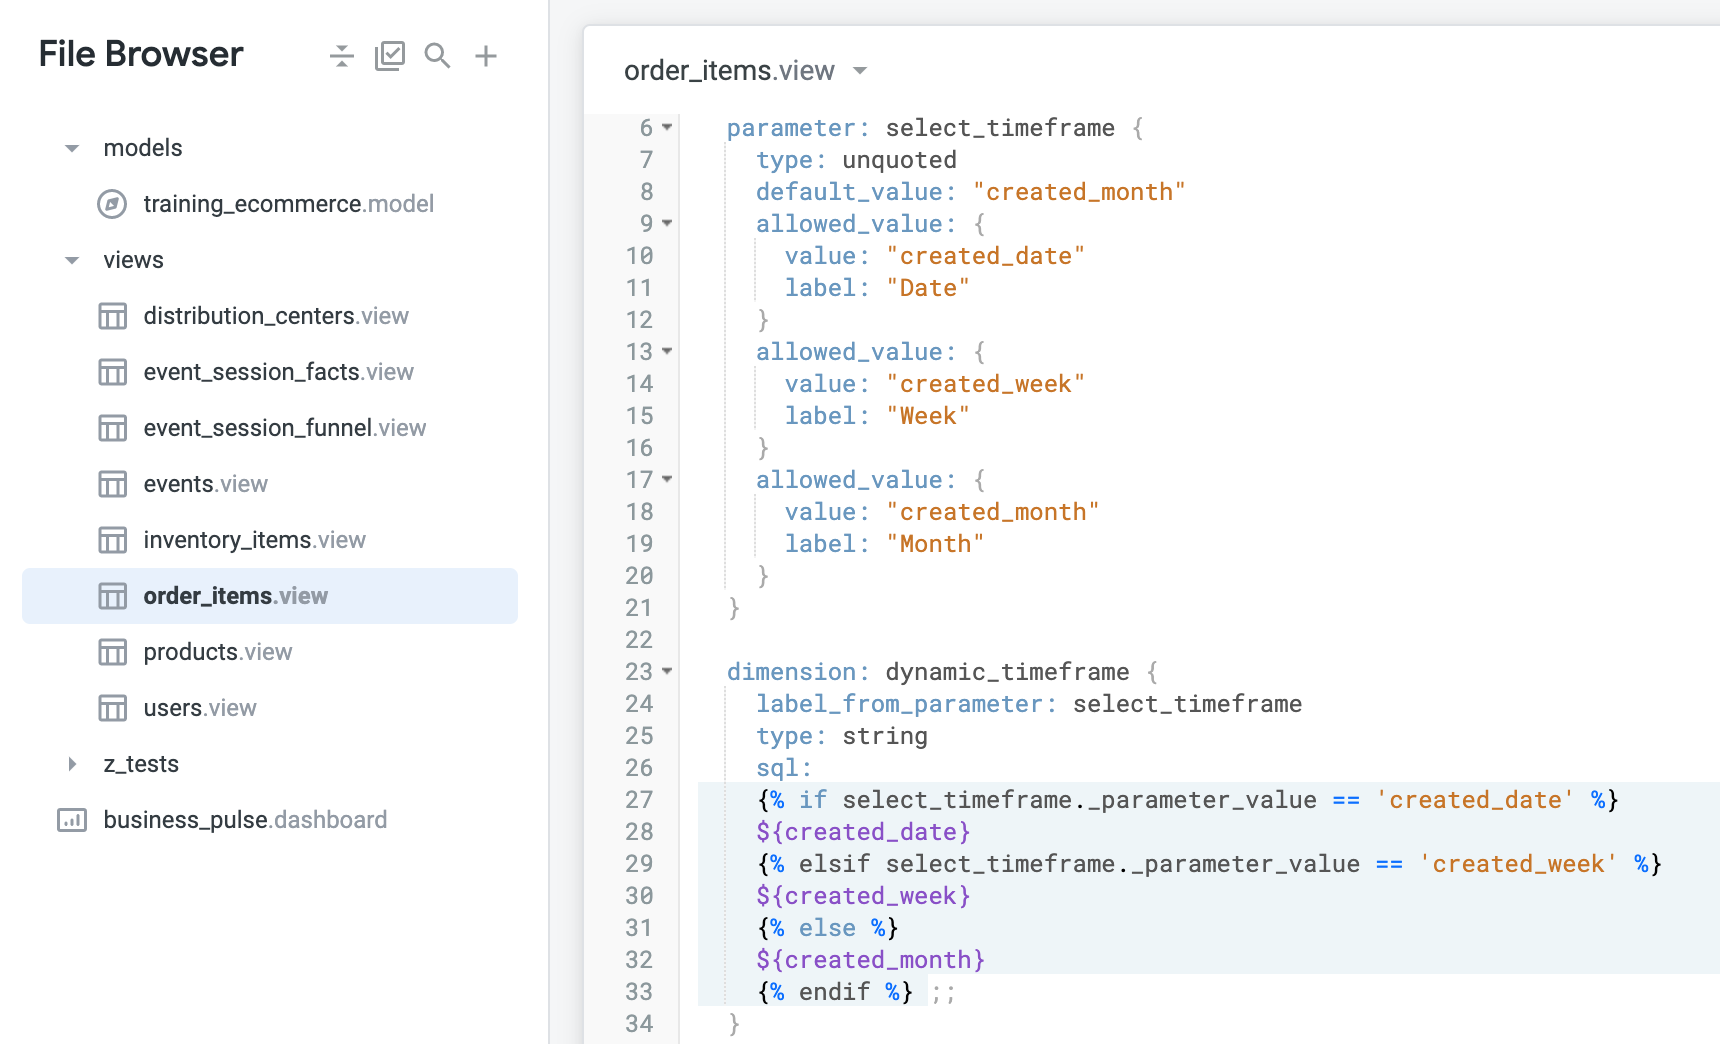
- Next, you will define the dynamic dimension in the same view file. In the order_items view file, after the parameter definition, add the following syntax for the new dynamic dimension (~line 23):
dimension: dynamic_timeframe {
label_from_parameter: select_timeframe
type: string
sql:
{% if select_timeframe._parameter_value == 'created_date' %}
${created_date}
{% elsif select_timeframe._parameter_value == 'created_week' %}
${created_week}
{% else %}
${created_month}
{% endif %} ;;
}
The specified timeframe field will now be returned based on whichever parameter value the user selects on the dashboard. Note that you are using label_from_parameter to pass the selected value label to your tile.
Because the ${created_week} and ${created_month} timeframes—and possibly ${created_date}, depending on your database dialect—are cast by Looker to strings, the overall dynamic_timeframe dimension needs to be a string to accommodate.
This means, when business users are using this dimension in an Explore, they’ll need to remember to double-check the sort order. Looker’s default sort behavior is: check if there is a date or time dimension; if there isn’t, then sort by the first measure. So since this is technically a string type, Looker will sort by the measure first, which will likely mess up the chronological order.
You might wonder, well, what is the point then? Isn’t this introducing unnecessary complexity? Two things to keep in mind:
Most business users of Looker are viewers, not explorers. That means they are looking at prepared dashboards and Looks, and they aren’t able to pick and choose different fields such as Created Date vs. Created Week in an Explore. Filters are the only way they can change what they’re seeing.
Since viewer users would be looking at content created by someone else, the fact that dynamic_timeframe is technically a string and needs to be manually sorted has zero impact on them.
Your file should now resemble the following:
Note: Notice that the parameter created in the previous step is referenced as the label_from_parameter and in the sql parameter. In the visualization tab, the timeframe option will show up as Month, Week, Date, rather than the name of the dimension (Dynamic Timeframe).
Now you can test the dynamic dimension in the Order Items Explore.
-
Click Save Changes. Next, navigate to the Order Items Explore.
-
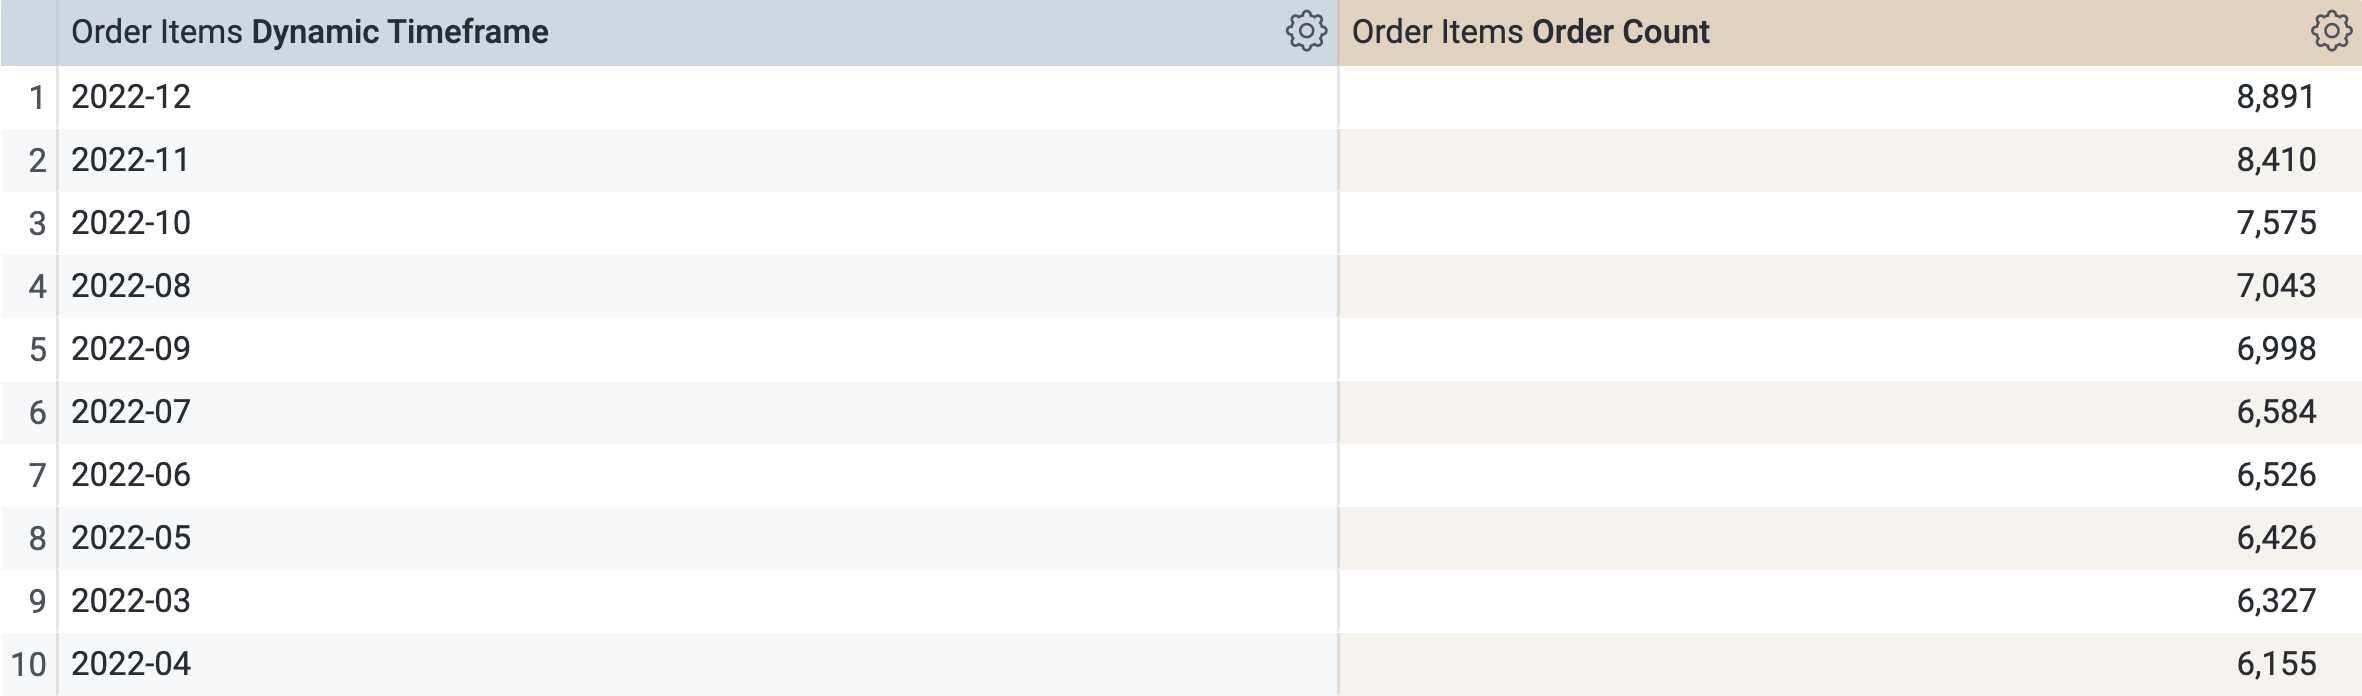
Under the Order Items view, select the new Dynamic Timeframe dimension and the Order Count measure.
-
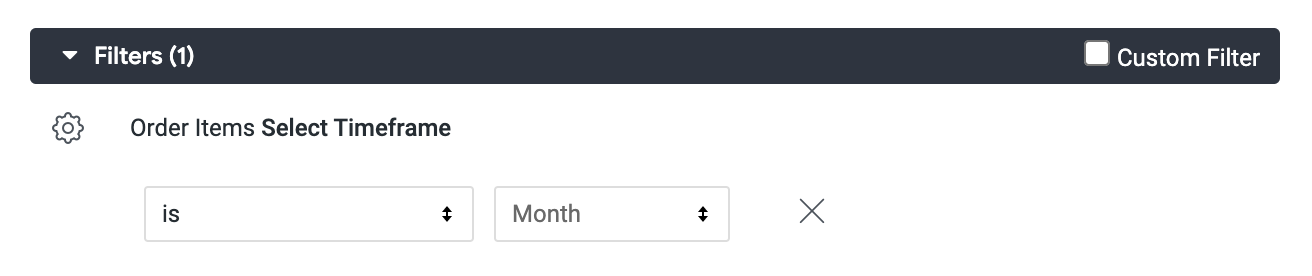
Click on the filter icon next to the new Filter-Only Field called Select Timeframe
Note: This is the Liquid parameter and is listed under the Order Items view above the Dimensions list.
-
For the filter option at the top of the UI, leave “is” selected.
Select Month from the drop-down menu.
- Click Run to see the results. You can also now click on the SQL tab to review the SQL.
-
Next, select the Week and Date filters. Click Run to see the updated results for each of them.
-
For each run, click the SQL tab to review how the parameter is changing and is inserted into the SQL query.
-
Navigate back to the Order Items view.
Commit changes and deploy to production
-
Click Validate LookML and then click Commit Changes & Push.
-
Add a commit message and click Commit.
-
Lastly, click Deploy to Production.
Click Check my progress to verify that you've performed the above task.
Create a dynamic dimension using a Liquid parameter
Task 3. Create a dynamic dimension using templated filters
Templated filters follow the same logical pattern as parameters. Again, the major difference is that templated filters allow end users to choose from a number of filter operators. For the number data type, that could be “is equal to,” “is greater than,” “is between,” and so on.
In filters, values are not hard-coded; they are entered by users and then passed onto the generated SQL query. However, you can display a drop-down menu of options by specifying an explore and dimension in the filter definition.
In this section, you will create a dynamic dimension that takes an input value for product category and creates two groups in the results: the original category selected and all other categories.
- Back in the Looker IDE, navigate to the products view file.
Same as with Liquid parameters, first you need to create something in the UI for the end user to interact with. For a templated filter, you need a filter object.
Note: For optimal performance, you can create a small hidden Explore (such as explore: products {} ) that only queries the base view required for the suggested values.
- You will now create the filter object that can receive the user input. In the products view file, above all dimensions, add the following syntax for the new filter (~line 6 under drill_fields).
As you can see, you cannot hard-code allowed_values for templated filters as you can for parameters.
- The recommended approach is to use
suggest_explore and suggest_dimension to provide a drop-down menu of filter suggestions to the end users:
filter: select_category {
type: string
suggest_explore: order_items
suggest_dimension: products.category
}
To recap, the sub-parameters are defined as follows:
-
suggest_explore: the Explore that will be queried in order to pull a list of suggested filter values
-
suggest_dimension: the dimension that should be used within the suggest Explore for providing a list of suggested filter value
Your file should now resemble the following:

Next, implement the user’s filter input somewhere. You will now define the dynamic dimension in the same view file.
Templated filters are referenced inside of a Liquid block using the syntax {% condition filter_name %}. This prepares the Liquid to apply a templated filter. Then give it the name of the field you want to apply that filter to, and finish the Liquid block with an {% endcondition %} tag. Notice how this is a little different from how you referenced a parameter; here you need to designate a field to apply the templated filter to, and an endconditon.
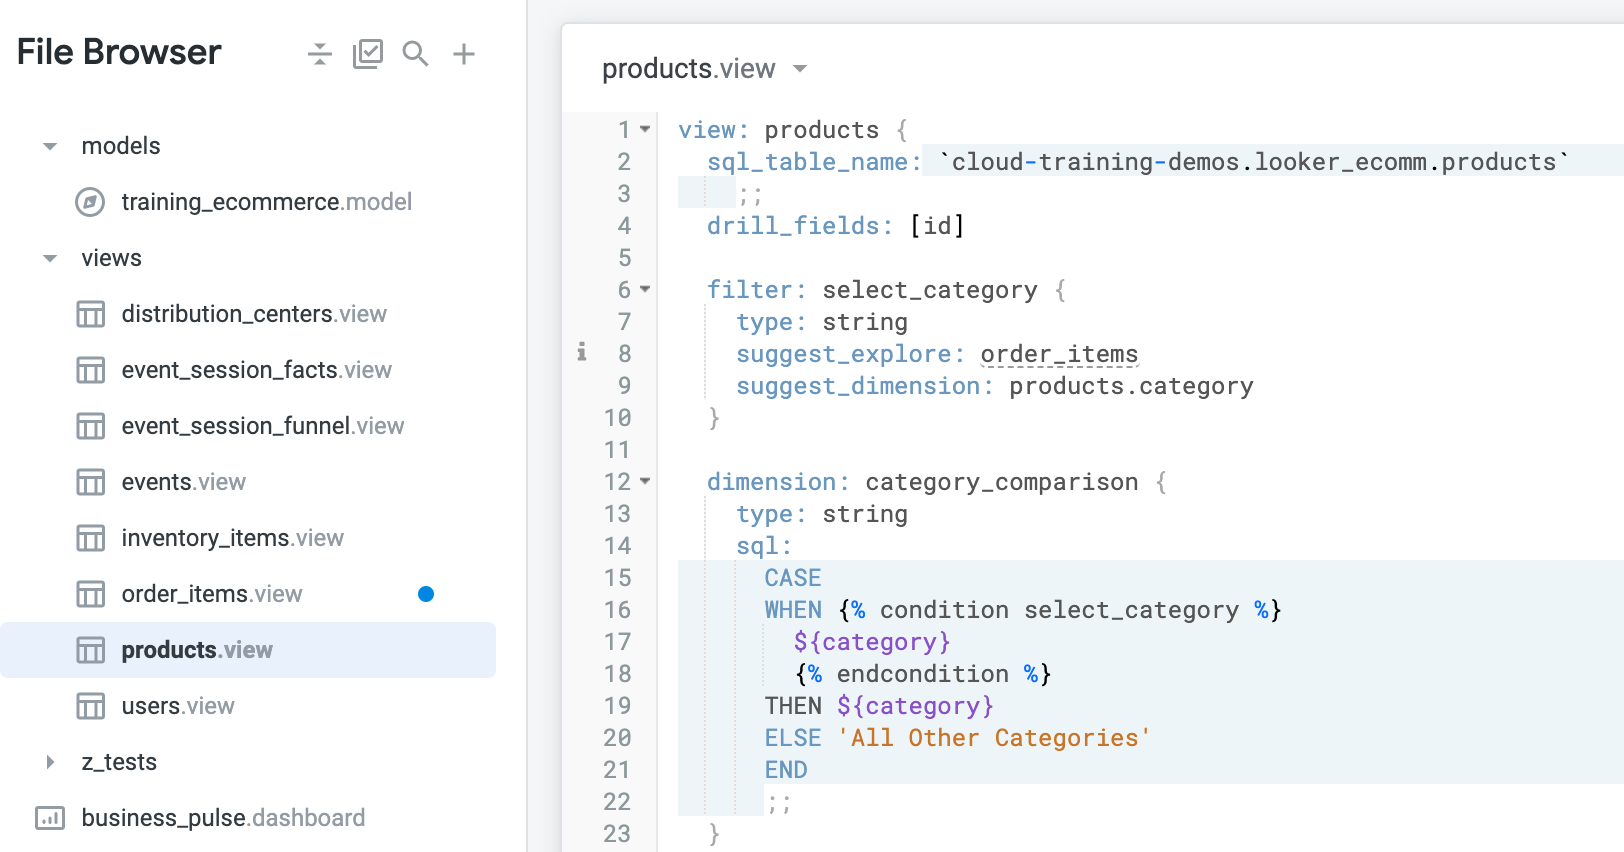
- In the products view file, after the filter definition, add the following syntax for the new dynamic dimension (~line 12). Notice that the filter created in the previous step is referenced in the
sql parameter:
dimension: category_comparison {
type: string
sql:
CASE
WHEN {% condition select_category %}
${category}
{% endcondition %}
THEN ${category}
ELSE 'All Other Categories'
END
;;
}
Here you are taking the user's filter criteria from select_category, and are applying it to the ${category} dimension. If a category value does indeed meet the criteria, it should be displayed in the category_comparison dimension. If a category value does not meet the criteria, it should be lumped in with all the others that don’t match as ‘All Other Categories’.
Your file should now resemble the following:
Now you can test the dynamic dimension in the Order Items Explore.
-
Click Save Changes. Next, navigate to the Order Items Explore.
-
Under the Products view, select the dimension called Category Comparison.
-
Click on the filter icon next to the new Filter-Only Field called Select Category (note: this is the templated filter and is listed under the Products view above the Dimensions list.)
-
Under the Order Items view, select the Order Count measure.
-
For the filter option at the top of the UI, leave “is equal to” selected.
-
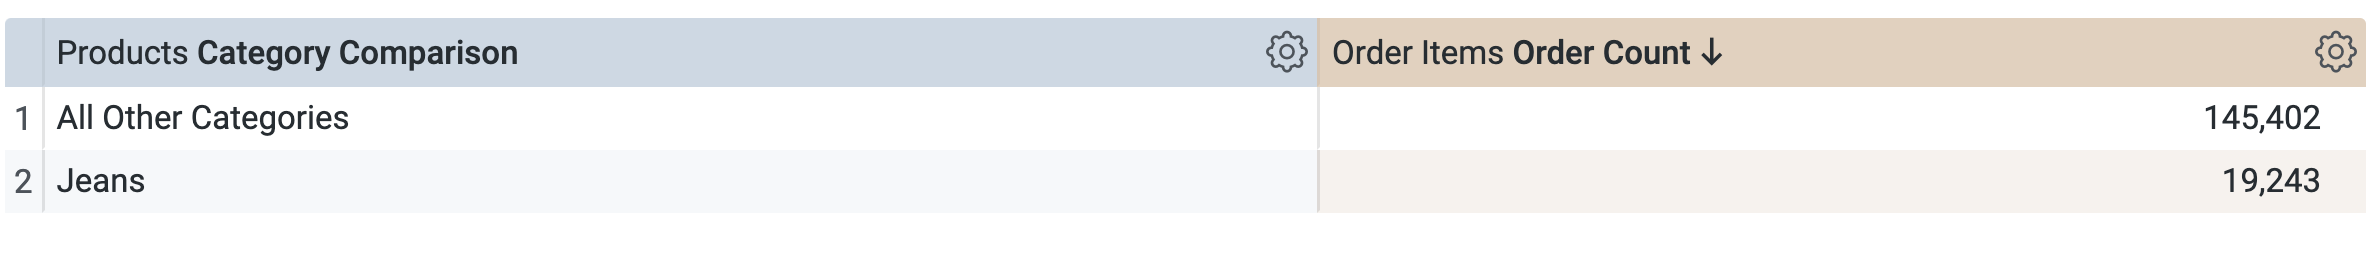
Click in the empty text box to see the drop-down menu, or type Jeans (you will also see other possible values in a drop-down menu).
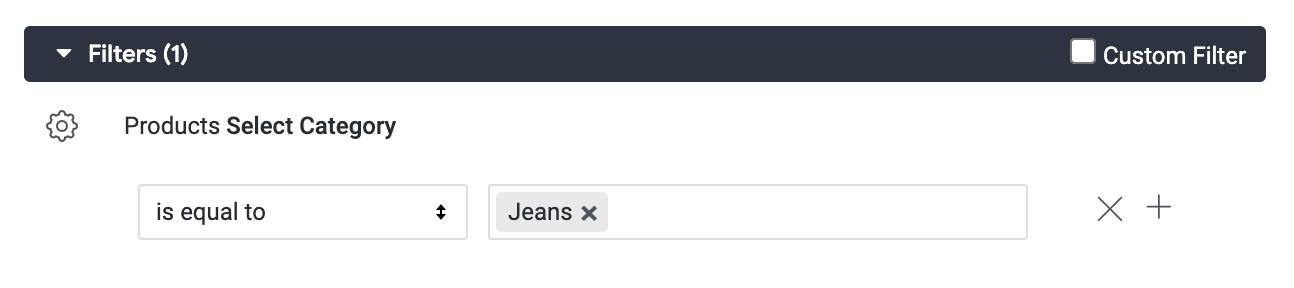
- Click Run to see the results. You should see 19,243 counts for Jeans and 145,402 counts for All Other Categories.
-
Templated filter logic adapts automatically as the user updates the filter. See this for yourself:
- Try adding multiple values into the filter
- Try changing the filter from “is equal to” to “contains” or “starts with”. What does that look like?
-
Click on the SQL tab to review the SQL after each run.
Note: While looking at the SQL tab is useful for inspecting how the query is formatted from LookML, the process of analyzing the SQL promotes the appropriate process for troubleshooting any errors you may have.
- Navigate back to the Products view.
Commit changes and deploy to production
-
Click Validate LookML and then click Commit Changes & Push.
-
Add a commit message and click Commit.
-
Lastly, click Deploy to Production.
Click Check my progress to verify that you've performed the above task.
Create a dynamic dimension using templated filters
Task 4. Create a dynamic measure using templated filters
You can combine templated filters with a hidden dimension to adjust the filter criteria of a filtered measure, resulting in dynamic measure values.
For example, a common use case for a marketing team is the need to analyze the share of users coming from each traffic source. In this section, you will be able to address this use case by creating a measure that allows a user to choose any available Traffic Source and see a dynamic count of users (by dimension, such as country) for the selected traffic source.
- Back in the Looker IDE, navigate to the users view file.
Again, you first need to create something in the UI for the end user to interact with. For a templated filter, you need the filter object.
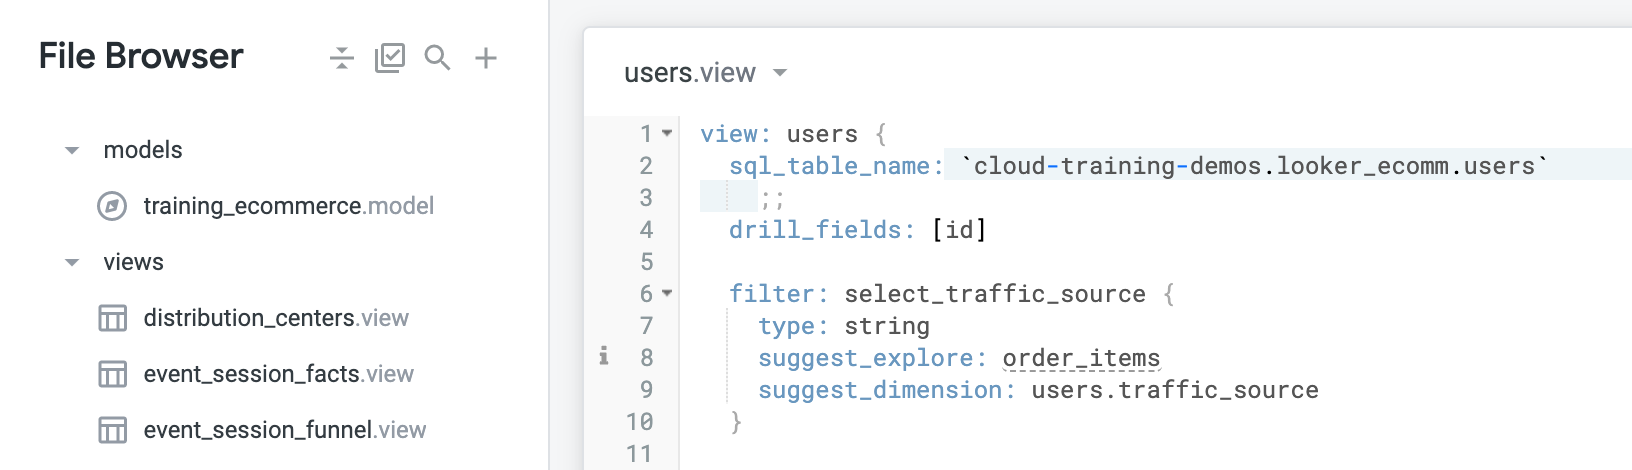
- In the users view file, above all dimensions, add the following syntax for the new filter (~line 6 under
drill_fields):
filter: select_traffic_source {
type: string
suggest_explore: order_items
suggest_dimension: users.traffic_source
}
No values are hard-coded, but there are suggested values for an explore and dimension, which will be used to populate a drop-down menu available to users. Users can still input other values.
Note: This is very similar to the filter you made in the previous section. However, here you are setting the Explore to order_items and the dimension to users.traffic_source.
Your file should now resemble the following:
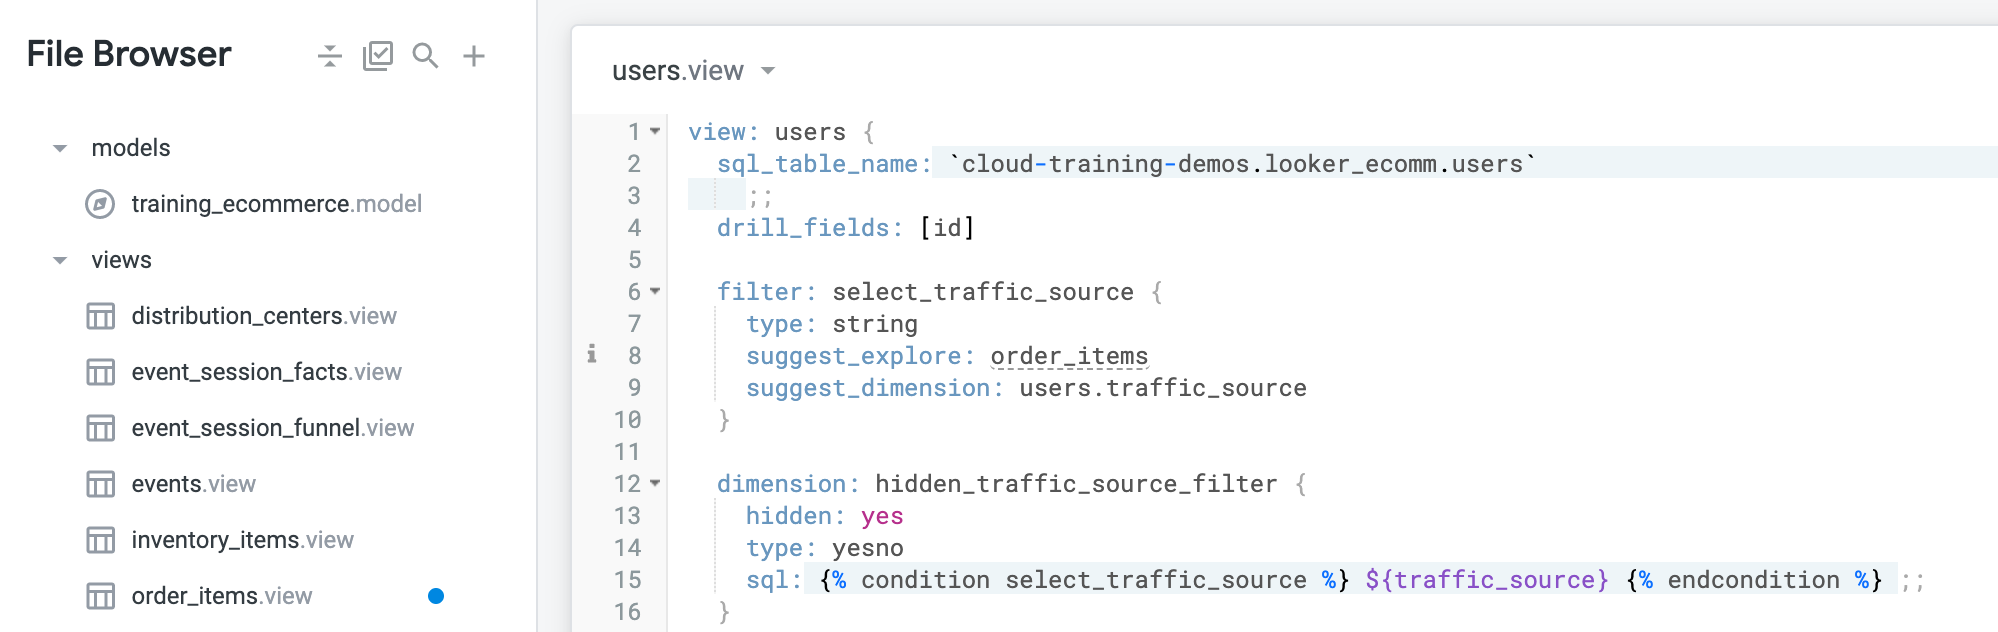
- Next, you will define the hidden dimension in the same view file. In the users view file, after the filter definition, add the following syntax for the new hidden dimension (~line 12). Notice that the filter created in the previous step is referenced in the
sql parameter:
dimension: hidden_traffic_source_filter {
hidden: yes
type: yesno
sql: {% condition select_traffic_source %} ${traffic_source} {% endcondition %} ;;
}
Your file should now resemble the following:
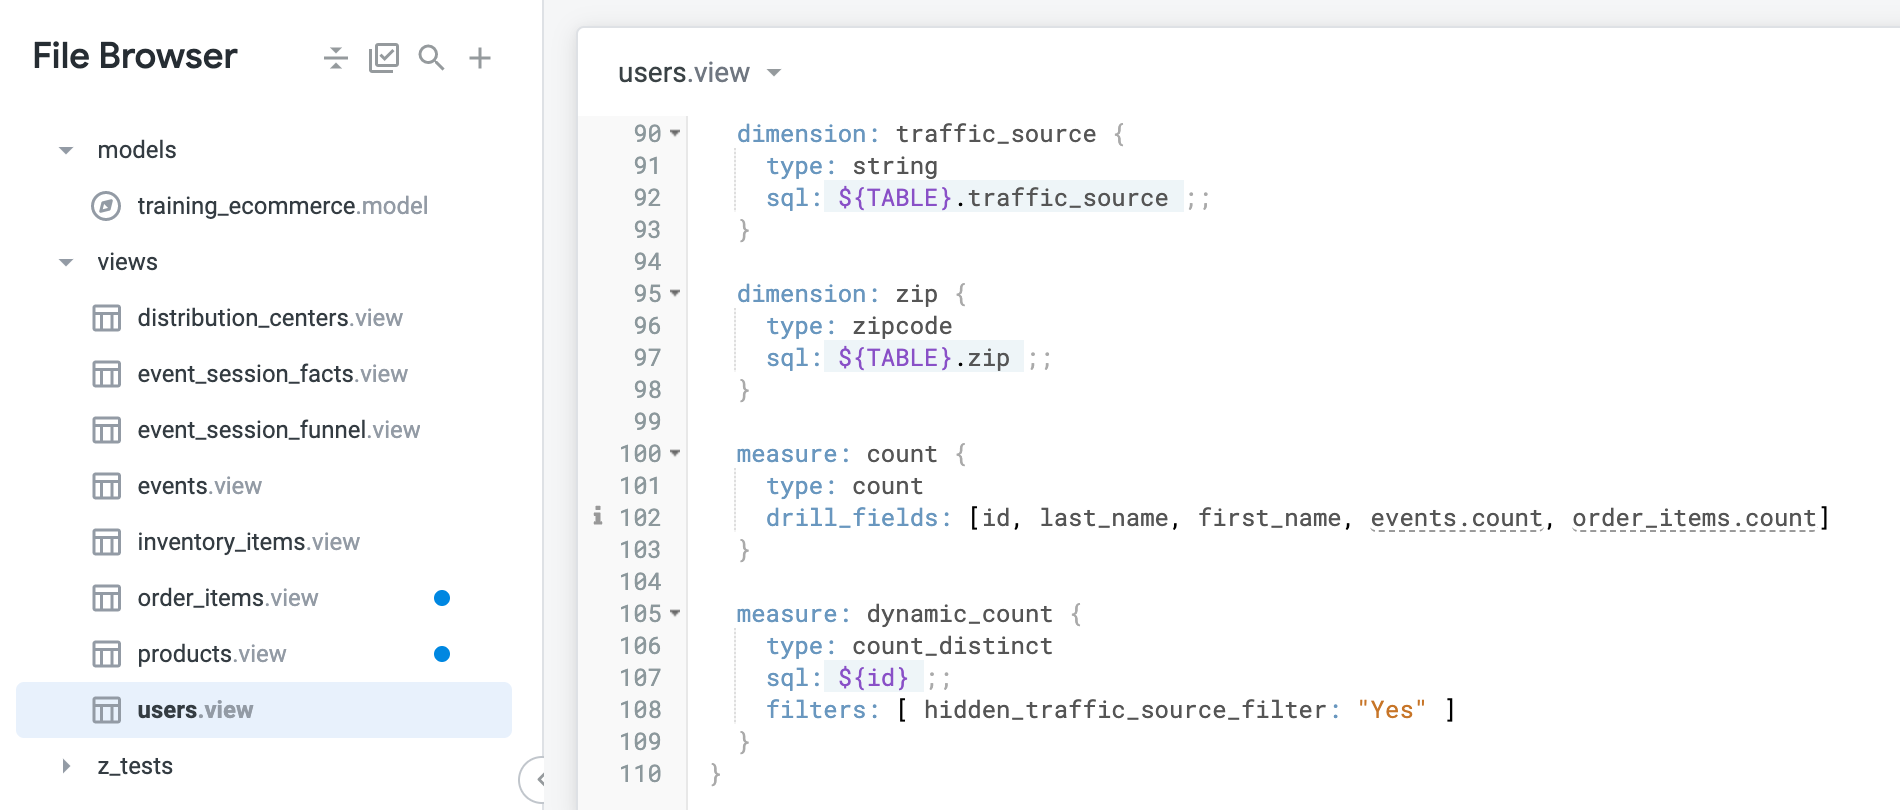
- Lastly, you will define the dynamic measure in the same view file. In the users view file, after all the dimension definitions, add the following syntax for the new dynamic measure (~line 105):
Note: Notice that the hidden dimension created in the previous step is referenced in the filter parameter.
measure: dynamic_count {
type: count_distinct
sql: ${id} ;;
filters: [ hidden_traffic_source_filter: "Yes" ]
}
Your file should now resemble the following:
Now you can test the dynamic measure in the Order Items Explore.
-
Click Save Changes. Next, navigate to the Order Items Explore.
-
Under the Users view, select the Country dimension (or some other dimension to get a count by attribute).
-
Select the new Dynamic Count measure under the Users view.
-
Click on the filter icon next to the new Filter-Only Field called Select Traffic Source (note: this is the templated filter and is listed in the left menu of the Explore above the Dimension.
-
For the filter value at the top of the UI, leave “is equal to” selected.
-
Click in the empty text box to see the drop-down menu, or type Email (you will also see other possible values in a drop-down menu).
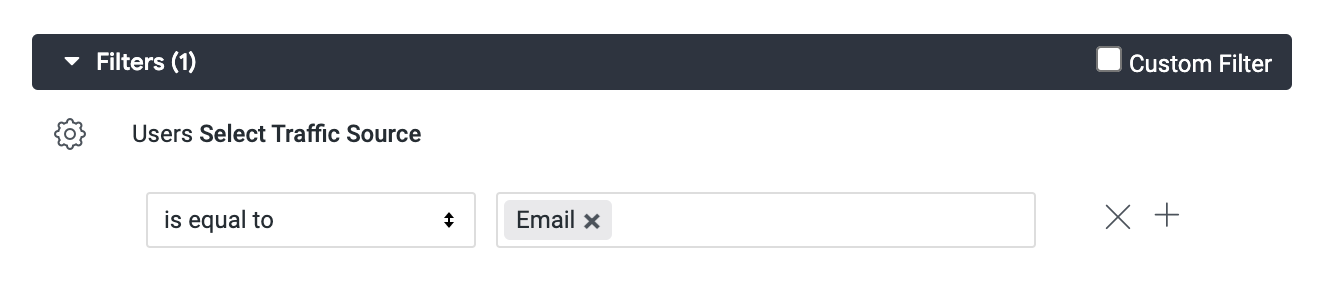
- Click Run to see the results. You will see the count for each country for all users with the traffic source equal to Email.

Click Check my progress to verify that you've performed the above task.
Create a dynamic measure using templated filters
-
Try playing around with some other filter values, and click the SQL tab to review how the parameter is changing and is inserted into the SQL query for each run.
-
Navigate back to the Users view.
Commit changes and deploy to production
-
Click Validate LookML and then click Commit Changes & Push.
-
Add a commit message and click Commit.
-
Lastly, click Deploy to Production.
Congratulations!
In this lab, you used Liquid in Looker to create parameters, templated filters, and dynamic dimensions and measures. You started by creating a parameter and dynamic dimension that together enabled users to choose between different order creation date fields. You then created a dynamic dimension that took an input value for product category and created two groups in the results: the original category selected and all other categories. Lastly, you created a dynamic measure that allowed a user to choose any available traffic source and see a dynamic count of users for it.
Next steps / Learn more
Google Cloud training and certification
...helps you make the most of Google Cloud technologies. Our classes include technical skills and best practices to help you get up to speed quickly and continue your learning journey. We offer fundamental to advanced level training, with on-demand, live, and virtual options to suit your busy schedule. Certifications help you validate and prove your skill and expertise in Google Cloud technologies.
Manual Last Updated November 13, 2024
Lab Last Tested November 13, 2024
Copyright 2025 Google LLC. All rights reserved. Google and the Google logo are trademarks of Google LLC. All other company and product names may be trademarks of the respective companies with which they are associated.


