Checkpoints
Create the view file for SQL derived table
/ 30
Add measures to answer business questions
/ 40
Update a SQL derived table to generate dynamic values using templated filters
/ 30
Creating dynamic SQL derived tables with LookML and Liquid
GSP932

Overview
Looker is a modern data platform in Google Cloud that lets you analyze and visualize your data interactively. You can use Looker to do in-depth data analysis, integrate insights across different data sources, build actionable data-driven workflows, and create custom data applications.
In this lab, you learn how to create and update SQL derived tables to generate dynamic values and address multiple use cases.
What you'll do
- Create SQL derived tables to address multiple use cases
- Update a SQL derived table to generate dynamic values using templated filters with Liquid
- Understand how business users leverage dynamic SQL derived tables to answer complex questions
Prerequisites
Familiarity with LookML is necessary. Completing Understanding LookML in Looker is recommended before beginning this lab.
Setup and requirements
Before you click the Start Lab button
Read these instructions. Labs are timed and you cannot pause them. The timer, which starts when you click Start Lab, shows how long Google Cloud resources will be made available to you.
This hands-on lab lets you do the lab activities yourself in a real cloud environment, not in a simulation or demo environment. It does so by giving you new, temporary credentials that you use to sign in and access Google Cloud for the duration of the lab.
To complete this lab, you need:
- Access to a standard internet browser (Chrome browser recommended).
- Time to complete the lab---remember, once you start, you cannot pause a lab.
How to start your lab and sign in to Looker
-
When ready, click
.
A new panel will appear with the temporary credentials that you must use for this lab.
If you need to pay for the lab, a pop-up will open for you to select your payment method.
-
Note your lab credentials in the left pane. You will use them to sign in to the Looker instance for this lab.
Note: If you use other credentials, you will get errors or incur charges. -
Click Open Looker.
-
Enter the provided Username and Password in the Email and Password fields.
Important: You must use the credentials from the Connection Details panel on this page. Do not use your Google Cloud Skills Boost credentials. If you have your own Looker account, do not use it for this lab. -
Click Log In.
After a successful login, you will see the Looker instance for this lab.
Task 1. Create a single SQL derived table to address multiple use cases
In LookML, you can define derived tables using either SQL queries to define a SQL derived table or Explore queries to define a native derived table. Using a SQL derived table is often easier for SQL developers to understand and get started with derived tables in Looker.
In this task, you will create a SQL derived table called user_facts that is flexible enough to answer multiple customer behavior questions such as the following:
- What is the Average Lifetime Revenue and Average Lifetime Order Count for all customers in each US State?
- What is the first order date and last order date for a customer, in addition to their Total Revenue (lifetime) and Total Order Count (lifetime)?
Define a new derived table using a SQL query
- First, on the bottom left of the Looker User Interface, click the toggle button to enter Development mode.
-
Click the Develop tab, and then click SQL Runner.
-
In the SQL Query window, add the following query:
In this example, the desired query selects the user_id, counts the lifetime order count for that user, and then sums the prices as a lifetime revenue for the user. It also determines the minimum and maximum values of the created_at column as the first order date and last order date, respectively.
The GROUP BY clause is used to group the results by user_id, and the LIMIT clause is used to limit the results, as you only need to review a subset of records to ensure that your query is working successfully.
- Click Run to see the results of your query.
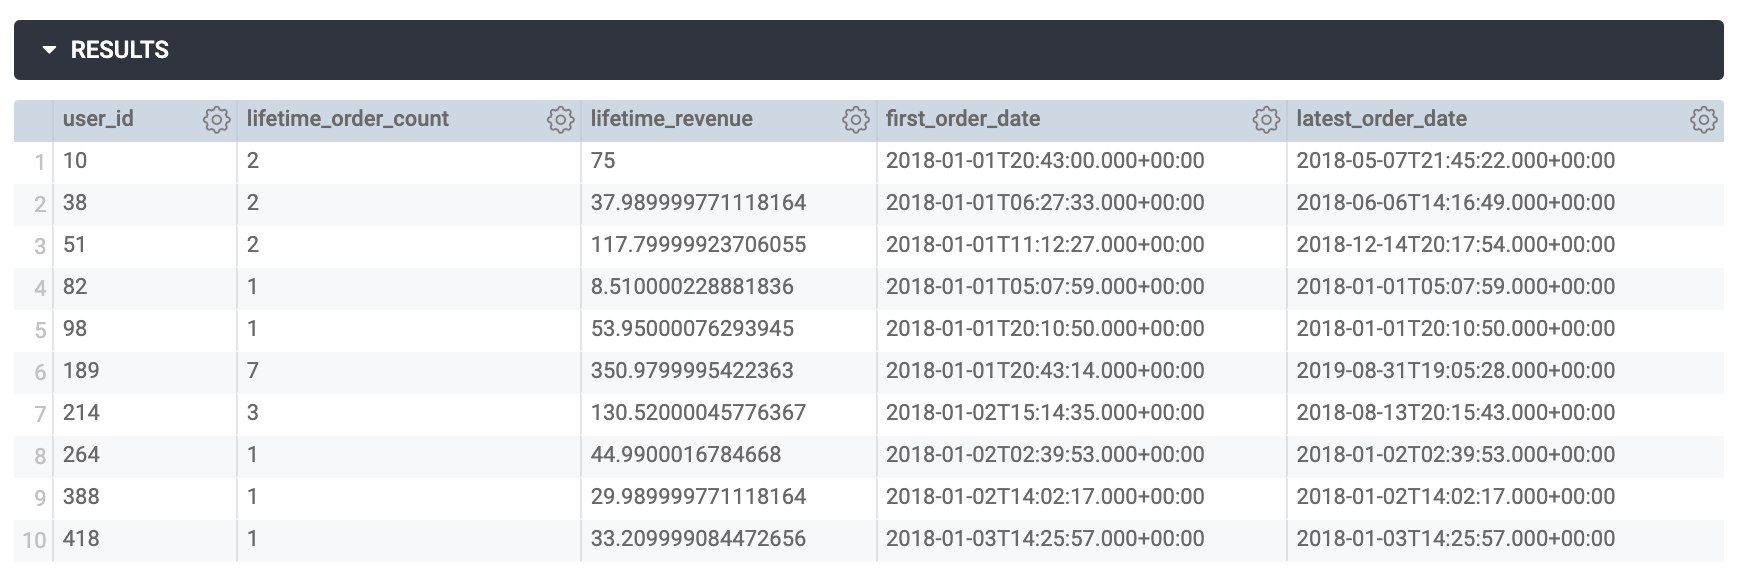
In this example, the query is indeed returning the user ID, the lifetime order count, the lifetime revenue generated from the user, and the first and last order dates.
Notice that the LIMIT clause is used to reduce the amount of data returned during this test; you will remove the LIMIT clause in an upcoming step when you create a new view file for the SQL derived table.
Create a new view file for the SQL derived table
-
Click on Settings (
) next to Run (top right of page), and select Add to Project.
-
For Project, select qwiklabs-ecommerce.
-
For View Name, type:
user_facts. -
Click Add.
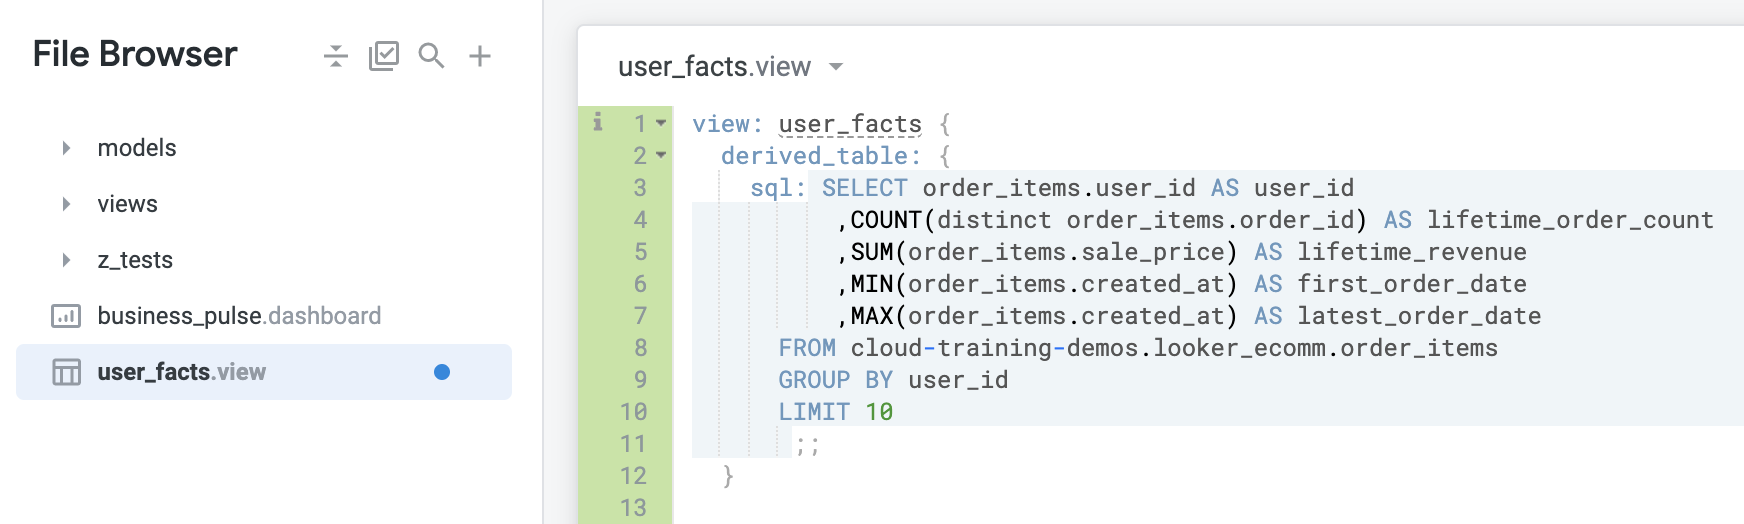
You are redirected to the Looker IDE to review the newly created view file for your SQL derived table. You can see that Looker auto-generates a view file for the SQL derived table based on the query you entered in the SQL Runner. The first 12 lines of the view file are shown below:
In Looker, your file should resemble the following:
Notice that the new user_facts view has been created outside of the views folder. It is a best practice to keep the view files organized in the project.
-
Click on the arrow next to views to see the list of views.
-
Click
user_facts.viewand drag it under the views folder. -
Click
user_facts.viewto see the view file for the SQL derived table.
Looker auto-generates a dimension for each column in the SELECT clause of the SQL query as well as a new count measure. In the next steps, you modify the view file to remove the LIMIT clause which is no longer desired, hide the new count measure, and add a primary key for the view.
- Delete the code line for
LIMIT 10from the sql parameter.
As highlighted previously, Looker auto-generates a count measure along with the dimensions used in the derived table. Sometimes this auto-generated count measure is not valuable, if you already have a count in another view that provides the same number.
In this example, the auto-generated count measure is counting the order IDs, and there is already a count of orders in the order_items view.
You can delete or hide the count measure using the hidden: yes parameter. Hiding the measure is a good idea if you would like to retain it for validation if this count is the same as another count.
- In the measure: count definition, add a new line before
type: count, and insert the following:
A final best practice is to make sure that the new view has a primary key.
In this example, you can add the primary_key: yes parameter to the user_id dimension, which is the central organizing ID of this view that provides details about each individual order.
- In the dimension: user_id definition, add a new line before
type: number, and insert the following:
The new view called user_facts is now ready for you to create new dimensions and measures, join it to the explore in the model file, and/or finish out the Git workflow to send your changes to production. You will continue building on this in the next sections.
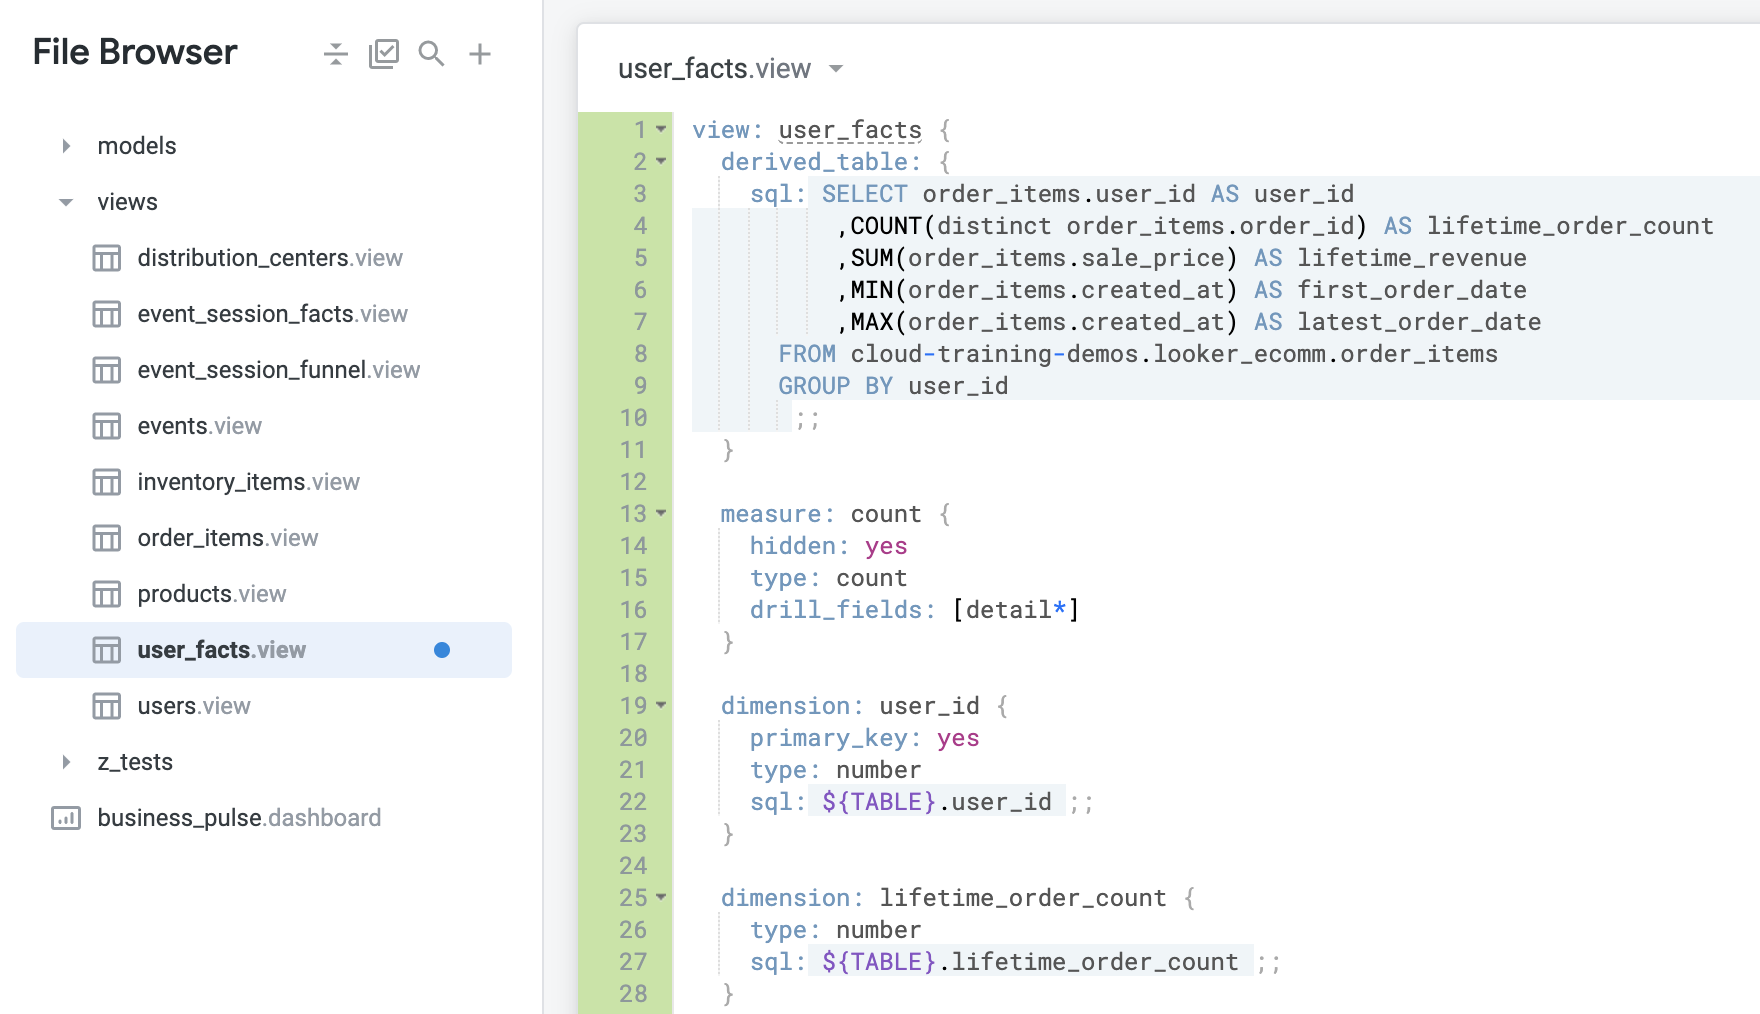
- Click Save Changes. The updated code should resemble the following:
In Looker, your file should resemble the following:
Commit changes and deploy to production
-
Click Validate LookML and then click Commit Changes & Push.
-
Add a commit message and click Commit.
-
Lastly, click Deploy to Production.
Click Check my progress to verify the objective.
Task 2. Add measures to answer business questions
In this section, you will add a two measures to answer the initial customer behavior question you were interested in: What is the Average Lifetime Revenue and Average Lifetime Order Count for all customers in each US State?
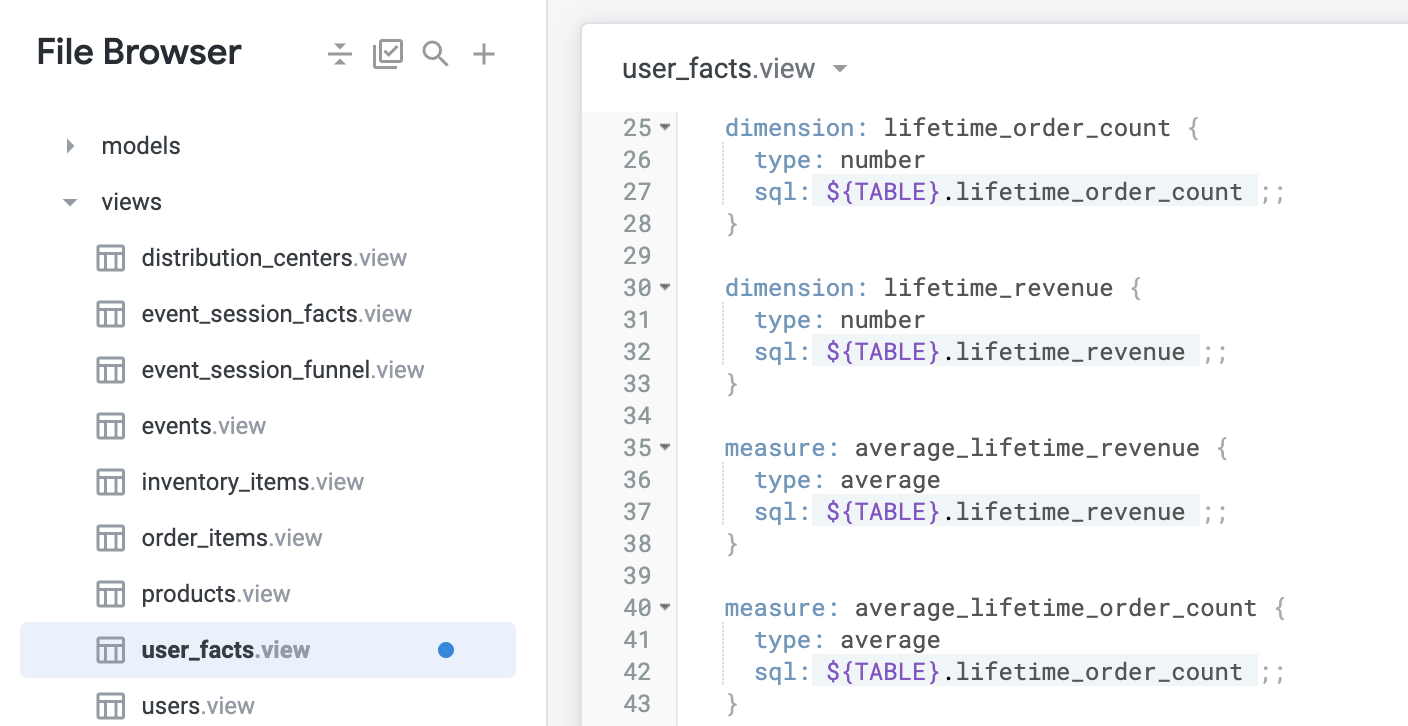
- In the user_facts.view view, add two measures:
average_lifetime_revenueandaverage_lifetime_order_countthat calculate the average lifetime revenue and average lifetime order count:
- Click Save Changes. Your view should resemble:
Join the new view to an Explore
In this section, you will review and test the new derived table. You will first join it to the order_items explore definition in the model file, and then use the Order Items Explore to review what business users would see if you pushed the changes to production.
-
From the same page, click on the
training_ecommerce.modelfile inside of the model folder to modify its contents. -
Locate the
explore: order_itemsdefinition. Notice that there are several joins already defined such as the one for the users view.
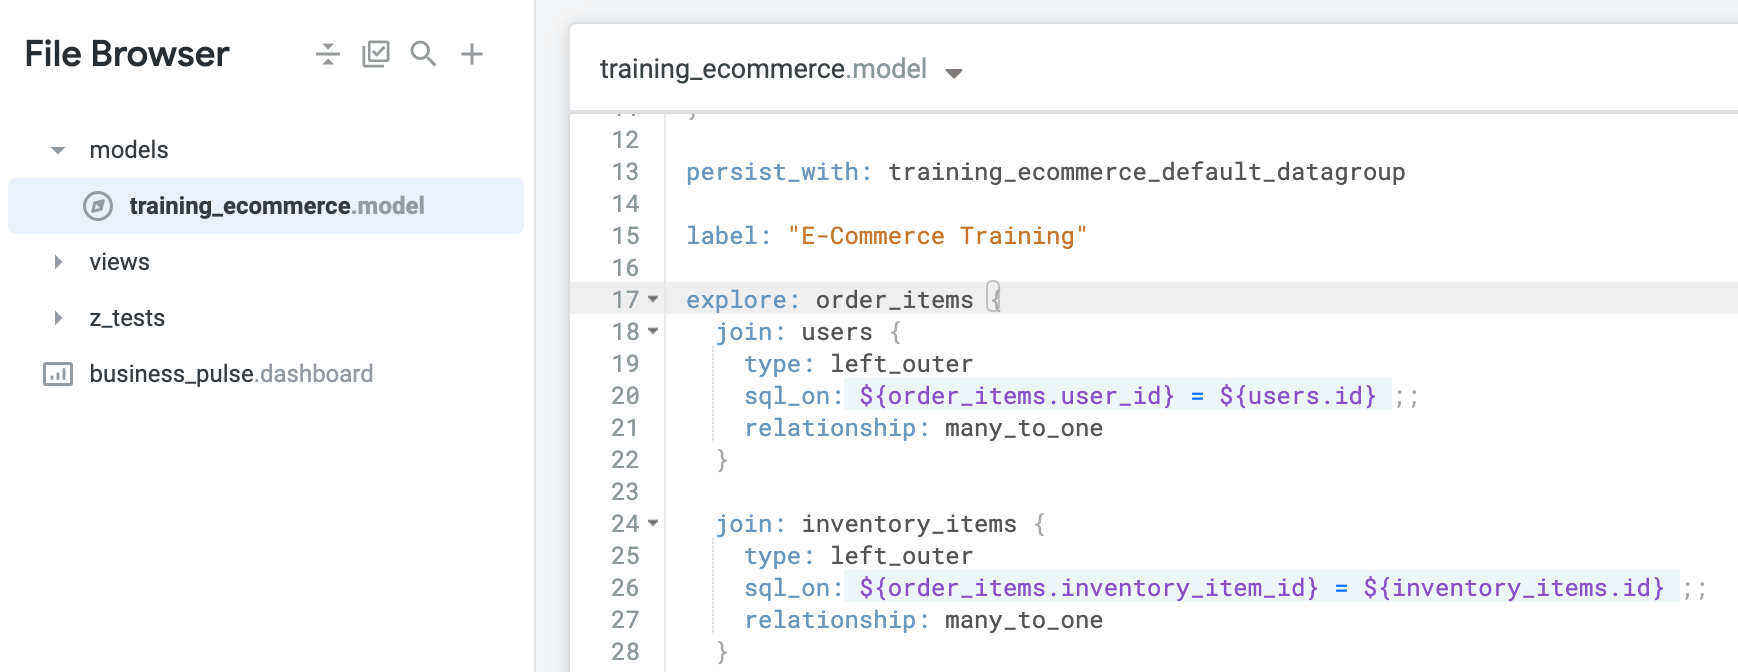
- In the
explore: order_itemsdefinition, above the existing join for users, add a new join foruser_factsby specifying:
The sql_on parameter identifies the join field as user_id. The relationship parameter identifies that there are potentially many instances of an user_id in order_items but only one instance of each user_id in user_facts, which is organized as one summary row for each order.
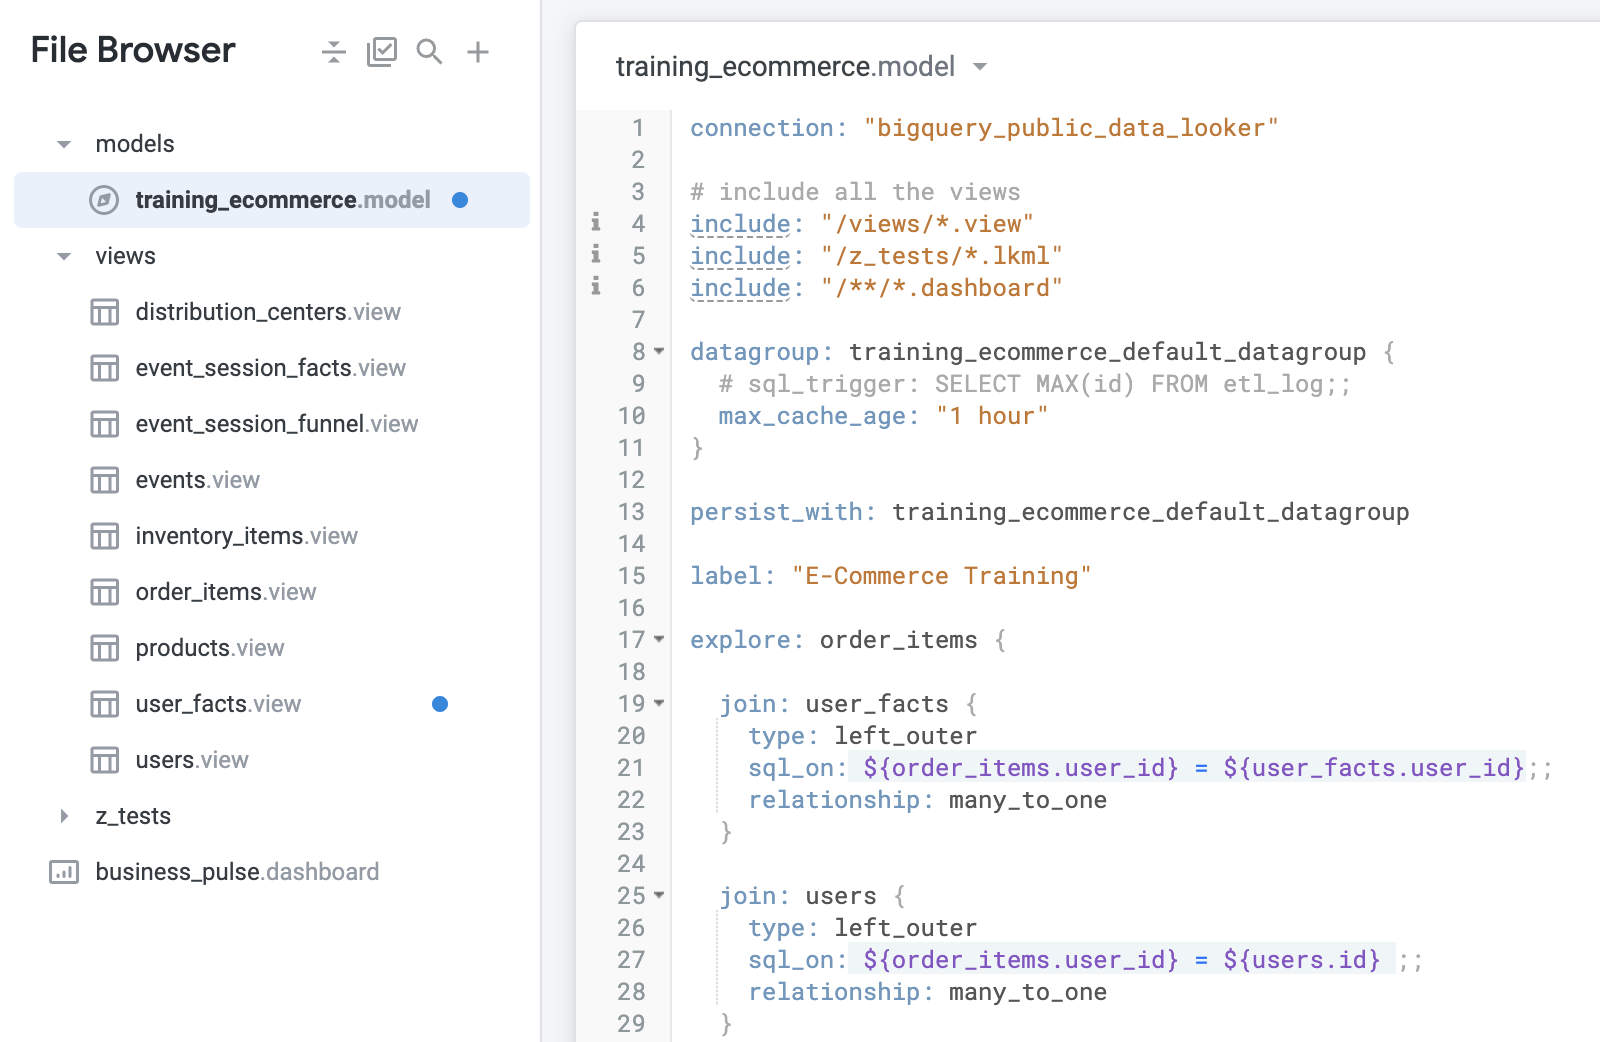
- Click Save Changes. Your explore should now include the following:
In Looker, your view should now resemble:
-
Now that you've joined the view to the Explore, navigate to the Explore page for Order Items.
-
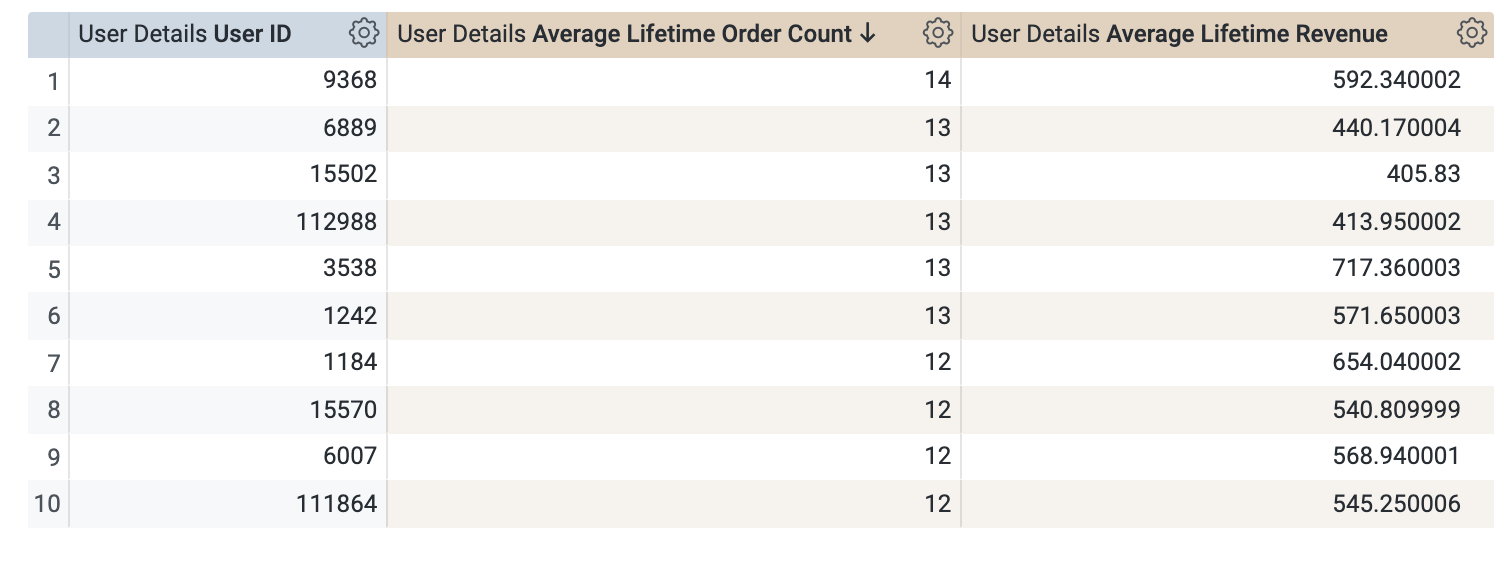
Under the User Facts view, select the User ID dimension, and the Average Lifetime Order Count and Average Lifetime Revenue measures.
-
Set the Row Limit to 100.
-
Click Run. The results should resemble the following:
-
Now, remove the User ID dimension and add the State dimension from the Users view.
-
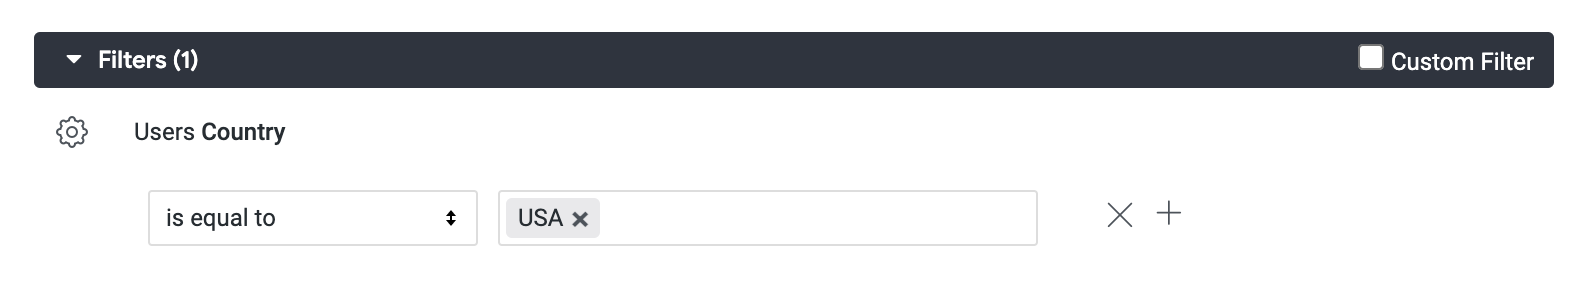
Click the Country dimension and add a filter on it.
-
Select
USA.
- Click Run to run the query again.
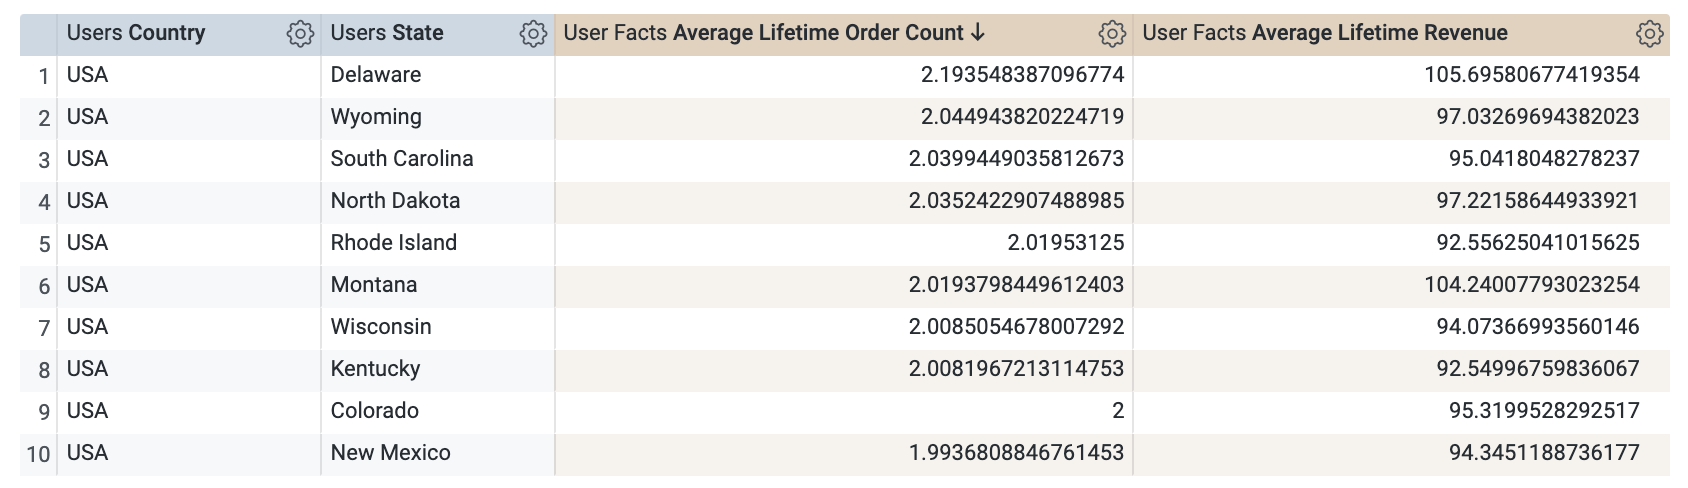
You can see how the same measures can now be used to calculate one value for Average lifetime revenue and one for Average lifetime order count per user and per state!
- Your results should resemble the following:
- Navigate back to the training_ecommerce model file.
Commit changes and deploy to production
-
Click Validate LookML and then click Commit Changes & Push.
-
Add a commit message and click Commit.
-
Lastly, click Deploy to Production.
Click Check my progress to verify the objective.
Task 3. Update a SQL derived table to generate dynamic values using templated filters
As you saw in the previous lab, templated filters follow the same logical pattern as parameters. Again, the major difference is that templated filters allow end users to choose from a number of filter operators. For the number data type, that could be “is equal to,” “is greater than,” “is between,” and so on.
In templated filters, values are not hard-coded; they are entered by users and then passed onto the generated SQL query. However, you can display a drop-down menu of options by specifying an explore and dimension in the filter definition.
In this section, you will modify the SQL derived table definition from the first section, so that it recalculates all values based on the time frame that a user has selected.
-
Navigate back to the user_facts view in the Looker IDE.
-
First, modify the SQL derived table definition as follows to include conditional
WHEREclause:
- Next, add a new filter under the
derived_tabledefinition for users to select a date:
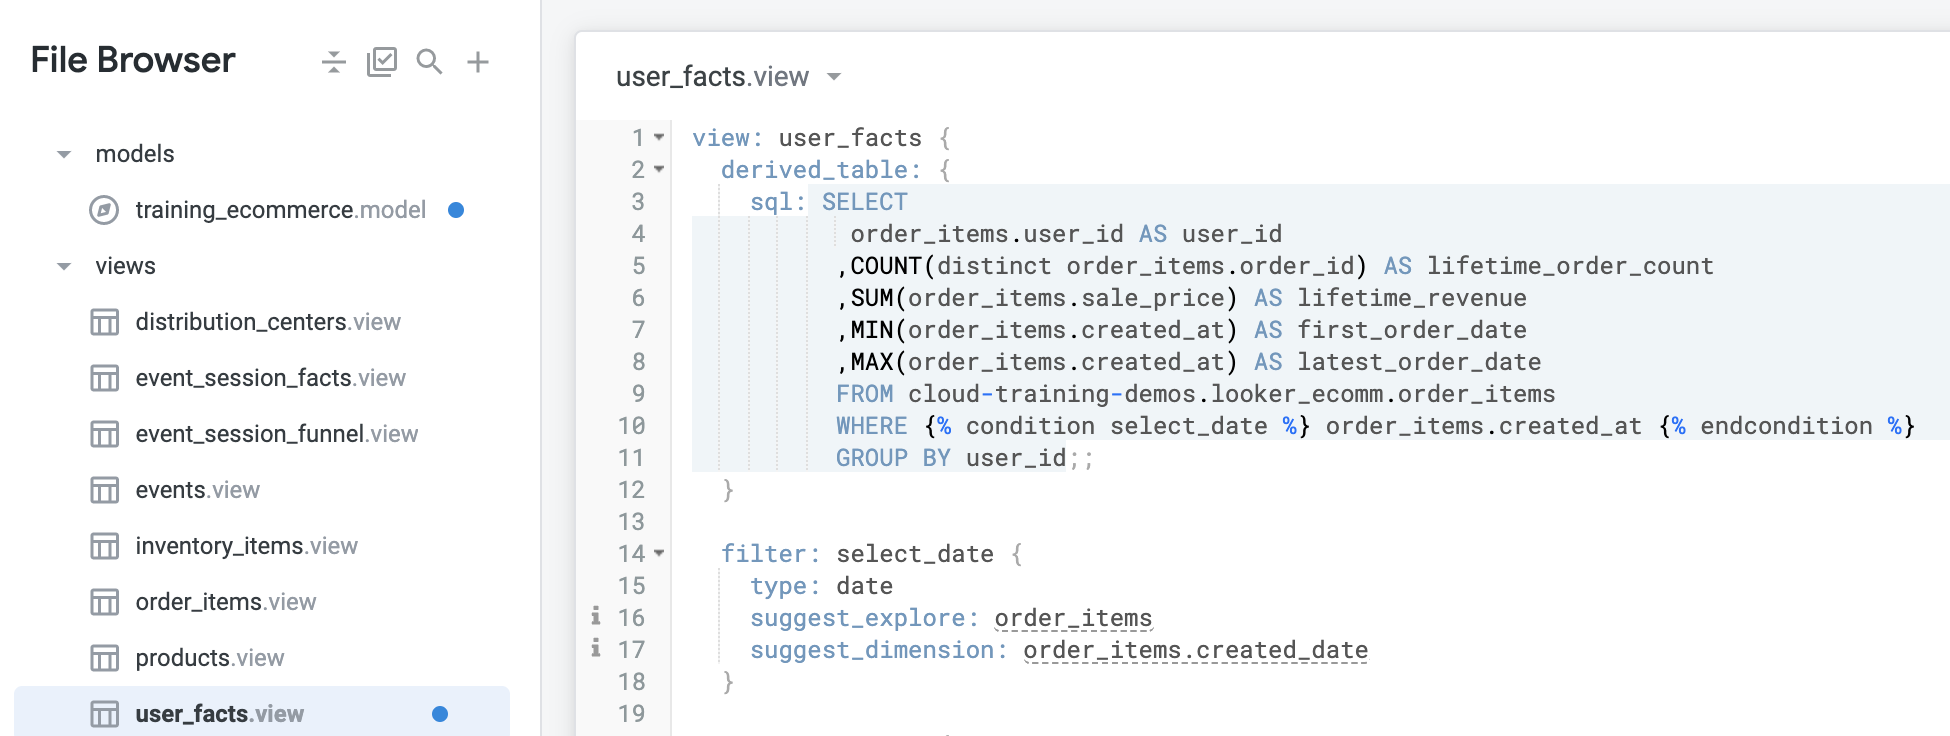
The first 18 lines of the view file should now resemble the following:
- Click Save Changes. You file should now resemble the following:
Now you will test the dynamic SQL derived table in the Order Items Explore by repeating the queries from the previous task to see that the values change when the filter is added.
-
Navigate back to the Order Items Explore.
-
Select the Average Lifetime Order Count and Average Lifetime Revenue measures under the User Facts view.
-
Select the State dimension under the Users view.
-
Click on the filter icon next to the new Filter-Only Field called Select Date under the User Facts view.
-
For the first filter value at the top of the UI, leave “is in the past” selected.
-
For the second filter value, select
complete yearsand add1to the empty value box. -
From the Users view, add a filter on Country and set it equal to
USA. -
Click Run to see the results.
You will see the Average Lifetime Order Count and Average Lifetime Revenue for each state or country for the past 1 complete year.
-
Click on the SQL tab to review the SQL.
-
At this point, you can play around with the filter values, and review the SQL tab to see how the templated filter changes the values accordingly.
-
Navigate back to the user_facts view.
Commit changes and deploy to production
-
Click Validate LookML and then click Commit Changes & Push.
-
Add a commit message and click Commit.
-
Lastly, click Deploy to Production.
Click Check my progress to verify the objective.
Congratulations!
In this lab, you created SQL derived tables to to generate dynamic values using templated filters with Liquid, and leveraged dynamic SQL derived tables to answer complex questions.
Next steps / Learn more
- LookML quick reference
- LookML terms and concepts
- Join the Looker Community
- Additional LookML basics
Google Cloud training and certification
...helps you make the most of Google Cloud technologies. Our classes include technical skills and best practices to help you get up to speed quickly and continue your learning journey. We offer fundamental to advanced level training, with on-demand, live, and virtual options to suit your busy schedule. Certifications help you validate and prove your skill and expertise in Google Cloud technologies.
Manual Last Updated April 24, 2024
Lab Last Tested April 24, 2024
Copyright 2024 Google LLC All rights reserved. Google and the Google logo are trademarks of Google LLC. All other company and product names may be trademarks of the respective companies with which they are associated.