總覽
運用 BigQuery 的 BigQuery ML (BigQuery 機器學習) 功能,資料分析師只需編寫少量程式碼,就可以建立、訓練、評估機器學習模型,並將模型用於預測結果。
BigQuery 中已載入 Google Analytics (分析) 樣本電子商務資料集,其中包含數百萬筆 Google Analytics (分析) 的 Google 商品網路商店記錄。在本研究室中,您將使用這些資料執行查詢,解答企業想瞭解消費者購物習慣時,通常會提出的問題。
目標
在本研究室中,您會瞭解如何執行下列工作:
- 使用 BigQuery 尋找公開資料集
- 查詢及探索電子商務資料集
- 建立訓練和評估資料集,供批次預測使用
- 在 BigQuery ML 中建立分類 (邏輯迴歸) 模型
- 評估機器學習模型的成效
- 對訪客購買商品的可能性進行預測及排名
設定環境
設定研究室
在每個研究室中,您都能在固定時間內免付費建立新的 Google Cloud 專案,並使用一組資源。
-
請透過無痕式視窗登入 Qwiklabs。
-
請記下研究室的存取時間 (例如 1:15:00),並確保自己能在時間限制內完成作業。
研究室不提供暫停功能。如有需要,您可以重新開始,但原先的進度恕無法保留。
-
準備就緒後,請按一下「Start lab」。
-
請記下研究室憑證 (使用者名稱和密碼),這組資訊將用於登入 Google Cloud 控制台。
-
按一下「Open Google Console」。
-
按一下「Use another account」,然後複製這個研究室的憑證,並貼入提示訊息。
如果使用其他憑證,系統會顯示錯誤或向您收取費用。
-
接受條款,然後略過資源復原頁面。
開啟 BigQuery 控制台
- 在 Google Cloud 控制台中,依序選取「導覽選單」>「BigQuery」。
接著,畫面中會顯示「歡迎使用 Cloud 控制台中的 BigQuery」訊息方塊,當中會列出快速入門指南的連結和使用者介面更新內容。
- 按一下「完成」。
存取課程資料集
開啟 BigQuery 後,在新的瀏覽器分頁中開啟 data-to-insights 專案,就能將這項專案導入 BigQuery 專案窗格。
data-to-insights 電子商務資料集的欄位定義可於 [通用 Analytics (分析)] BigQuery Export 結構定義頁面查詢。您可以在新分頁中開啟該頁面,方便隨時參考。
工作 1:探索電子商務資料
情境:資料分析師團隊已將電子商務網站的 Google Analytics (分析) 記錄匯出至 BigQuery 並建立新資料表,內含所有原始電子商務訪客工作階段的資料。您可以試著根據這些資料回答幾個問題。
問題:我們網站的所有訪客當中,購買商品的人占多少百分比?
- 按一下查詢「編輯器」。
- 在「新查詢」欄位中,加入下列內容:
#standardSQL
WITH visitors AS(
SELECT
COUNT(DISTINCT fullVisitorId) AS total_visitors
FROM `data-to-insights.ecommerce.web_analytics`
),
purchasers AS(
SELECT
COUNT(DISTINCT fullVisitorId) AS total_purchasers
FROM `data-to-insights.ecommerce.web_analytics`
WHERE totals.transactions IS NOT NULL
)
SELECT
total_visitors,
total_purchasers,
total_purchasers / total_visitors AS conversion_rate
FROM visitors, purchasers
- 點選「執行」。
結果:2.69%
問題:銷售量前 5 名的產品是哪些?
- 在查詢「編輯器」中加入下列內容,點選「執行」:
SELECT
p.v2ProductName,
p.v2ProductCategory,
SUM(p.productQuantity) AS units_sold,
ROUND(SUM(p.localProductRevenue/1000000),2) AS revenue
FROM `data-to-insights.ecommerce.web_analytics`,
UNNEST(hits) AS h,
UNNEST(h.product) AS p
GROUP BY 1, 2
ORDER BY revenue DESC
LIMIT 5;
結果:
| Row |
v2ProductName |
v2ProductCategory |
units_sold |
revenue |
| 1 |
Nest® Learning Thermostat 3rd Gen-USA - Stainless Steel |
Nest-USA |
17651 |
870976.95 |
| 2 |
Nest® Cam Outdoor Security Camera - USA |
Nest-USA |
16930 |
684034.55 |
| 3 |
Nest® Cam Indoor Security Camera - USA |
Nest-USA |
14155 |
548104.47 |
| 4 |
Nest® Protect Smoke + CO White Wired Alarm-USA |
Nest-USA |
6394 |
178937.6 |
| 5 |
Nest® Protect Smoke + CO White Battery Alarm-USA |
Nest-USA |
6340 |
178572.4 |
問題:有多少訪客在後續造訪網站時購買商品?
- 執行下列查詢來找出答案:
# visitors who bought on a return visit (could have bought on first as well
WITH all_visitor_stats AS (
SELECT
fullvisitorid, # 741,721 unique visitors
IF(COUNTIF(totals.transactions > 0 AND totals.newVisits IS NULL) > 0, 1, 0) AS will_buy_on_return_visit
FROM `data-to-insights.ecommerce.web_analytics`
GROUP BY fullvisitorid
)
SELECT
COUNT(DISTINCT fullvisitorid) AS total_visitors,
will_buy_on_return_visit
FROM all_visitor_stats
GROUP BY will_buy_on_return_visit
結果:
| Row |
total_visitors |
will_buy_on_return_visit |
| 1 |
729848 |
0 |
| 2 |
11873 |
1 |
您可以看到所有訪客當中,有 (11873 / 729848) = 1.6% 會回訪並在網站上購買商品,當中包括首次造訪時就已購買商品,回訪時又再購買的訪客。
以高單價商品而言,這種行為極為常見,因為消費者通常得做足功課、貨比三家,才能做出決定 (如購買汽車),而這個網站上的商品 (T 恤、配件等) 也稍微反映出相同傾向。
在線上行銷領域,根據首次造訪時展現的特徵,辨識潛在客戶並向他們行銷,不僅能提高轉換率,還能降低他們流向競爭對手網站的可能性。
工作 2:選取特徵並建立訓練資料集
現在,您要在 BigQuery 中建立一個機器學習模型,用以預測新使用者日後是否可能購買商品。辨識出這些高價值使用者,有助於行銷團隊鎖定目標,推出特惠和廣告活動。
Google Analytics (分析) 會對使用者造訪這個電子商務網站的行為,擷取各種維度和度量。請瀏覽 [通用 Analytics (分析)] BigQuery Export 結構定義指南中的完整欄位清單,接著預覽示範資料集找出實用特徵,協助機器學習模型瞭解下列資料的關聯性:訪客首次造訪網站,以及他們是否會回訪並購買商品。
您的團隊決定以這兩個欄位做為分類模型的輸入資料,看看能否取得理想結果:
-
totals.bounces (訪客是否立即離開網站)
-
totals.timeOnSite (訪客在網站上停留的時間)
機器學習的成效取決於輸入的訓練資料是否完備。如果資訊不足,導致模型無法判斷及學習輸入特徵和標籤之間的關聯性 (在本例中,指的是消費者日後是否會購買商品),您就無法建立準確的模型。雖然使用這兩個欄位訓練模型只是第一步,但您會看到這兩個欄位是否足以產生精確的模型。
SELECT
* EXCEPT(fullVisitorId)
FROM
# features
(SELECT
fullVisitorId,
IFNULL(totals.bounces, 0) AS bounces,
IFNULL(totals.timeOnSite, 0) AS time_on_site
FROM
`data-to-insights.ecommerce.web_analytics`
WHERE
totals.newVisits = 1)
JOIN
(SELECT
fullvisitorid,
IF(COUNTIF(totals.transactions > 0 AND totals.newVisits IS NULL) > 0, 1, 0) AS will_buy_on_return_visit
FROM
`data-to-insights.ecommerce.web_analytics`
GROUP BY fullvisitorid)
USING (fullVisitorId)
ORDER BY time_on_site DESC
LIMIT 10;
結果:
| Row |
bounces |
time_on_site |
will_buy_on_return_visit |
| 1 |
0 |
15047 |
0 |
| 2 |
0 |
12136 |
0 |
| 3 |
0 |
11201 |
0 |
| 4 |
0 |
10046 |
0 |
| 5 |
0 |
9974 |
0 |
| 6 |
0 |
9564 |
0 |
| 7 |
0 |
9520 |
0 |
| 8 |
0 |
9275 |
1 |
| 9 |
0 |
9138 |
0 |
| 10 |
0 |
8872 |
0 |
討論:在使用者首次造訪後,還無法得知 will_buy_on_return_visit。別忘了,您的預測對象是回訪網站並購買商品的那一群使用者。您在預測時不知道未來的情況,因此無法確定新訪客是否會回訪並購買商品。我們希望根據訪客首次造訪期間的資料,瞭解消費者日後購買商品的可能性,這也是建構機器學習模型的價值所在。
問題:以初步資料結果而言,time_on_site 和 bounces 是否為理想指標,有助於預測使用者回訪並購買商品的可能性?
回答:在訓練及評估模型前,通常無法下定論,但目前看來,排名前 10 的 time_on_site 中,只有 1 位消費者回訪並購買商品,準確度並不高。接著看看這個模型的成效。
工作 3:建立 BigQuery 資料集來儲存模型
接著請建立新的 BigQuery 資料集,這個資料集也會用於儲存機器學習模型。
- 在左側窗格中,依序點選專案名稱 >「查看動作」
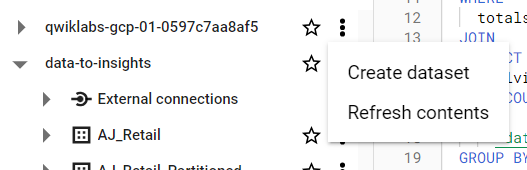
- 在「建立資料集」對話方塊中:
- 在「資料集 ID」部分,輸入 ecommerce。
- 其他設定均保留預設值。
- 點選「建立資料集」。
工作 4:選取 BigQuery 機器學習模型類型,並指定選項
您已選取初始特徵,現在可以在 BigQuery 中建立第一個機器學習模型。
有兩種模型可供選擇:
| 模型 |
模型類型 |
標籤資料類型 |
範例 |
| 預測 |
linear_reg |
數值 (通常為整數或浮點值) |
根據以往的銷售資料,預測來年的銷售額。 |
| 分類 |
logistic_reg |
以 0 或 1 表示的二元分類 |
根據背景資訊,將電子郵件歸類為垃圾郵件或非垃圾郵件。 |
注意:機器學習技術還能使用許多其他的模型類型 (例如類神經網路和決策樹),這些模型是以 TensorFlow 等程式庫提供。撰寫本文件時,BigQuery ML 支援上述兩種模型。
- 輸入下列查詢來建立模型,並指定模型選項:
CREATE OR REPLACE MODEL `ecommerce.classification_model`
OPTIONS
(
model_type='logistic_reg',
labels = ['will_buy_on_return_visit']
)
AS
#standardSQL
SELECT
* EXCEPT(fullVisitorId)
FROM
# features
(SELECT
fullVisitorId,
IFNULL(totals.bounces, 0) AS bounces,
IFNULL(totals.timeOnSite, 0) AS time_on_site
FROM
`data-to-insights.ecommerce.web_analytics`
WHERE
totals.newVisits = 1
AND date BETWEEN '20160801' AND '20170430') # train on first 9 months
JOIN
(SELECT
fullvisitorid,
IF(COUNTIF(totals.transactions > 0 AND totals.newVisits IS NULL) > 0, 1, 0) AS will_buy_on_return_visit
FROM
`data-to-insights.ecommerce.web_analytics`
GROUP BY fullvisitorid)
USING (fullVisitorId)
;
- 接著點選「執行」,開始訓練模型。
等模型訓練完成 (5 至 10 分鐘)。
注意:因為需保留部分資料點用於模型評估及測試,您無法在訓練期間將所有可用資料輸入模型。為了達成這個目標,請新增 WHERE 子句條件,在 12 個月的資料集中,只篩選出前 9 個月的工作階段資料來訓練模型。模型訓練完成後,畫面上會顯示下列訊息:「This statement created a new model named qwiklabs-gcp-xxxxxxxxx:ecommerce.classification_model」。
- 點選「前往模型」。
查看並確認電子商務資料集中現在是否出現 classification_model。
接下來,您將使用新資料評估模型成效。
工作 5:評估分類模型成效
選取成效條件
以機器學習技術的分類問題而言,您的目標在於盡可能降低偽陽率 (預測使用者會回訪並購買商品,結果並非如此),同時盡量提高真陽率 (預測使用者會回訪並購買商品,結果也的確如此)。
這個關聯性可透過 ROC 曲線以視覺化方式呈現,如此處所示,建議您盡可能增加曲線下的面積 (AUC):
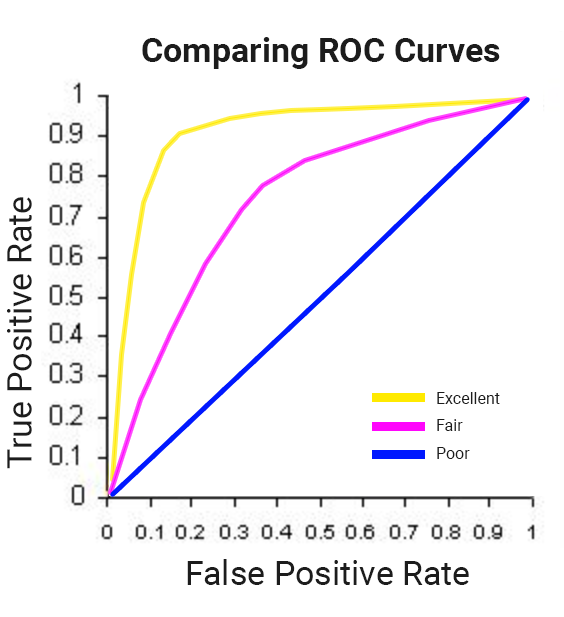
在 BigQuery ML 中,roc_auc 是您在評估訓練好的機器學習模型時,可供查詢的欄位。
- 模型已訓練完成,您可以使用
ML.EVALUATE 執行下列查詢,評估模型成效:
SELECT
roc_auc,
CASE
WHEN roc_auc > .9 THEN 'good'
WHEN roc_auc > .8 THEN 'fair'
WHEN roc_auc > .7 THEN 'not great'
ELSE 'poor' END AS model_quality
FROM
ML.EVALUATE(MODEL ecommerce.classification_model, (
SELECT
* EXCEPT(fullVisitorId)
FROM
# features
(SELECT
fullVisitorId,
IFNULL(totals.bounces, 0) AS bounces,
IFNULL(totals.timeOnSite, 0) AS time_on_site
FROM
`data-to-insights.ecommerce.web_analytics`
WHERE
totals.newVisits = 1
AND date BETWEEN '20170501' AND '20170630') # eval on 2 months
JOIN
(SELECT
fullvisitorid,
IF(COUNTIF(totals.transactions > 0 AND totals.newVisits IS NULL) > 0, 1, 0) AS will_buy_on_return_visit
FROM
`data-to-insights.ecommerce.web_analytics`
GROUP BY fullvisitorid)
USING (fullVisitorId)
));
畫面上應會顯示下列結果:
| Row |
roc_auc |
model_quality |
| 1 |
0.724588 |
not great |
評估模型後,您得到 0.72 的 roc_auc,這表示模型的預測能力不盡理想。目標是讓曲線下面積盡可能接近 1.0,因此還有改善空間。
工作 6:運用特徵工程提升模型成效
如前所述,關於訪客首次造訪的行為,以及後續回訪並購買商品的可能性,資料集中有許多其他特徵,或許能協助模型深入瞭解這兩者之間的關聯性。
請新增幾項新特徵,建立第二個機器學習模型,並命名為 classification_model_2:
- 訪客首次造訪時,完成結帳程序的進度
- 訪客來自何處 (流量來源:自然搜尋、網站推薦等)
- 裝置類別 (行動裝置、平板電腦、桌上型電腦)
- 地理位置資訊 (國家/地區)
- 執行下列查詢來建立第二個模型:
CREATE OR REPLACE MODEL `ecommerce.classification_model_2`
OPTIONS
(model_type='logistic_reg', labels = ['will_buy_on_return_visit']) AS
WITH all_visitor_stats AS (
SELECT
fullvisitorid,
IF(COUNTIF(totals.transactions > 0 AND totals.newVisits IS NULL) > 0, 1, 0) AS will_buy_on_return_visit
FROM `data-to-insights.ecommerce.web_analytics`
GROUP BY fullvisitorid
)
# add in new features
SELECT * EXCEPT(unique_session_id) FROM (
SELECT
CONCAT(fullvisitorid, CAST(visitId AS STRING)) AS unique_session_id,
# labels
will_buy_on_return_visit,
MAX(CAST(h.eCommerceAction.action_type AS INT64)) AS latest_ecommerce_progress,
# behavior on the site
IFNULL(totals.bounces, 0) AS bounces,
IFNULL(totals.timeOnSite, 0) AS time_on_site,
totals.pageviews,
# where the visitor came from
trafficSource.source,
trafficSource.medium,
channelGrouping,
# mobile or desktop
device.deviceCategory,
# geographic
IFNULL(geoNetwork.country, "") AS country
FROM `data-to-insights.ecommerce.web_analytics`,
UNNEST(hits) AS h
JOIN all_visitor_stats USING(fullvisitorid)
WHERE 1=1
# only predict for new visits
AND totals.newVisits = 1
AND date BETWEEN '20160801' AND '20170430' # train 9 months
GROUP BY
unique_session_id,
will_buy_on_return_visit,
bounces,
time_on_site,
totals.pageviews,
trafficSource.source,
trafficSource.medium,
channelGrouping,
device.deviceCategory,
country
);
注意:對於新模型,您仍需使用同樣前 9 個月的資料進行訓練。請務必使用相同的訓練資料集,才能確定模型輸出結果獲得改善,是出於較理想的輸入特徵,而不是使用全新或不同的訓練資料。
新增至訓練資料集查詢的一項關鍵性特徵,就是每位訪客在各自工作階段中達成的最新結帳進度,這項資訊會記錄在 hits.eCommerceAction.action_type 欄位中。如果您在欄位定義中搜尋該欄位,就能看到欄位對應關係 6 = 完成購買。
此外,網站分析資料集含有類似陣列的巢狀和重複欄位,需要拆分為資料集中不同的資料列。這項作業可透過 UNNEST() 函式完成,如上述查詢所示。
等新模型訓練完成 (5 至 10 分鐘)。
- 執行下列查詢來評估新模型,看看預測能力是否提升:
#standardSQL
SELECT
roc_auc,
CASE
WHEN roc_auc > .9 THEN 'good'
WHEN roc_auc > .8 THEN 'fair'
WHEN roc_auc > .7 THEN 'not great'
ELSE 'poor' END AS model_quality
FROM
ML.EVALUATE(MODEL ecommerce.classification_model_2, (
WITH all_visitor_stats AS (
SELECT
fullvisitorid,
IF(COUNTIF(totals.transactions > 0 AND totals.newVisits IS NULL) > 0, 1, 0) AS will_buy_on_return_visit
FROM `data-to-insights.ecommerce.web_analytics`
GROUP BY fullvisitorid
)
# add in new features
SELECT * EXCEPT(unique_session_id) FROM (
SELECT
CONCAT(fullvisitorid, CAST(visitId AS STRING)) AS unique_session_id,
# labels
will_buy_on_return_visit,
MAX(CAST(h.eCommerceAction.action_type AS INT64)) AS latest_ecommerce_progress,
# behavior on the site
IFNULL(totals.bounces, 0) AS bounces,
IFNULL(totals.timeOnSite, 0) AS time_on_site,
totals.pageviews,
# where the visitor came from
trafficSource.source,
trafficSource.medium,
channelGrouping,
# mobile or desktop
device.deviceCategory,
# geographic
IFNULL(geoNetwork.country, "") AS country
FROM `data-to-insights.ecommerce.web_analytics`,
UNNEST(hits) AS h
JOIN all_visitor_stats USING(fullvisitorid)
WHERE 1=1
# only predict for new visits
AND totals.newVisits = 1
AND date BETWEEN '20170501' AND '20170630' # eval 2 months
GROUP BY
unique_session_id,
will_buy_on_return_visit,
bounces,
time_on_site,
totals.pageviews,
trafficSource.source,
trafficSource.medium,
channelGrouping,
device.deviceCategory,
country
)
));
(輸出)
| Row |
roc_auc |
model_quality |
| 1 |
0.910382 |
good |
使用新模型後,roc_auc 達到 0.91,結果明顯優於第一個模型。
模型已訓練完成,接著進行預測。
工作 7:預測哪些新訪客會回訪並購買商品
接著請編寫查詢,預測哪些新訪客會回訪並購買商品。
- 執行下列查詢,使用經過改善的分類模型,預測 Google 商品網路商店的新訪客稍後回訪時,購買商品的可能性:
SELECT
*
FROM
ml.PREDICT(MODEL `ecommerce.classification_model_2`,
(
WITH all_visitor_stats AS (
SELECT
fullvisitorid,
IF(COUNTIF(totals.transactions > 0 AND totals.newVisits IS NULL) > 0, 1, 0) AS will_buy_on_return_visit
FROM `data-to-insights.ecommerce.web_analytics`
GROUP BY fullvisitorid
)
SELECT
CONCAT(fullvisitorid, '-',CAST(visitId AS STRING)) AS unique_session_id,
# labels
will_buy_on_return_visit,
MAX(CAST(h.eCommerceAction.action_type AS INT64)) AS latest_ecommerce_progress,
# behavior on the site
IFNULL(totals.bounces, 0) AS bounces,
IFNULL(totals.timeOnSite, 0) AS time_on_site,
totals.pageviews,
# where the visitor came from
trafficSource.source,
trafficSource.medium,
channelGrouping,
# mobile or desktop
device.deviceCategory,
# geographic
IFNULL(geoNetwork.country, "") AS country
FROM `data-to-insights.ecommerce.web_analytics`,
UNNEST(hits) AS h
JOIN all_visitor_stats USING(fullvisitorid)
WHERE
# only predict for new visits
totals.newVisits = 1
AND date BETWEEN '20170701' AND '20170801' # test 1 month
GROUP BY
unique_session_id,
will_buy_on_return_visit,
bounces,
time_on_site,
totals.pageviews,
trafficSource.source,
trafficSource.medium,
channelGrouping,
device.deviceCategory,
country
)
)
ORDER BY
predicted_will_buy_on_return_visit DESC;
模型會對最後 1 個月 (在 12 個月的期間內) 的資料集進行預測。
模型現在會輸出對 2017 年 7 月電子商務工作階段的預測結果。可以看到三個新增欄位:
- predicted_will_buy_on_return_visit:模型是否認為訪客稍後會購買商品 (1 = 是)
- predicted_will_buy_on_return_visit_probs.label:表示是/否的二元分類器
- predicted_will_buy_on_return_visit_probs.prob:模型預測的可信度 (1 = 100%)
結果
- 在前 6% 的新訪客中 (預測可能性由高至低),超過 6% 在稍後回訪時購買商品。
- 在稍後回訪時購買商品的所有新訪客當中,這些使用者占了近 50% 的比例。
- 整體來看,只有 0.7% 的新訪客在稍後回訪時購買商品。
- 相較於所有新訪客,鎖定前 6% 的新訪客,能讓行銷的投資報酬率增加 9 倍!
其他資訊
roc_auc 只是模型評估作業可用的成效指標之一,其他指標還包括準確率、精確度和喚回度。哪些才是值得信賴的成效指標,主要取決於整體目標。
恭喜!
您只使用 SQL 就成功建立機器學習模型。
挑戰
摘要
在最後兩項工作中,您已目睹特徵工程的強大威力,順利改善模型成效。不過,我們或許還能透過其他模型類型,提升準確度。以分類問題來說,BigQuery ML 還支援下列幾種模型:
工作
雖然我們的線性分類 (邏輯迴歸) 模型在採用特徵工程後展現良好成效,但如要完整擷取特徵和標籤之間的關聯性,這種模型可能過於簡單。使用和工作 6 相同的資料集和標籤建立 ecommerce.classification_model_2 模型時,您面對的挑戰是建立 XGBoost 分類器。
提醒您,請為 Boosted_Tree_Classifier 使用下列選項:1. L2_reg = 0.1
2. num_parallel_tree = 8
3. max_tree_depth = 10
您可能需要查看上述連結中的說明文件,以瞭解正確語法。模型會在 7 分鐘內訓練完成。如需編寫查詢方面的協助,可在下方的「解決方案」一節找到相關資訊。
解決方案:
如要建立 XGBoost 分類器,請使用下列解決方案:
CREATE OR REPLACE MODEL `ecommerce.classification_model_3`
OPTIONS
(model_type='BOOSTED_TREE_CLASSIFIER' , l2_reg = 0.1, num_parallel_tree = 8, max_tree_depth = 10,
labels = ['will_buy_on_return_visit']) AS
WITH all_visitor_stats AS (
SELECT
fullvisitorid,
IF(COUNTIF(totals.transactions > 0 AND totals.newVisits IS NULL) > 0, 1, 0) AS will_buy_on_return_visit
FROM `data-to-insights.ecommerce.web_analytics`
GROUP BY fullvisitorid
)
# add in new features
SELECT * EXCEPT(unique_session_id) FROM (
SELECT
CONCAT(fullvisitorid, CAST(visitId AS STRING)) AS unique_session_id,
# labels
will_buy_on_return_visit,
MAX(CAST(h.eCommerceAction.action_type AS INT64)) AS latest_ecommerce_progress,
# behavior on the site
IFNULL(totals.bounces, 0) AS bounces,
IFNULL(totals.timeOnSite, 0) AS time_on_site,
totals.pageviews,
# where the visitor came from
trafficSource.source,
trafficSource.medium,
channelGrouping,
# mobile or desktop
device.deviceCategory,
# geographic
IFNULL(geoNetwork.country, "") AS country
FROM `data-to-insights.ecommerce.web_analytics`,
UNNEST(hits) AS h
JOIN all_visitor_stats USING(fullvisitorid)
WHERE 1=1
# only predict for new visits
AND totals.newVisits = 1
AND date BETWEEN '20160801' AND '20170430' # train 9 months
GROUP BY
unique_session_id,
will_buy_on_return_visit,
bounces,
time_on_site,
totals.pageviews,
trafficSource.source,
trafficSource.medium,
channelGrouping,
device.deviceCategory,
country
);
現在來評估模型,看看成效如何:
#standardSQL
SELECT
roc_auc,
CASE
WHEN roc_auc > .9 THEN 'good'
WHEN roc_auc > .8 THEN 'fair'
WHEN roc_auc > .7 THEN 'not great'
ELSE 'poor' END AS model_quality
FROM
ML.EVALUATE(MODEL ecommerce.classification_model_3, (
WITH all_visitor_stats AS (
SELECT
fullvisitorid,
IF(COUNTIF(totals.transactions > 0 AND totals.newVisits IS NULL) > 0, 1, 0) AS will_buy_on_return_visit
FROM `data-to-insights.ecommerce.web_analytics`
GROUP BY fullvisitorid
)
# add in new features
SELECT * EXCEPT(unique_session_id) FROM (
SELECT
CONCAT(fullvisitorid, CAST(visitId AS STRING)) AS unique_session_id,
# labels
will_buy_on_return_visit,
MAX(CAST(h.eCommerceAction.action_type AS INT64)) AS latest_ecommerce_progress,
# behavior on the site
IFNULL(totals.bounces, 0) AS bounces,
IFNULL(totals.timeOnSite, 0) AS time_on_site,
totals.pageviews,
# where the visitor came from
trafficSource.source,
trafficSource.medium,
channelGrouping,
# mobile or desktop
device.deviceCategory,
# geographic
IFNULL(geoNetwork.country, "") AS country
FROM `data-to-insights.ecommerce.web_analytics`,
UNNEST(hits) AS h
JOIN all_visitor_stats USING(fullvisitorid)
WHERE 1=1
# only predict for new visits
AND totals.newVisits = 1
AND date BETWEEN '20170501' AND '20170630' # eval 2 months
GROUP BY
unique_session_id,
will_buy_on_return_visit,
bounces,
time_on_site,
totals.pageviews,
trafficSource.source,
trafficSource.medium,
channelGrouping,
device.deviceCategory,
country
)
));
其中 roc_auc 增加約 .02,達到約 .94!
注意:基於訓練程序的隨機性,實際值會有差異。
roc_auc 只有少許變化,但請注意,由於 1 表示最理想的 roc_auc,值越接近 1,改善指標的難度就越高。
在 BigQuery ML 中試著使用不同模型類型,並搭配不同選項來確認模型成效,其實一點也不難,以上就是一個絕佳範例。我們只需變更一行 SQL 程式碼,就能使用更複雜的模型類型。
有人可能會問:「該如何決定選用哪些選項?」,答案是不斷嘗試!當您在尋找能解決問題的最佳模型時,需要嘗試不同的選項組合,也就是執行「超參數調整」程序。
最後,我們使用經過改善的模型產生預測結果,看看這些模型與先前產生的模型有何差異。使用強化型樹狀分類器模型後,相較於先前的模型,可以看到新的 ROC AUC 有些微改善,增加了 0.2。下列查詢會預測哪些新訪客會回訪並購買商品:
SELECT
*
FROM
ml.PREDICT(MODEL `ecommerce.classification_model_3`,
(
WITH all_visitor_stats AS (
SELECT
fullvisitorid,
IF(COUNTIF(totals.transactions > 0 AND totals.newVisits IS NULL) > 0, 1, 0) AS will_buy_on_return_visit
FROM `data-to-insights.ecommerce.web_analytics`
GROUP BY fullvisitorid
)
SELECT
CONCAT(fullvisitorid, '-',CAST(visitId AS STRING)) AS unique_session_id,
# labels
will_buy_on_return_visit,
MAX(CAST(h.eCommerceAction.action_type AS INT64)) AS latest_ecommerce_progress,
# behavior on the site
IFNULL(totals.bounces, 0) AS bounces,
IFNULL(totals.timeOnSite, 0) AS time_on_site,
totals.pageviews,
# where the visitor came from
trafficSource.source,
trafficSource.medium,
channelGrouping,
# mobile or desktop
device.deviceCategory,
# geographic
IFNULL(geoNetwork.country, "") AS country
FROM `data-to-insights.ecommerce.web_analytics`,
UNNEST(hits) AS h
JOIN all_visitor_stats USING(fullvisitorid)
WHERE
# only predict for new visits
totals.newVisits = 1
AND date BETWEEN '20170701' AND '20170801' # test 1 month
GROUP BY
unique_session_id,
will_buy_on_return_visit,
bounces,
time_on_site,
totals.pageviews,
trafficSource.source,
trafficSource.medium,
channelGrouping,
device.deviceCategory,
country
)
)
ORDER BY
predicted_will_buy_on_return_visit DESC;
從輸出結果可以看到,分類模型能更準確地預測可能性,協助我們瞭解 Google 商品網路商店的新訪客,是否會在稍後回訪時購買商品。比較上述結果與先前工作 7 中的模型成效,就能看出這個模型在預測中達到的可信度,比 logistic_regression 模型類型更準確。
關閉研究室
如果您已完成研究室,請按一下「End Lab」(關閉研究室)。Google Cloud Skills Boost 會移除您使用的資源,並清除所用帳戶。
您可以針對研究室的使用體驗評分。請選取合適的星級評等並提供意見,然後按一下「Submit」(提交)。
星級評等代表您的滿意程度:
- 1 星 = 非常不滿意
- 2 星 = 不滿意
- 3 星 = 普通
- 4 星 = 滿意
- 5 星 = 非常滿意
如果不想提供意見回饋,您可以直接關閉對話方塊。
如有任何想法、建議或指教,請透過「Support」(支援) 分頁提交。
Copyright 2022 Google LLC 保留所有權利。Google 和 Google 標誌是 Google LLC 的商標,其他公司和產品名稱則有可能是其關聯公司的商標。


