BigQuery ML (BigQuery machine learning) is a feature in BigQuery where data analysts can create, train, evaluate, and predict with machine learning models with minimal coding.
The Google Analytics Sample Ecommerce dataset that has millions of Google Analytics records for the Google Merchandise Store loaded into BigQuery. In this lab, you will use this data to run some typical queries that businesses would want to know about their customers' purchasing habits.
Objectives
In this lab, you learn to perform the following tasks:
Use BigQuery to find public datasets
Query and explore the ecommerce dataset
Create a training and evaluation dataset to be used for batch prediction
Create a classification (logistic regression) model in BigQuery ML
Evaluate the performance of your machine learning model
Predict and rank the probability that a visitor will make a purchase
Set up your environments
Lab setup
For each lab, you get a new Google Cloud project and set of resources for a fixed time at no cost.
Sign in to Qwiklabs using an incognito window.
Note the lab's access time (for example, 1:15:00), and make sure you can finish within that time.
There is no pause feature. You can restart if needed, but you have to start at the beginning.
When ready, click Start lab.
Note your lab credentials (Username and Password). You will use them to sign in to the Google Cloud Console.
Click Open Google Console.
Click Use another account and copy/paste credentials for this lab into the prompts.
If you use other credentials, you'll receive errors or incur charges.
Accept the terms and skip the recovery resource page.
Open BigQuery Console
In the Google Cloud Console, select Navigation menu > BigQuery.
The Welcome to BigQuery in the Cloud Console message box opens. This message box provides a link to the quickstart guide and lists UI updates.
Click Done.
Access the course dataset
Once BigQuery is open, open the data-to-insights project in a new browser tab to bring this project into your BigQuery projects panel.
The field definitions for the data-to-insights ecommerce dataset are on the[UA] BigQuery Export schema page. Keep the link open in a new tab for reference.
Task 1. Explore ecommerce data
Scenario: Your data analyst team exported the Google Analytics logs for an ecommerce website into BigQuery and created a new table of all the raw ecommerce visitor session data for you to explore. Using this data, you'll try to answer a few questions.
Question: Out of the total visitors who visited our website, what % made a purchase?
Click the query Editor.
Add the following to the New Query field:
#standardSQL
WITH visitors AS(
SELECT
COUNT(DISTINCT fullVisitorId) AS total_visitors
FROM `data-to-insights.ecommerce.web_analytics`
),
purchasers AS(
SELECT
COUNT(DISTINCT fullVisitorId) AS total_purchasers
FROM `data-to-insights.ecommerce.web_analytics`
WHERE totals.transactions IS NOT NULL
)
SELECT
total_visitors,
total_purchasers,
total_purchasers / total_visitors AS conversion_rate
FROM visitors, purchasers
Click Run.
The result: 2.69%
Question: What are the top 5 selling products?
Add the following query in the query EDITOR, and then click Run:
SELECT
p.v2ProductName,
p.v2ProductCategory,
SUM(p.productQuantity) AS units_sold,
ROUND(SUM(p.localProductRevenue/1000000),2) AS revenue
FROM `data-to-insights.ecommerce.web_analytics`,
UNNEST(hits) AS h,
UNNEST(h.product) AS p
GROUP BY 1, 2
ORDER BY revenue DESC
LIMIT 5;
Question: How many visitors bought on subsequent visits to the website?
Run the following query to find out:
# visitors who bought on a return visit (could have bought on first as well
WITH all_visitor_stats AS (
SELECT
fullvisitorid, # 741,721 unique visitors
IF(COUNTIF(totals.transactions > 0 AND totals.newVisits IS NULL) > 0, 1, 0) AS will_buy_on_return_visit
FROM `data-to-insights.ecommerce.web_analytics`
GROUP BY fullvisitorid
)
SELECT
COUNT(DISTINCT fullvisitorid) AS total_visitors,
will_buy_on_return_visit
FROM all_visitor_stats
GROUP BY will_buy_on_return_visit
The results:
Row
total_visitors
will_buy_on_return_visit
1
729848
0
2
11873
1
Analyzing the results, you can see that (11873 / 729848) = 1.6% of total visitors will return and purchase from the website. This includes the subset of visitors who bought on their very first session and then came back and bought again.
This behavior is very common for luxury goods where significant up-front research and comparison is required by the customer before deciding (think car purchases) but also true to a lesser extent for the merchandise on this site (t-shirts, accessories, etc).
In the world of online marketing, identifying and marketing to these future customers based on the characteristics of their first visit will increase conversion rates and reduce the outflow to competitor sites.
Task 2. Select features and create your training dataset
Now you will create a Machine Learning model in BigQuery to predict whether or not a new user is likely to purchase in the future. Identifying these high-value users can help your marketing team target them with special promotions and ad campaigns.
Google Analytics captures a wide variety of dimensions and measures about a user's visit on this ecommerce website. Browse the complete list of fields in the [UA] BigQuery Export schema Guide and then preview the demo dataset to find useful features that will help a machine learning model understand the relationship between data about a visitor's first time on your website and whether they will return and make a purchase.
Your team decides to test whether these two fields are good inputs for your classification model:
totals.bounces (whether the visitor left the website immediately)
totals.timeOnSite (how long the visitor was on our website)
Machine learning is only as good as the training data that is fed into it. If there isn't enough information for the model to determine and learn the relationship between your input features and your label (in this case, whether the visitor bought in the future) then you will not have an accurate model. While training a model on just these two fields is a start, you will see if they're good enough to produce an accurate model.
In the query EDITOR, add the following query and then click Run:
SELECT
* EXCEPT(fullVisitorId)
FROM
# features
(SELECT
fullVisitorId,
IFNULL(totals.bounces, 0) AS bounces,
IFNULL(totals.timeOnSite, 0) AS time_on_site
FROM
`data-to-insights.ecommerce.web_analytics`
WHERE
totals.newVisits = 1)
JOIN
(SELECT
fullvisitorid,
IF(COUNTIF(totals.transactions > 0 AND totals.newVisits IS NULL) > 0, 1, 0) AS will_buy_on_return_visit
FROM
`data-to-insights.ecommerce.web_analytics`
GROUP BY fullvisitorid)
USING (fullVisitorId)
ORDER BY time_on_site DESC
LIMIT 10;
Results:
Row
bounces
time_on_site
will_buy_on_return_visit
1
0
15047
0
2
0
12136
0
3
0
11201
0
4
0
10046
0
5
0
9974
0
6
0
9564
0
7
0
9520
0
8
0
9275
1
9
0
9138
0
10
0
8872
0
Discussion:will_buy_on_return_visit is not known after the first visit. Again, you're predicting for a subset of users who returned to your website and purchased. Since you don't know the future at prediction time, you cannot say with certainty whether a new visitor comes back and purchases. The value of building a ML model is to get the probability of future purchase based on the data gleaned about their first session.
Question: Looking at the initial data results, do you think time_on_site and bounces will be a good indicator of whether the user will return and purchase or not?
Answer: It's often too early to tell before training and evaluating the model, but at first glance out of the top 10 time_on_site, only 1 customer returned to buy, which isn't very promising. Let's see how well the model does.
Task 3. Create a BigQuery dataset to store models
Next, create a new BigQuery dataset which will also store your ML models.
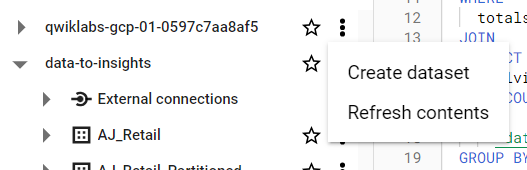
In the left pane, click on your project name, and then click on the View action icon (three dots) and select Create Dataset.
In the Create Dataset dialog:
For Dataset ID, type ecommerce.
Leave the other values at their defaults.
Click Create dataset.
Task 4. Select a BigQuery ML model type and specify options
Now that you have your initial features selected, you are now ready to create your first ML model in BigQuery.
There are the two model types to choose from:
Model
Model Type
Label Data type
Example
Forecasting
linear_reg
Numeric value (typically an integer or floating point)
Forecast sales figures for next year given historical sales data.
Classification
logistic_reg
0 or 1 for binary classification
Classify an email as spam or not spam given the context.
Note: There are many additional model types used in Machine Learning (like Neural Networks and decision trees) and available using libraries like TensorFlow. At the time of writing, BigQuery ML supports the two listed above.
Enter the following query to create a model and specify model options:
CREATE OR REPLACE MODEL `ecommerce.classification_model`
OPTIONS
(
model_type='logistic_reg',
labels = ['will_buy_on_return_visit']
)
AS
#standardSQL
SELECT
* EXCEPT(fullVisitorId)
FROM
# features
(SELECT
fullVisitorId,
IFNULL(totals.bounces, 0) AS bounces,
IFNULL(totals.timeOnSite, 0) AS time_on_site
FROM
`data-to-insights.ecommerce.web_analytics`
WHERE
totals.newVisits = 1
AND date BETWEEN '20160801' AND '20170430') # train on first 9 months
JOIN
(SELECT
fullvisitorid,
IF(COUNTIF(totals.transactions > 0 AND totals.newVisits IS NULL) > 0, 1, 0) AS will_buy_on_return_visit
FROM
`data-to-insights.ecommerce.web_analytics`
GROUP BY fullvisitorid)
USING (fullVisitorId)
;
Next, click Run to train your model.
Wait for the model to train (5 - 10 minutes).
Note: You cannot feed all of your available data to the model during training since you need to save some unseen data points for model evaluation and testing. To accomplish this, add a WHERE clause condition is being used to filter and train on only the first 9 months of session data in your 12 month dataset.
After your model is trained, you will see the message "This statement created a new model named qwiklabs-gcp-xxxxxxxxx:ecommerce.classification_model".
Click Go to model.
Look inside the ecommerce dataset and confirm classification_model now appears.
Next, you will evaluate the performance of the model against new unseen evaluation data.
Task 5. Evaluate classification model performance
Select your performance criteria
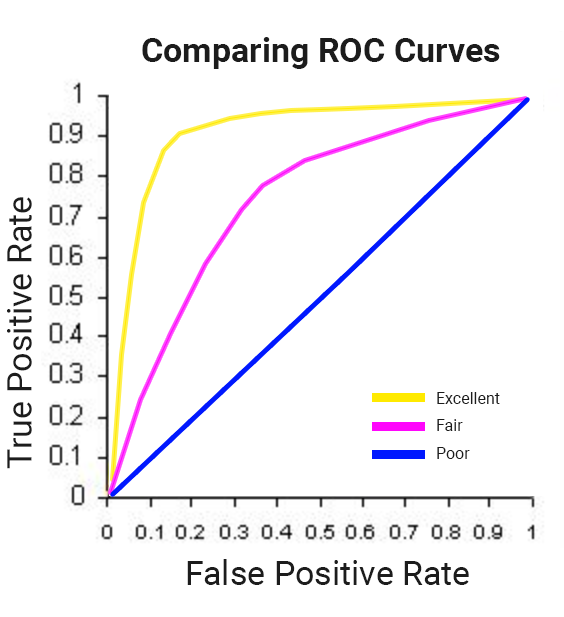
For classification problems in ML, you want to minimize the False Positive Rate (predict that the user will return and purchase and they don't) and maximize the True Positive Rate (predict that the user will return and purchase and they do).
This relationship is visualized with a ROC (Receiver Operating Characteristic) curve like the one shown here, where you try to maximize the area under the curve or AUC:
In BigQuery ML, roc_auc is simply a queryable field when evaluating your trained ML model.
Now that training is complete, you can evaluate how well the model performs by running this query using ML.EVALUATE:
SELECT
roc_auc,
CASE
WHEN roc_auc > .9 THEN 'good'
WHEN roc_auc > .8 THEN 'fair'
WHEN roc_auc > .7 THEN 'not great'
ELSE 'poor' END AS model_quality
FROM
ML.EVALUATE(MODEL ecommerce.classification_model, (
SELECT
* EXCEPT(fullVisitorId)
FROM
# features
(SELECT
fullVisitorId,
IFNULL(totals.bounces, 0) AS bounces,
IFNULL(totals.timeOnSite, 0) AS time_on_site
FROM
`data-to-insights.ecommerce.web_analytics`
WHERE
totals.newVisits = 1
AND date BETWEEN '20170501' AND '20170630') # eval on 2 months
JOIN
(SELECT
fullvisitorid,
IF(COUNTIF(totals.transactions > 0 AND totals.newVisits IS NULL) > 0, 1, 0) AS will_buy_on_return_visit
FROM
`data-to-insights.ecommerce.web_analytics`
GROUP BY fullvisitorid)
USING (fullVisitorId)
));
You should see the following result:
Row
roc_auc
model_quality
1
0.724588
not great
After evaluating your model you get a roc_auc of 0.72, which shows that the model has not great predictive power. Since the goal is to get the area under the curve as close to 1.0 as possible, there is room for improvement.
Task 6. Improve model performance with feature engineering
As was hinted at earlier, there are many more features in the dataset that may help the model better understand the relationship between a visitor's first session and the likelihood that they will purchase on a subsequent visit.
Add some new features and create a second machine learning model called classification_model_2:
How far the visitor got in the checkout process on their first visit
Where the visitor came from (traffic source: organic search, referring site etc.)
Device category (mobile, tablet, desktop)
Geographic information (country)
Create this second model by running the below query:
CREATE OR REPLACE MODEL `ecommerce.classification_model_2`
OPTIONS
(model_type='logistic_reg', labels = ['will_buy_on_return_visit']) AS
WITH all_visitor_stats AS (
SELECT
fullvisitorid,
IF(COUNTIF(totals.transactions > 0 AND totals.newVisits IS NULL) > 0, 1, 0) AS will_buy_on_return_visit
FROM `data-to-insights.ecommerce.web_analytics`
GROUP BY fullvisitorid
)
# add in new features
SELECT * EXCEPT(unique_session_id) FROM (
SELECT
CONCAT(fullvisitorid, CAST(visitId AS STRING)) AS unique_session_id,
# labels
will_buy_on_return_visit,
MAX(CAST(h.eCommerceAction.action_type AS INT64)) AS latest_ecommerce_progress,
# behavior on the site
IFNULL(totals.bounces, 0) AS bounces,
IFNULL(totals.timeOnSite, 0) AS time_on_site,
totals.pageviews,
# where the visitor came from
trafficSource.source,
trafficSource.medium,
channelGrouping,
# mobile or desktop
device.deviceCategory,
# geographic
IFNULL(geoNetwork.country, "") AS country
FROM `data-to-insights.ecommerce.web_analytics`,
UNNEST(hits) AS h
JOIN all_visitor_stats USING(fullvisitorid)
WHERE 1=1
# only predict for new visits
AND totals.newVisits = 1
AND date BETWEEN '20160801' AND '20170430' # train 9 months
GROUP BY
unique_session_id,
will_buy_on_return_visit,
bounces,
time_on_site,
totals.pageviews,
trafficSource.source,
trafficSource.medium,
channelGrouping,
device.deviceCategory,
country
);
Note: You are still training on the same first 9 months of data, even with this new model. It's important to have the same training dataset so you can be certain a better model output is attributable to better input features and not new or different training data.
A key new feature that was added to the training dataset query is the maximum checkout progress each visitor reached in their session, which is recorded in the field hits.eCommerceAction.action_type. If you search for that field in the field definitions you will see the field mapping of 6 = Completed Purchase.
As an aside, the web analytics dataset has nested and repeated fields like ARRAYS which need to be broken apart into separate rows in your dataset. This is accomplished by using the UNNEST() function, which you can see in the above query.
Wait for the new model to finish training (5-10 minutes).
Evaluate this new model to see if there is better predictive power by running the below query:
#standardSQL
SELECT
roc_auc,
CASE
WHEN roc_auc > .9 THEN 'good'
WHEN roc_auc > .8 THEN 'fair'
WHEN roc_auc > .7 THEN 'not great'
ELSE 'poor' END AS model_quality
FROM
ML.EVALUATE(MODEL ecommerce.classification_model_2, (
WITH all_visitor_stats AS (
SELECT
fullvisitorid,
IF(COUNTIF(totals.transactions > 0 AND totals.newVisits IS NULL) > 0, 1, 0) AS will_buy_on_return_visit
FROM `data-to-insights.ecommerce.web_analytics`
GROUP BY fullvisitorid
)
# add in new features
SELECT * EXCEPT(unique_session_id) FROM (
SELECT
CONCAT(fullvisitorid, CAST(visitId AS STRING)) AS unique_session_id,
# labels
will_buy_on_return_visit,
MAX(CAST(h.eCommerceAction.action_type AS INT64)) AS latest_ecommerce_progress,
# behavior on the site
IFNULL(totals.bounces, 0) AS bounces,
IFNULL(totals.timeOnSite, 0) AS time_on_site,
totals.pageviews,
# where the visitor came from
trafficSource.source,
trafficSource.medium,
channelGrouping,
# mobile or desktop
device.deviceCategory,
# geographic
IFNULL(geoNetwork.country, "") AS country
FROM `data-to-insights.ecommerce.web_analytics`,
UNNEST(hits) AS h
JOIN all_visitor_stats USING(fullvisitorid)
WHERE 1=1
# only predict for new visits
AND totals.newVisits = 1
AND date BETWEEN '20170501' AND '20170630' # eval 2 months
GROUP BY
unique_session_id,
will_buy_on_return_visit,
bounces,
time_on_site,
totals.pageviews,
trafficSource.source,
trafficSource.medium,
channelGrouping,
device.deviceCategory,
country
)
));
(Output)
Row
roc_auc
model_quality
1
0.910382
good
With this new model you now get a roc_auc of 0.91 which is significantly better than the first model.
Now that you have a trained model, time to make some predictions.
Task 7. Predict which new visitors will come back and purchase
Next you will write a query to predict which new visitors will come back and make a purchase.
Run the prediction query below which uses the improved classification model to predict the probability that a first-time visitor to the Google Merchandise Store will make a purchase in a later visit:
SELECT
*
FROM
ml.PREDICT(MODEL `ecommerce.classification_model_2`,
(
WITH all_visitor_stats AS (
SELECT
fullvisitorid,
IF(COUNTIF(totals.transactions > 0 AND totals.newVisits IS NULL) > 0, 1, 0) AS will_buy_on_return_visit
FROM `data-to-insights.ecommerce.web_analytics`
GROUP BY fullvisitorid
)
SELECT
CONCAT(fullvisitorid, '-',CAST(visitId AS STRING)) AS unique_session_id,
# labels
will_buy_on_return_visit,
MAX(CAST(h.eCommerceAction.action_type AS INT64)) AS latest_ecommerce_progress,
# behavior on the site
IFNULL(totals.bounces, 0) AS bounces,
IFNULL(totals.timeOnSite, 0) AS time_on_site,
totals.pageviews,
# where the visitor came from
trafficSource.source,
trafficSource.medium,
channelGrouping,
# mobile or desktop
device.deviceCategory,
# geographic
IFNULL(geoNetwork.country, "") AS country
FROM `data-to-insights.ecommerce.web_analytics`,
UNNEST(hits) AS h
JOIN all_visitor_stats USING(fullvisitorid)
WHERE
# only predict for new visits
totals.newVisits = 1
AND date BETWEEN '20170701' AND '20170801' # test 1 month
GROUP BY
unique_session_id,
will_buy_on_return_visit,
bounces,
time_on_site,
totals.pageviews,
trafficSource.source,
trafficSource.medium,
channelGrouping,
device.deviceCategory,
country
)
)
ORDER BY
predicted_will_buy_on_return_visit DESC;
The predictions are made in the last 1 month (out of 12 months) of the dataset.
Your model will now output the predictions it has for those July 2017 ecommerce sessions. You can see three newly added fields:
predicted_will_buy_on_return_visit: whether the model thinks the visitor will buy later (1 = yes)
predicted_will_buy_on_return_visit_probs.label: the binary classifier for yes / no
predicted_will_buy_on_return_visit_probs.prob: the confidence the model has in it's prediction (1 = 100%)
Results
Of the top 6% of first-time visitors (sorted in decreasing order of predicted probability), more than 6% make a purchase in a later visit.
These users represent nearly 50% of all first-time visitors who make a purchase in a later visit.
Overall, only 0.7% of first-time visitors make a purchase in a later visit.
Targeting the top 6% of first-time increases marketing ROI by 9x vs targeting them all!
Additional information
roc_auc is just one of the performance metrics available during model evaluation. Also available are accuracy, precision, and recall. Knowing which performance metric to rely on is highly dependent on what your overall objective or goal is.
Congratulations!
You created a machine learning model using just SQL.
Challenge
Summary
In the previous two tasks you saw the power of feature engineering at work in improving our models performance. However, we still may be able to improve our performance by exploring other model types. For classification problems, BigQuery ML also supports the following model types:
Though our linear classification (logistic regression) model performed well after feature engineering, it may be too simple of a model to fully capture the relationship between the features and the label. Using the same dataset and labels as you did in Task 6 to create the model ecommerce.classification_model_2, your challenge is to create a XGBoost Classifier.
Note: Hint : Use following options for Boosted_Tree_Classifier:
1. L2_reg = 0.1
2. num_parallel_tree = 8
3. max_tree_depth = 10
You may need to look at the documentation linked above to see the exact syntax. The model will take around 7 minutes to train. The solution can be found in the solution section below if you need help writing the query.
pa
Solution:
This is the solution that you require in order to create a XGBoost Classifier:
CREATE OR REPLACE MODEL `ecommerce.classification_model_3`
OPTIONS
(model_type='BOOSTED_TREE_CLASSIFIER' , l2_reg = 0.1, num_parallel_tree = 8, max_tree_depth = 10,
labels = ['will_buy_on_return_visit']) AS
WITH all_visitor_stats AS (
SELECT
fullvisitorid,
IF(COUNTIF(totals.transactions > 0 AND totals.newVisits IS NULL) > 0, 1, 0) AS will_buy_on_return_visit
FROM `data-to-insights.ecommerce.web_analytics`
GROUP BY fullvisitorid
)
# add in new features
SELECT * EXCEPT(unique_session_id) FROM (
SELECT
CONCAT(fullvisitorid, CAST(visitId AS STRING)) AS unique_session_id,
# labels
will_buy_on_return_visit,
MAX(CAST(h.eCommerceAction.action_type AS INT64)) AS latest_ecommerce_progress,
# behavior on the site
IFNULL(totals.bounces, 0) AS bounces,
IFNULL(totals.timeOnSite, 0) AS time_on_site,
totals.pageviews,
# where the visitor came from
trafficSource.source,
trafficSource.medium,
channelGrouping,
# mobile or desktop
device.deviceCategory,
# geographic
IFNULL(geoNetwork.country, "") AS country
FROM `data-to-insights.ecommerce.web_analytics`,
UNNEST(hits) AS h
JOIN all_visitor_stats USING(fullvisitorid)
WHERE 1=1
# only predict for new visits
AND totals.newVisits = 1
AND date BETWEEN '20160801' AND '20170430' # train 9 months
GROUP BY
unique_session_id,
will_buy_on_return_visit,
bounces,
time_on_site,
totals.pageviews,
trafficSource.source,
trafficSource.medium,
channelGrouping,
device.deviceCategory,
country
);
Let us now evaluate our model and see how we did:
#standardSQL
SELECT
roc_auc,
CASE
WHEN roc_auc > .9 THEN 'good'
WHEN roc_auc > .8 THEN 'fair'
WHEN roc_auc > .7 THEN 'not great'
ELSE 'poor' END AS model_quality
FROM
ML.EVALUATE(MODEL ecommerce.classification_model_3, (
WITH all_visitor_stats AS (
SELECT
fullvisitorid,
IF(COUNTIF(totals.transactions > 0 AND totals.newVisits IS NULL) > 0, 1, 0) AS will_buy_on_return_visit
FROM `data-to-insights.ecommerce.web_analytics`
GROUP BY fullvisitorid
)
# add in new features
SELECT * EXCEPT(unique_session_id) FROM (
SELECT
CONCAT(fullvisitorid, CAST(visitId AS STRING)) AS unique_session_id,
# labels
will_buy_on_return_visit,
MAX(CAST(h.eCommerceAction.action_type AS INT64)) AS latest_ecommerce_progress,
# behavior on the site
IFNULL(totals.bounces, 0) AS bounces,
IFNULL(totals.timeOnSite, 0) AS time_on_site,
totals.pageviews,
# where the visitor came from
trafficSource.source,
trafficSource.medium,
channelGrouping,
# mobile or desktop
device.deviceCategory,
# geographic
IFNULL(geoNetwork.country, "") AS country
FROM `data-to-insights.ecommerce.web_analytics`,
UNNEST(hits) AS h
JOIN all_visitor_stats USING(fullvisitorid)
WHERE 1=1
# only predict for new visits
AND totals.newVisits = 1
AND date BETWEEN '20170501' AND '20170630' # eval 2 months
GROUP BY
unique_session_id,
will_buy_on_return_visit,
bounces,
time_on_site,
totals.pageviews,
trafficSource.source,
trafficSource.medium,
channelGrouping,
device.deviceCategory,
country
)
));
Our roc_auc has increased by about .02 to around .94!
Note : Your exact values will differ due to the randomness involved in the training process.
It’s a small change in the roc_auc, but note that since 1 is a perfect roc_auc, it gets more difficult to improve the metric the closer to 1 it gets.
This is a great example of how easy it is in BigQuery ML to try out different model types with different options to see how they perform. We were able to use a much more complex model type by only changing one line of SQL.
One may reasonably ask “Where did the choices for these options come from?”, and the answer is experimentation! When you are trying to find the best model type for your problems, then one has to experiment with different sets of options in a process known as hyperparameter tuning.
Let’s finish up by generating predictions with our improved model and see how they compare to those we generated before. By using a Boosted tree classifier model, you can observe a slight improvement of 0.2 in our ROC AUC compared to the previous model. The query below will predict which new visitors will come back and make a purchase:
SELECT
*
FROM
ml.PREDICT(MODEL `ecommerce.classification_model_3`,
(
WITH all_visitor_stats AS (
SELECT
fullvisitorid,
IF(COUNTIF(totals.transactions > 0 AND totals.newVisits IS NULL) > 0, 1, 0) AS will_buy_on_return_visit
FROM `data-to-insights.ecommerce.web_analytics`
GROUP BY fullvisitorid
)
SELECT
CONCAT(fullvisitorid, '-',CAST(visitId AS STRING)) AS unique_session_id,
# labels
will_buy_on_return_visit,
MAX(CAST(h.eCommerceAction.action_type AS INT64)) AS latest_ecommerce_progress,
# behavior on the site
IFNULL(totals.bounces, 0) AS bounces,
IFNULL(totals.timeOnSite, 0) AS time_on_site,
totals.pageviews,
# where the visitor came from
trafficSource.source,
trafficSource.medium,
channelGrouping,
# mobile or desktop
device.deviceCategory,
# geographic
IFNULL(geoNetwork.country, "") AS country
FROM `data-to-insights.ecommerce.web_analytics`,
UNNEST(hits) AS h
JOIN all_visitor_stats USING(fullvisitorid)
WHERE
# only predict for new visits
totals.newVisits = 1
AND date BETWEEN '20170701' AND '20170801' # test 1 month
GROUP BY
unique_session_id,
will_buy_on_return_visit,
bounces,
time_on_site,
totals.pageviews,
trafficSource.source,
trafficSource.medium,
channelGrouping,
device.deviceCategory,
country
)
)
ORDER BY
predicted_will_buy_on_return_visit DESC;
The output now shows a classification model that can better predict the probability that a first-time visitor to the Google Merchandise Store will make a purchase in a later visit.
By comparing the result above with the previous model shown in Task 7, you can see the confidence the model has in its predictions is more accurate when compared to the logistic_regression model type.
End your lab
When you have completed your lab, click End Lab. Google Cloud Skills Boost removes the resources you’ve used and cleans the account for you.
You will be given an opportunity to rate the lab experience. Select the applicable number of stars, type a comment, and then click Submit.
The number of stars indicates the following:
1 star = Very dissatisfied
2 stars = Dissatisfied
3 stars = Neutral
4 stars = Satisfied
5 stars = Very satisfied
You can close the dialog box if you don't want to provide feedback.
For feedback, suggestions, or corrections, please use the Support tab.
Copyright 2022 Google LLC All rights reserved. Google and the Google logo are trademarks of Google LLC. All other company and product names may be trademarks of the respective companies with which they are associated.
Labs create a Google Cloud project and resources for a fixed time
Labs have a time limit and no pause feature. If you end the lab, you'll have to restart from the beginning.
On the top left of your screen, click Start lab to begin
Use private browsing
Copy the provided Username and Password for the lab
Click Open console in private mode
Sign in to the Console
Sign in using your lab credentials. Using other credentials might cause errors or incur charges.
Accept the terms, and skip the recovery resource page
Don't click End lab unless you've finished the lab or want to restart it, as it will clear your work and remove the project
This content is not currently available
We will notify you via email when it becomes available
Great!
We will contact you via email if it becomes available
One lab at a time
Confirm to end all existing labs and start this one
Use private browsing to run the lab
Use an Incognito or private browser window to run this lab. This
prevents any conflicts between your personal account and the Student
account, which may cause extra charges incurred to your personal account.
Want to build ML models with just SQL? Learn how with BigQuery ML on this Google Analytics ecommerce dataset