

Before you begin
- Labs create a Google Cloud project and resources for a fixed time
- Labs have a time limit and no pause feature. If you end the lab, you'll have to restart from the beginning.
- On the top left of your screen, click Start lab to begin
Customize native derived tables using derived columns
/ 50
Customize native derived tables using filters
/ 50
Looker is a modern data platform in Google Cloud that lets you analyze and visualize your data interactively. You can use Looker to do in-depth data analysis, integrate insights across different data sources, build actionable data-driven workflows, and create custom data applications.
In this lab, you will learn how to leverage native derived tables to answer complex questions, address advanced use cases, and customize them using built-in parameters.
You will learn how to:
To maximize your learning, familiarity with LookML is necessary and completing the Understanding LookML in Looker skill badge course is recommended before beginning this lab.
Read these instructions. Labs are timed and you cannot pause them. The timer, which starts when you click Start Lab, shows how long Google Cloud resources are made available to you.
This hands-on lab lets you do the lab activities yourself in a real cloud environment, not in a simulation or demo environment. It does so by giving you new, temporary credentials that you use to sign in and access Google Cloud for the duration of the lab.
To complete this lab, you need:
When ready, click Start Lab.
The Lab Details pane appears with the temporary credentials that you must use for this lab.
If you need to pay for the lab, a pop-up opens for you to select your payment method.
Notice your lab credentials in the Lab details pane. You use them to sign in to the Looker instance for this lab.
Click Open Looker.
Enter the provided Username and Password in the Email and Password fields.
Username:
Password:
Click Log In.
After a successful login, you see the Looker instance for this lab.
Native derived tables are derived tables that perform the same function as a written SQL query, but are expressed natively in the LookML language.
Why should you use native derived tables? Think about the user_facts SQL derived table you made in the previous lab. You did a COUNT of order IDs as lifetime_order_count, and a SUM of sale_price as lifetime_revenue. If you didn't already notice, these aggregations already exist in your model as measures! Your order_items view already has an order_count and a total_sales.
Native derived tables are great because they embody the core LookML principle of reusability. They allow you to inherit already existing dimensions, measures and even Explores and join logic. This makes your model much more maintainable in the long run, since you’re minimizing the number of “hard-coded” database references.
In this section, you will create a native derived table named brand_order_facts that contains a derived column to rank brands by total revenue and that can be filtered using a dynamic date range and/or user inputs. You will also create new dimensions that label rows as being in the top 5 brands or not (i.e. lump all brands ranked 6+ as one brand name of “6) Other”).
First, on the bottom left of the Looker User Interface, click the toggle button to enter Development mode.
On the Looker navigation menu, click Explore.
Under E-Commerce Training, click Order Items.
Under the Inventory Items view, click the Product Brand dimension.
Under the Order Items view, click the Total Revenue measure.
Click Run.
Click on the settings gear icon (
Tab over to Derived Table, click on the LookML code in the box, and copy it to your clipboard.
Navigate to the Looker IDE (Develop > qwiklabs-ecommerce), click on the plus (+) icon next to File Browser, and choose Create View.
Name the new view brand_order_facts and click Create.
Click brand_order_facts.view and drag it under the views folder.
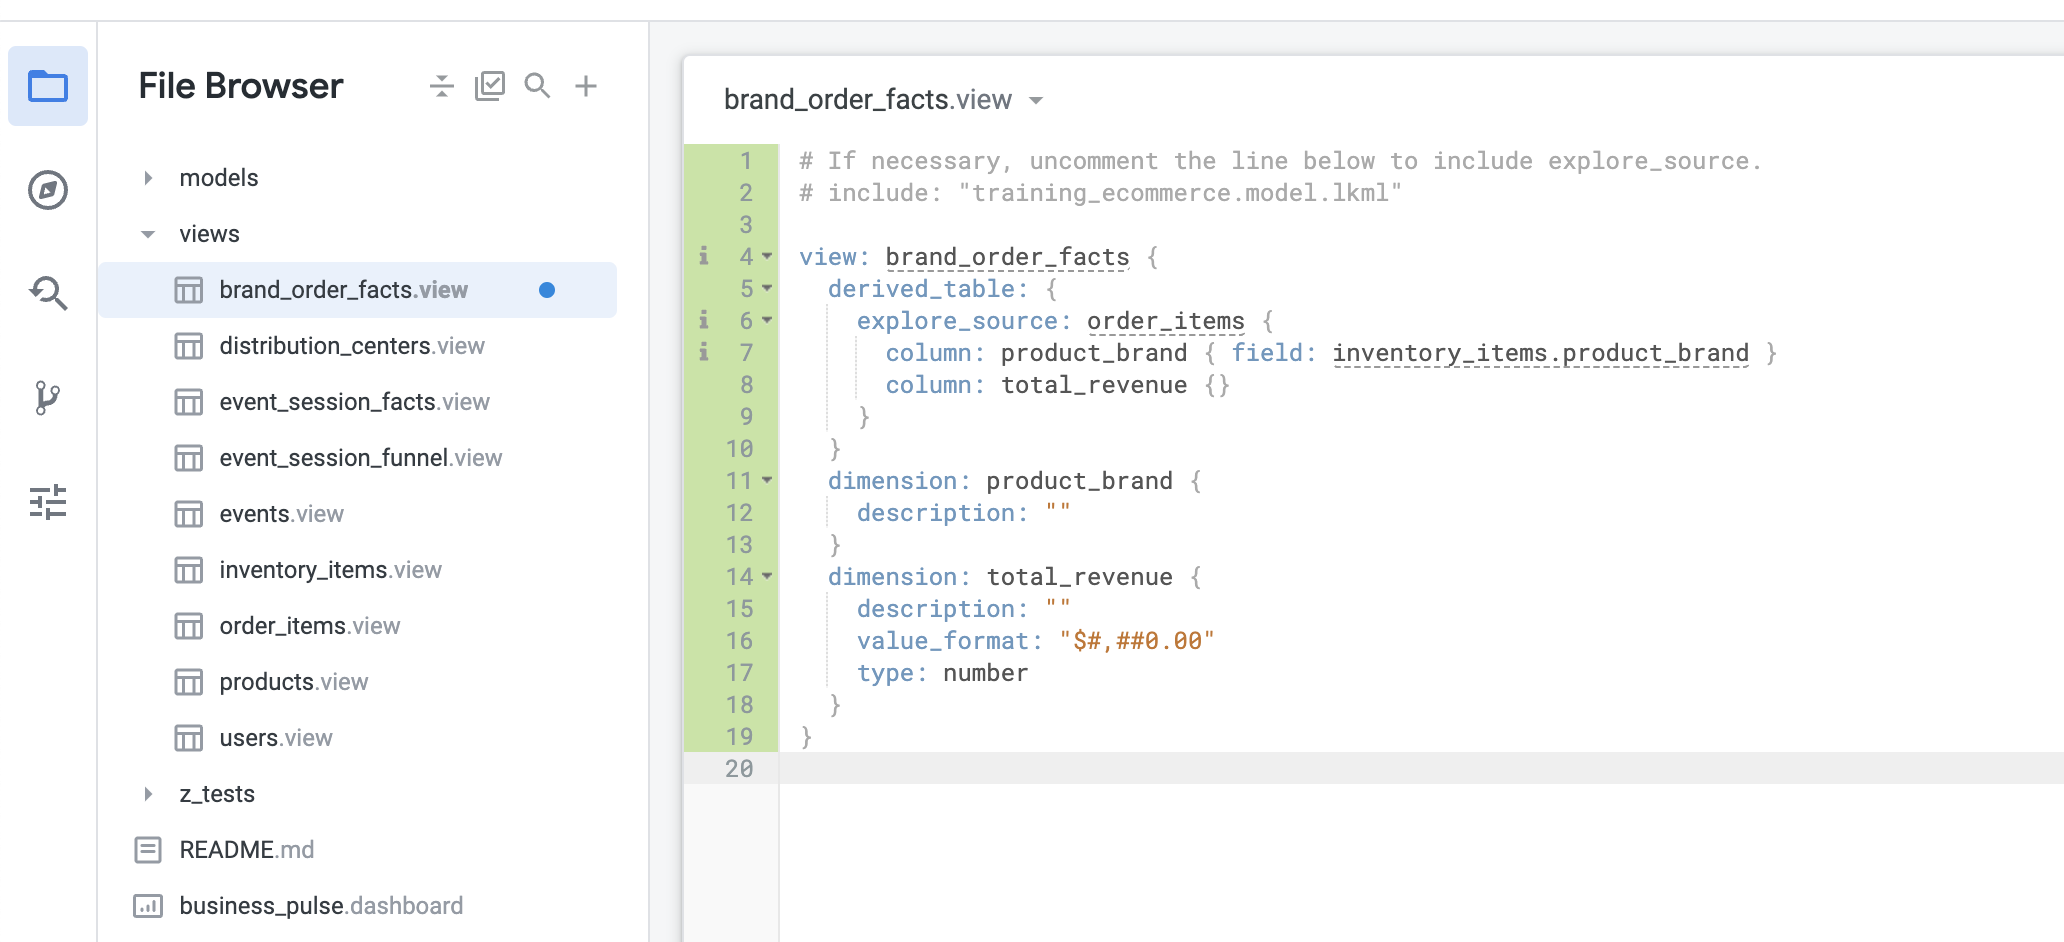
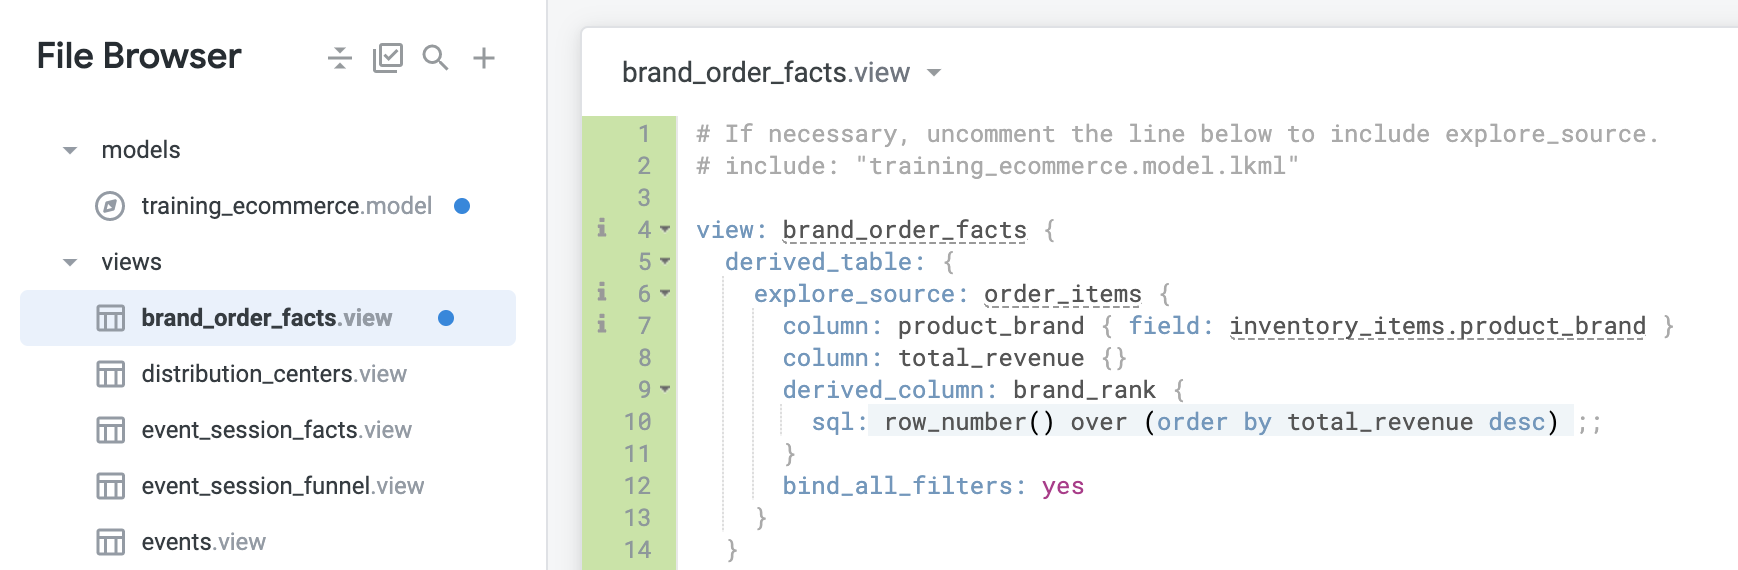
Erase all the sample auto-generated code, and paste in the copied code from the Explore. Don’t forget to fix the auto-generated view name to brand_order_facts. Your view should resemble:
So now you have the foundation for your native derived table. The next task is to rank the brands, this can be achieved in most SQL dialects through what is called a ROW_NUMBER() function.
To accomplish this, you'll need to add a derived_column to your native derived tables' explore_source. In a native derived table, you can use derived_column to specify a column that does not yet exist in the Explore specified by the explore_source parameter. For this example, you will call it brand_rank.
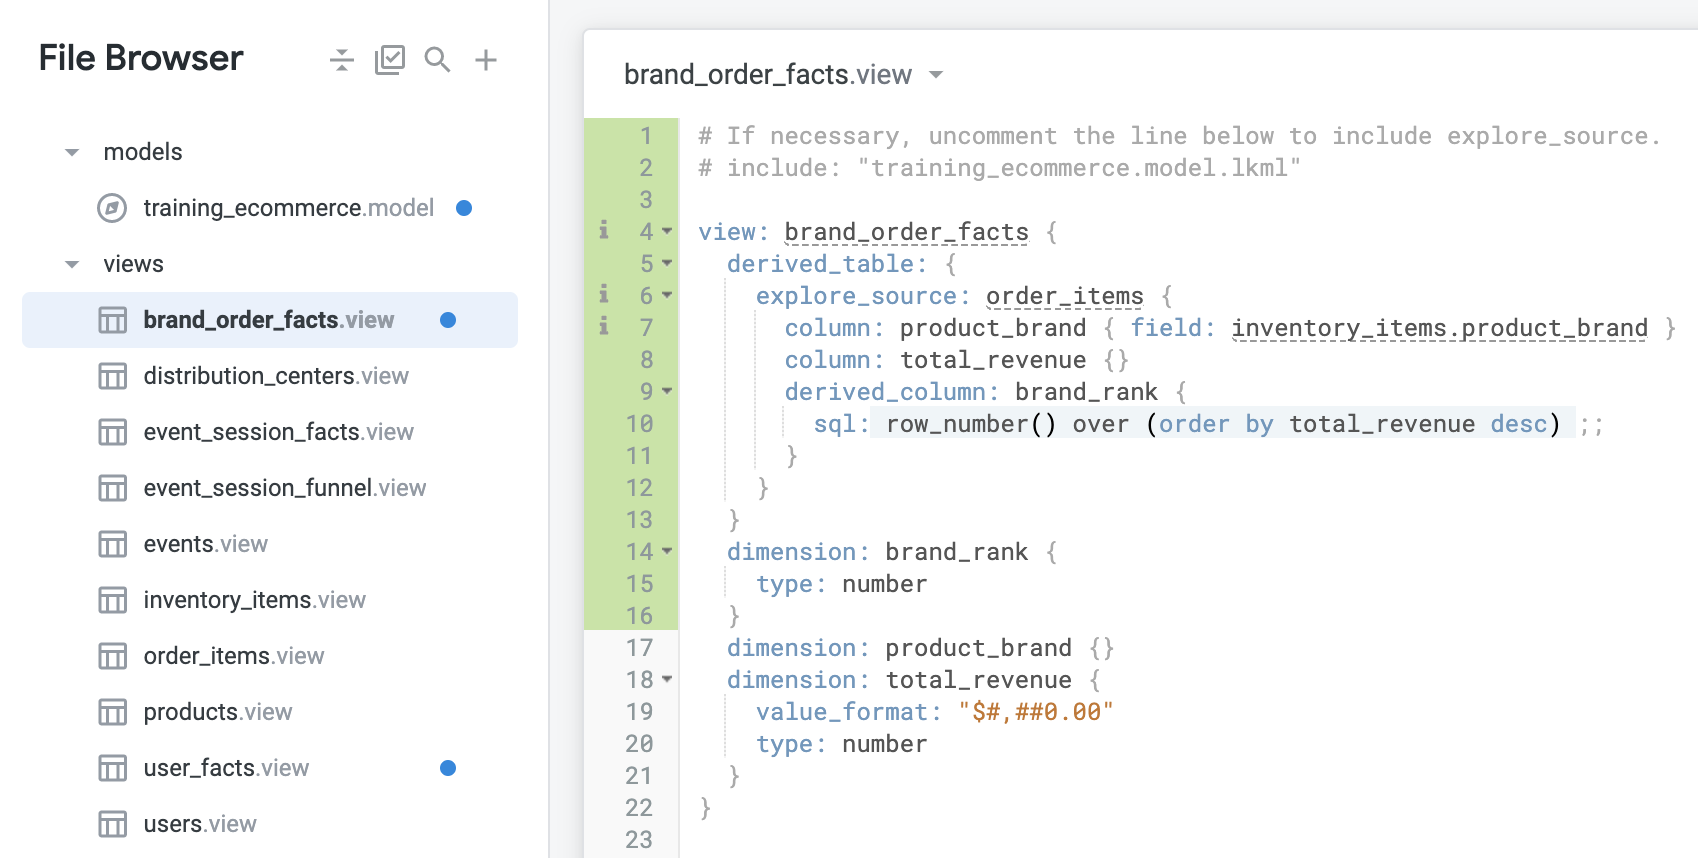
column: total_revenue {} definition, start by defining the brand_rank derived column:Whenever you make a derived column, you also need to add a dimension for it. It is the same as when you have a column in your regular database table; the column needs to be represented in LookML as a dimension. Have you noticed the auto-generated dimensions don’t have a sql parameter? That is because, when you don’t specify the sql for a dimension, Looker assumes it should point to a column in the underlying data with exactly the same name as the dimension. That can be a useful shortcut for other areas of your project if you’d like, although generally it is a better practice to be explicit whenever possible. In this case, you should at least specify the type. If you don’t, Looker defaults to string, which you do not want here.
product_brand dimension, add the following code:Your new view should now resemble the following:
Click Save Changes.
Then, from the same page, click on the training_ecommerce.model file inside of the model folder to modify its contents.
Locate the explore: order_items definition.
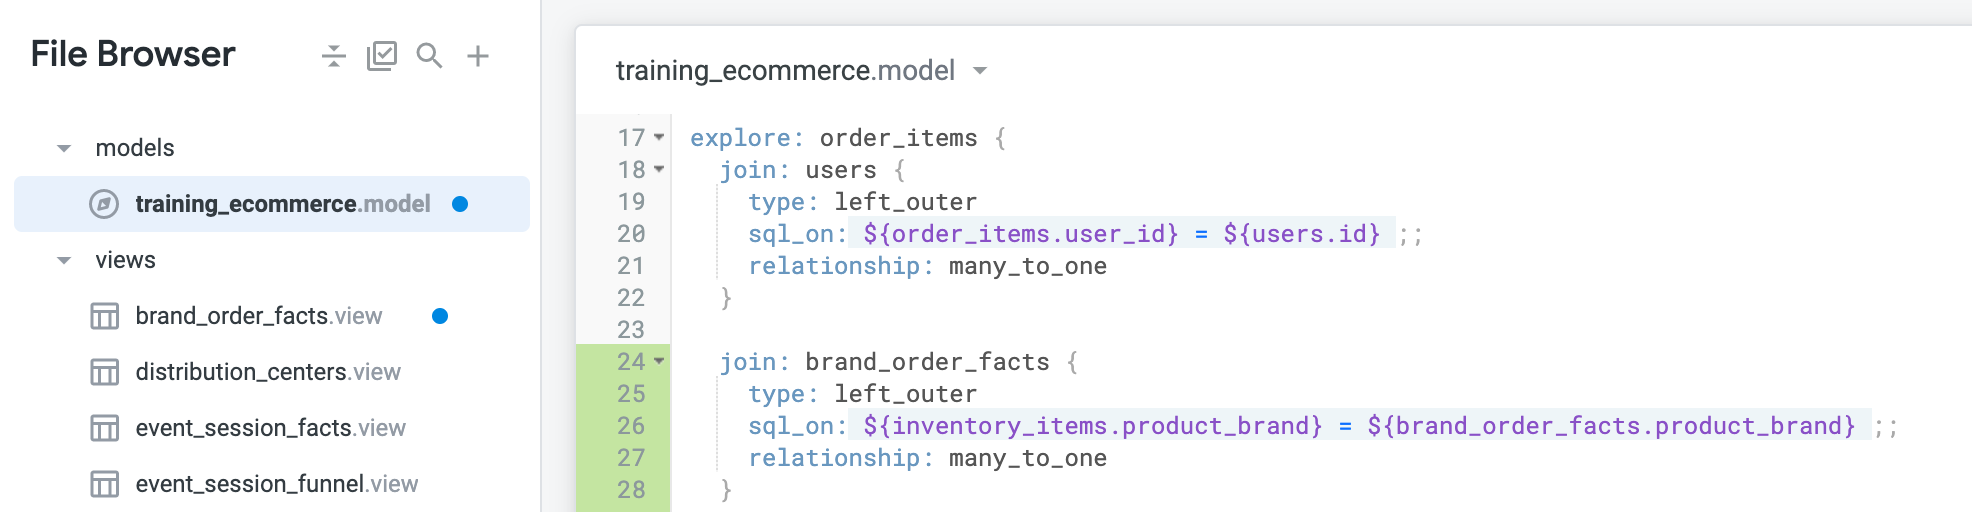
In the explore: order_items definition, add a new join for brand_order_facts by specifying:
Click Save Changes.
Your model file should now resemble the following:
Now that you've joined the brand_order_facts view to the Explore, navigate to the Explore page for Order Items.
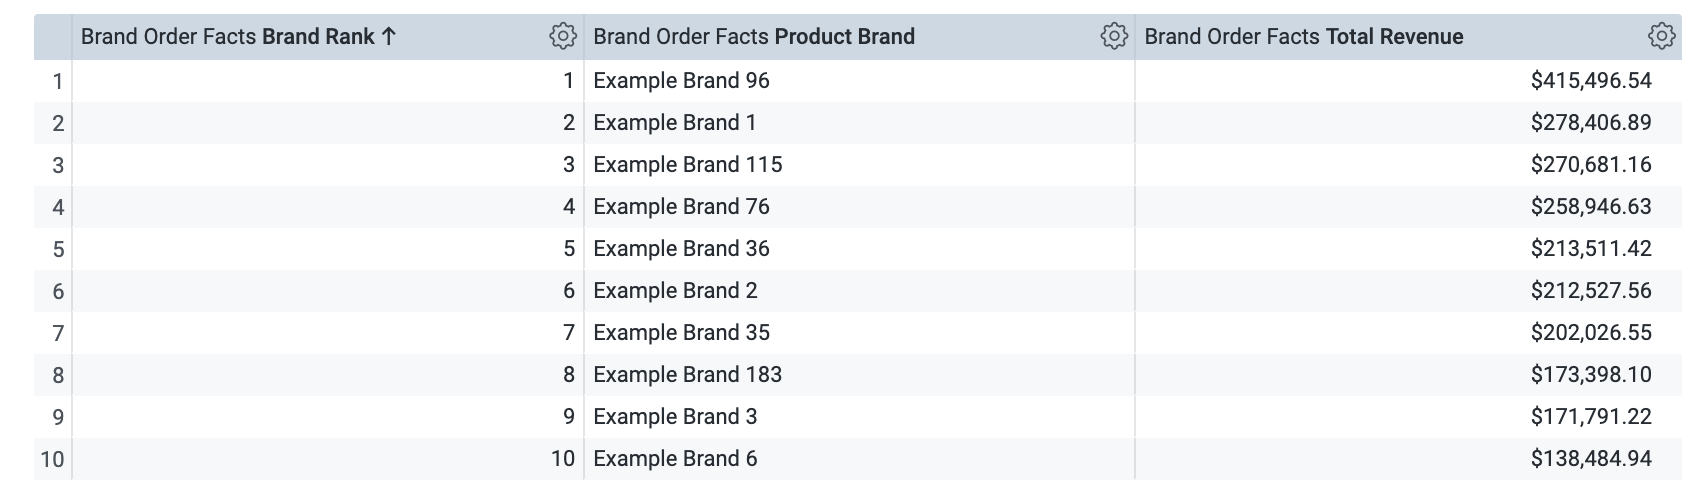
Under the Brand Order Facts view, select the Brand Rank, Product Brand, and Total Revenue dimensions.
Set the Row Limit to 10.
Click Run. Your result should look like the following:
So far so good! But what if your business users want to see the brand names displayed like "1) Example Brand", and not just "Example Brand" alone. How would this be accomplished? In this case, you could create a dimension that concatenates two other dimension values.
Navigate back to the brand_order_facts view.
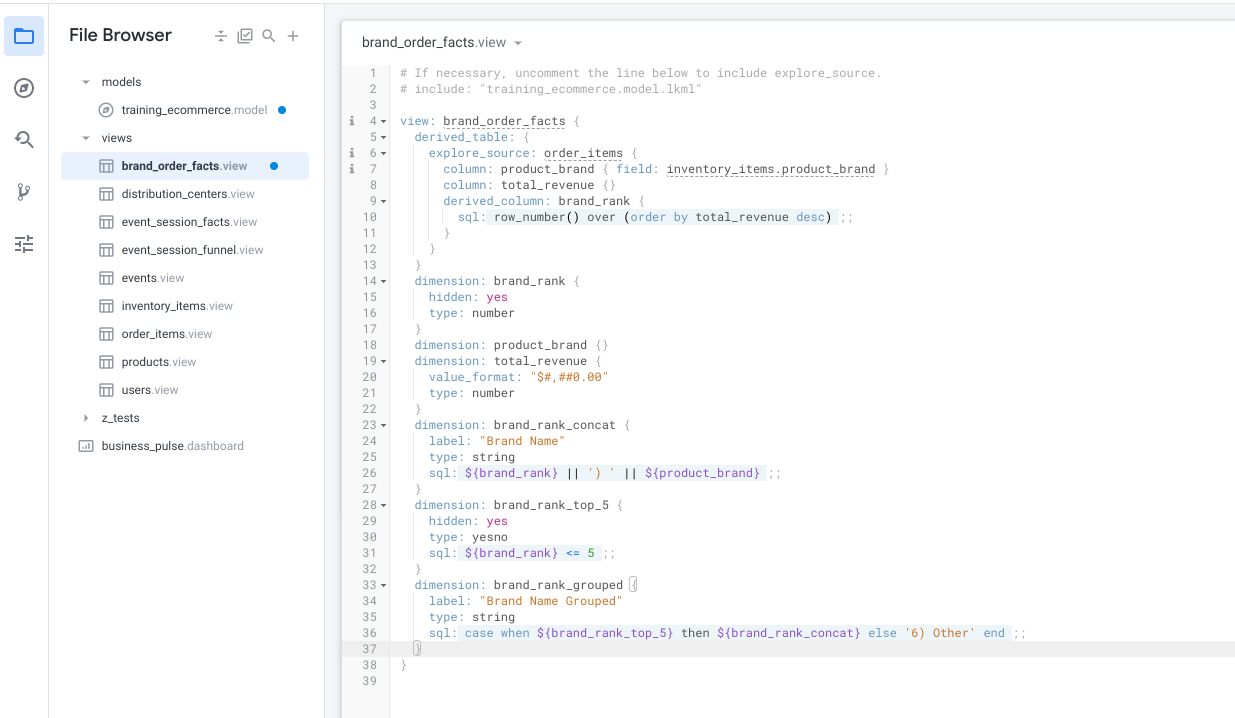
Make another dimension called brand_rank_concat, which concatenates the brand rank and the product brand:
brand_rank since business users would probably just find the rank number in our new brand_rank_concat, and not want to use a separate field:brand_rank_concat so it appears more user-friendly. Use the label “Brand Name”:For the final step, you'll need to lump all brands at rank 6 and beyond into an “Other” classification. To do this, you will first make a “stepping-stone” dimension that evaluates whether a brand’s rank is in the top 5 or not.
brand_rank_top_5 with the following parameters:brand_rank_grouped and incorporate the brand_rank_top_5 into it with the following code:Your view should now resemble the following:
Navigate back to the Explore page for Order Items.
Under the Brand Order Facts view, select the Brand Name Grouped dimension.
Under the Order Items view, select the Total Revenue measure. Set the Row Limit to 10.
Click Run.
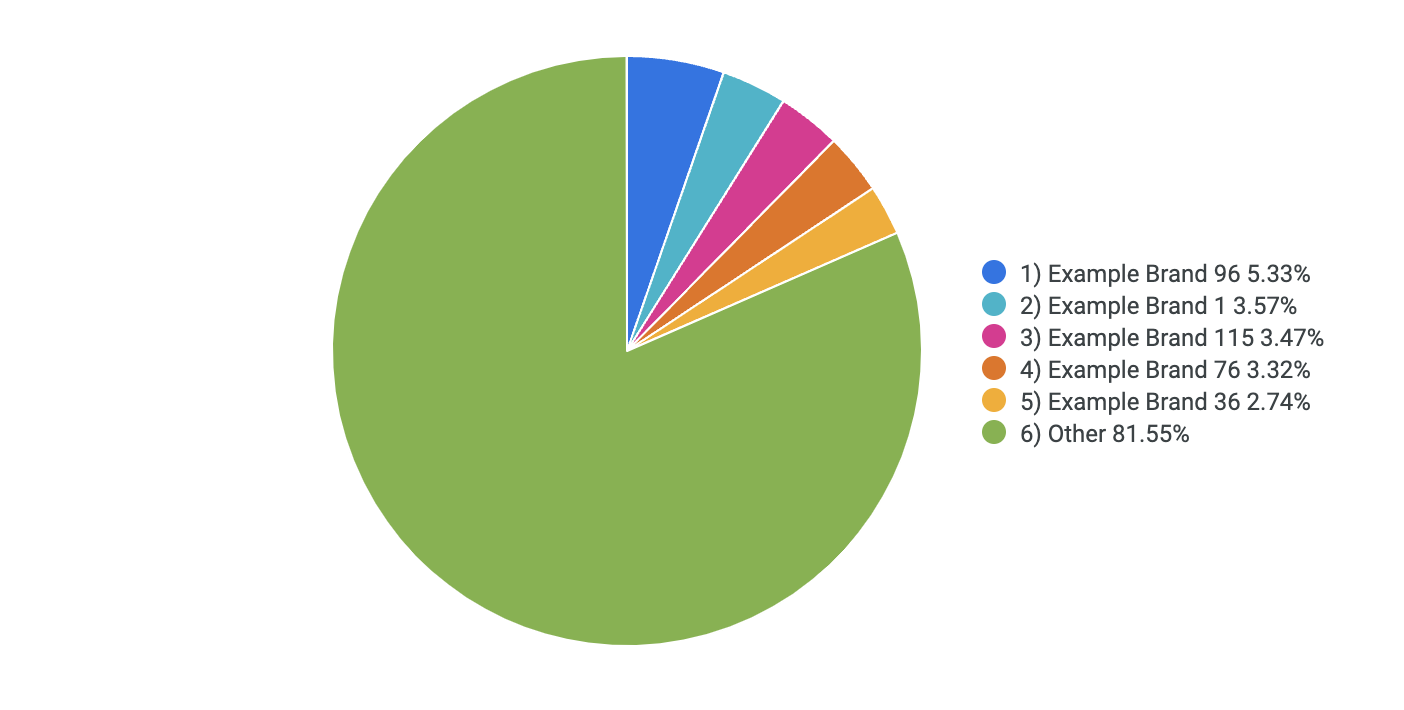
Make sure the Brand Name Grouped column is ordered from first to last, then under the Visualization tab, click Pie Chart.
Verify your visualization resembles the following:
Click on the settings gear icon (
Title your Look: Ranked Brand Revenue.
Click Save.
Navigate back to the brand_order_facts view.
Click Validate LookML and then click Commit Changes & Push.
Add a commit message and click Commit.
Lastly, click Deploy to Production.
Great! Hopefully this helps you appreciate how useful it can be to break down a use case or desired logic into separate basic dimensions, that you can then combine or build upon to answer specific business questions. It is very common in best-practice LookML development to have lots of hidden “stepping-stone” dimensions and measures like these.
Click Check my progress to verify that you've performed the above task.
Now, say the business only cares about recent orders made in the past 365 days. Maybe some of these top 5 brands were very popular years ago due to different trends, but the rankings could have shifted in the past one year.
In this section, you will explore the different types of filters to use for your native derived table in LookML. Filters can be used to apply filters to the derived table, similar to a filtered measure. It adds a WHERE or HAVING clause.
First, navigate back to the brand_order_facts view.
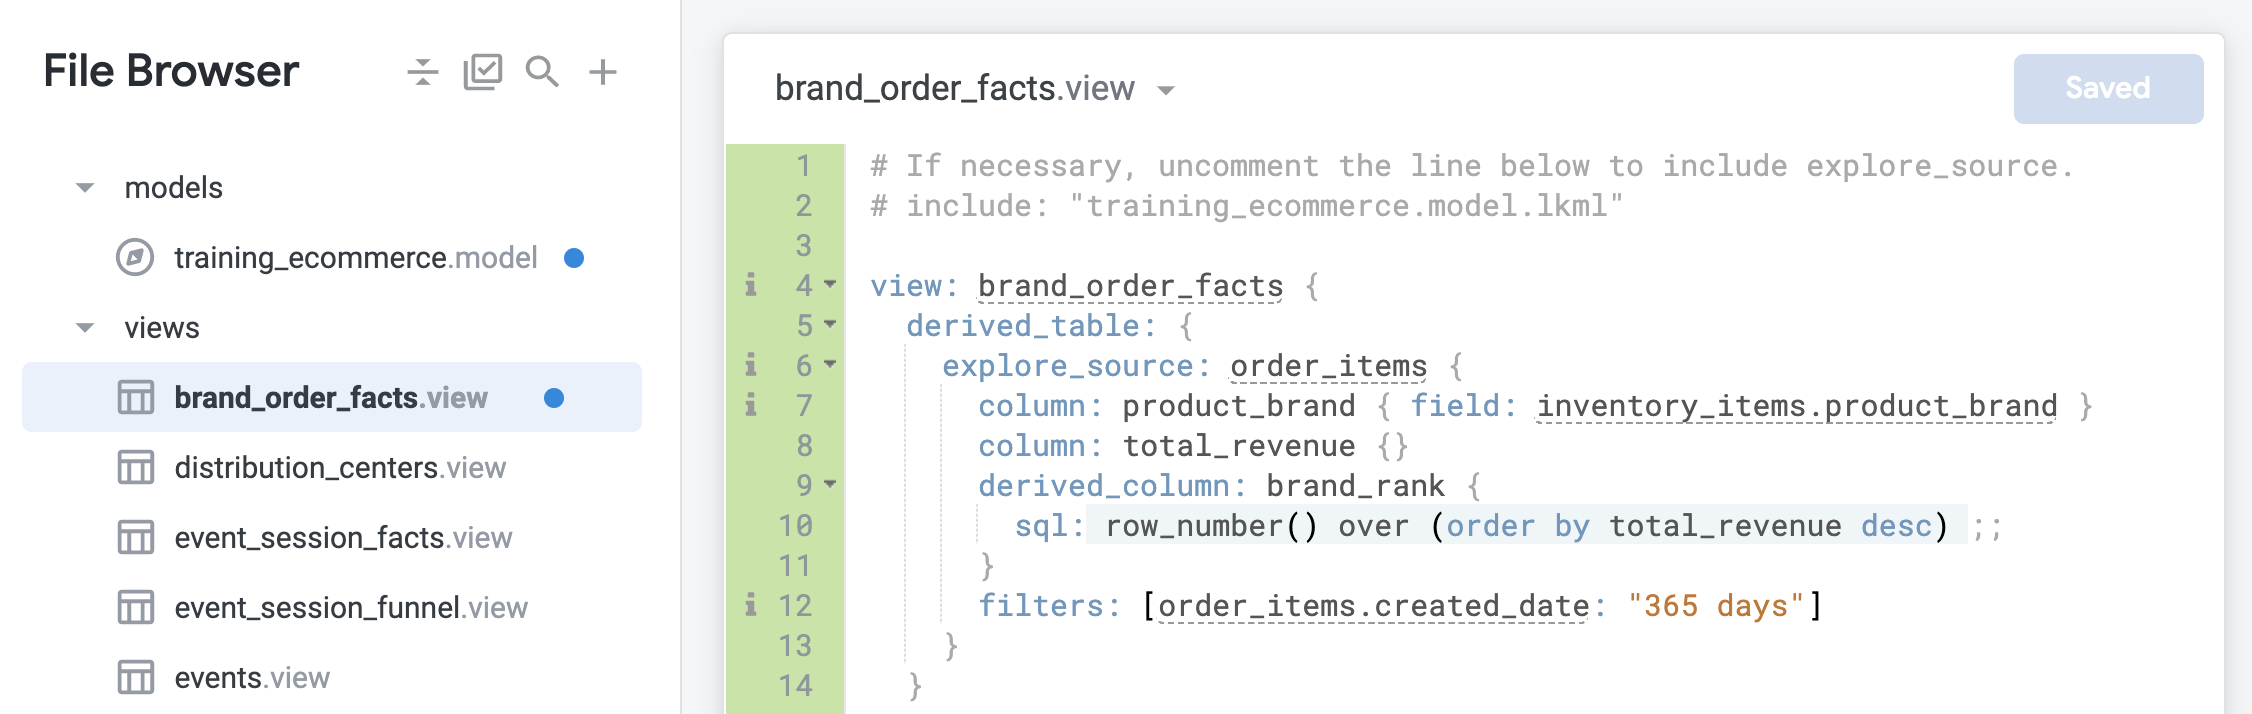
Under the derived_column definition, add a filter to restrict the native derived table to orders created in the past 365 days:
Navigate back to the Order Items Explore.
Under the Brand Order Facts view, select the Brand Name Grouped.
Under the Order Items view, select the Total Revenue measure.
Click Run.
On the Data bar, click the SQL tab to see how the filter gets used in the query.
Since you added a filter on the Ordered Items Created Date to look at only the orders made in the past 365 days, the WHERE condition is only generated in what is called the outer query. This is the default behavior for any dimension filter; you can’t tell it to go inside the common table expression for the derived table, or make the outer WHERE “trickle down” to the inner query. This is where adding a filter to the NDT itself comes in handy.
What if the business finds it too rigid to restrict the data to only orders from the past 365 days? Maybe sometimes users want to analyze the rankings from the past two years. With filters: [order_items.created_date: "365 days"], you are hard-coding the time frame.
This is where bind_filters can be a more useful parameter than simply filters. You can indicate which field from the outer Explore you want to “trickle down” to the inner query of the native derived table (the from_field) and which native derived table field it should map to (the to_field). The vast majority of the time, these two should be the same.
The bind_filters sub-parameter of explore_source passes a specific filter from the Explore query into the native derived table subquery:
to_field is the field in the native derived table to which the filter is applied. The to_field must be a field from the underlying explore_source.from_field specifies the field in the Explore from which to get the filter, if the user specifies a filter at runtime.Navigate back to the brand_order_facts view.
To use the bind filter, start by removing the static date filter inside of the derived table definition you created in the previous section.
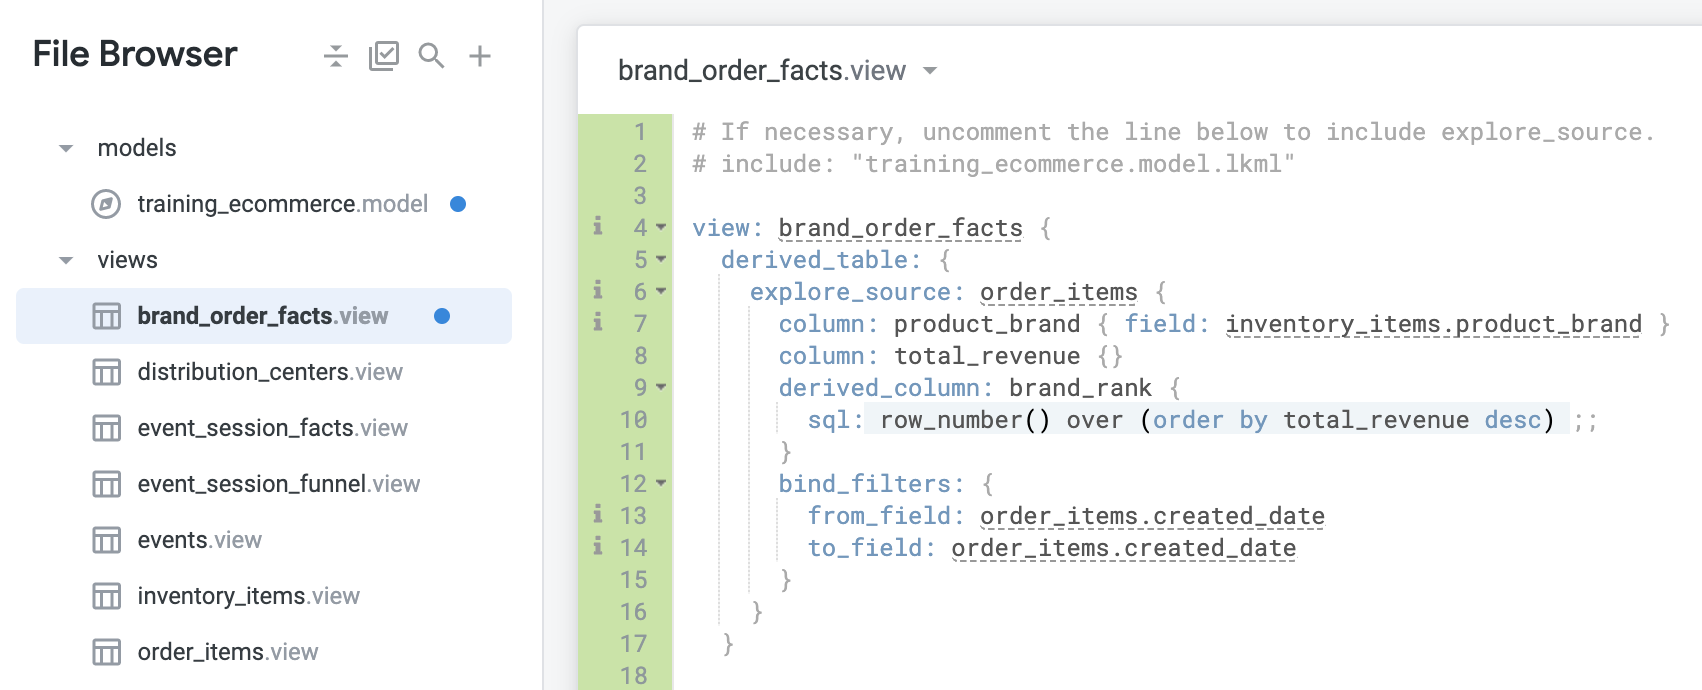
Next, add the following template of the bind_filters under the derived_column definition:
In this case, you will want to grab the filter from_field: order_items.created_date and make it influence or apply to_field: order_items.created_date.
Navigate back to the Order Items Explore.
Under the Brand Order Facts view, select the Brand Name Grouped.
Under the Order Items view, select the Total Revenue measure.
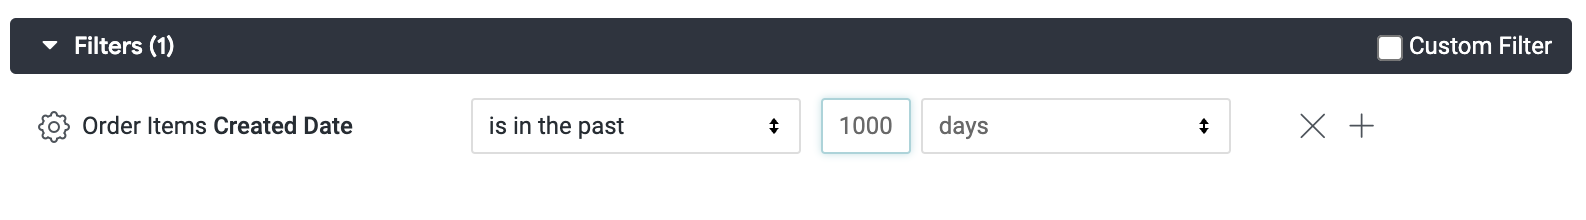
Also under the Order Items view, Created Date dimension, select the Date field and then select the filter button next to Date.
In the filter definition, specify the filter to be: is in the past 1000 days. For demonstration purposes, you are using 1000 days to ensure that the filter is not too restrictive, and that it will capture the past 3 years.
Click Run.
As you can see, this is a lot more flexible! If you filter by orders created in the past 3 quarters, the native derived table will calculate the rankings from the past 3 quarters accordingly. And if you filter by orders created in a particular date range, the native derived table will also use that same date range in its WHERE condition.
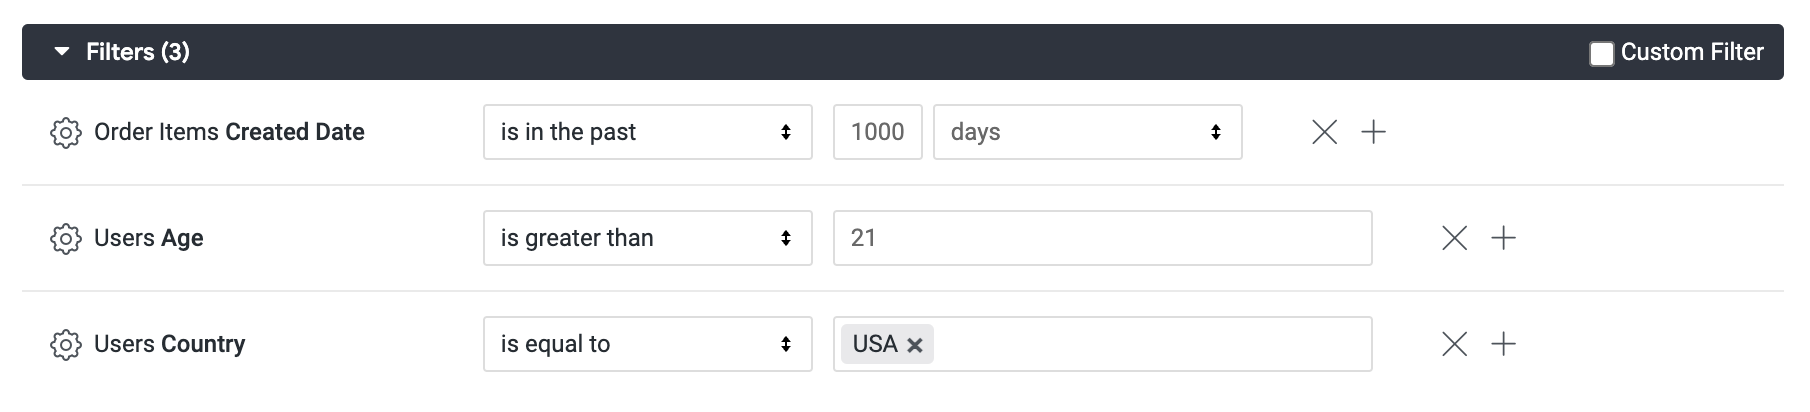
Now, under the Users field, select Country and Age and add a filter for them; set them to Country is equal to USA and Age is greater than 21.
Click Run.
Notice how the WHERE condition of the derived table is unaffected. What if the business users have other criteria besides Ordered Items Created Date? What if they only want to see the rankings for orders made by customers in the USA, or by male customers?
You could certainly keep adding bind_filters, but look how many fields you have in the Order Items Explore. It would take forever to add bind_filters for all of them. This is where yet another parameter can be extremely useful: bind_all_filters.
Click Check my progress to verify that you've performed the above task.
The easiest way to pass filters from an Explore to a native derived table subquery is to specify bind_all_filters: yes in the native derived table’s explore_source parameter. This will pass all of an Explore’s runtime filters into the native derived table subquery.
If you want to use the native derived table in a different Explore, use the bind_filters parameter instead, as described in the previous section.
Start by removing the bind_filter inside of the derived table definition you created in the previous section.
Add the bind_all_filters: yes definition under the derived_column definition to not only bind the order_created_date to itself, but every filter to itself:
Navigate back to the Order Items Explore.
Under the Brand Order Facts view, select the Brand Name Grouped.
Under the Order Items view, select the Total Revenue measure.
Also under the Order Items view, find the Created Date dimension, and click the filter button next to Date.
In the filter definition, specify the filter to be: is in the past 365 days.
Under the Users view, add a filter on the Country and Age; set them to Country is equal to USA and Age is greater than 21.
Click Run.
Click the SQL tab. Notice how the WHERE condition of the derived table now dynamically updates!
Although bind_all_filters is great, it only works when you have joined the native derived table to its explore_source. In other words, you are only able to use this here because you joined brand_order_facts back to the same Explore as the explore_source, order_items.
Why? Because bind_all_filters means Looker needs to know how to generate a WHERE condition for any field in the whole Explore. If your native derived table is using an explore_source of order_items but you join it to a different Explore, that other Explore could have any number of joined views and fields that don’t exist in order_items, and therefore wouldn’t make any sense in the world of order_items. Looker would not know how to filter the derived table with those other fields.
Now that you have seen the bind_all_filters in action, play around with a couple of different Explore filters and see how they affect the way the native derived table compiles.
Click Validate LookML and then click Commit Changes & Push.
Add a commit message and click Commit.
Lastly, click Deploy to Production.
In this lab, you used native derived tables to answer complex questions and address advanced use cases using derived columns, and updated them to generate dynamic values using built-in filter parameters. You also learned how business users leverage customized native derived tables to answer complex questions.
...helps you make the most of Google Cloud technologies. Our classes include technical skills and best practices to help you get up to speed quickly and continue your learning journey. We offer fundamental to advanced level training, with on-demand, live, and virtual options to suit your busy schedule. Certifications help you validate and prove your skill and expertise in Google Cloud technologies.
Manual Last Updated March 4, 2024
Lab Last Tested March 4, 2024
Copyright 2025 Google LLC. All rights reserved. Google and the Google logo are trademarks of Google LLC. All other company and product names may be trademarks of the respective companies with which they are associated.


This content is not currently available
We will notify you via email when it becomes available

Great!
We will contact you via email if it becomes available

One lab at a time
Confirm to end all existing labs and start this one