


Before you begin
- Labs create a Google Cloud project and resources for a fixed time
- Labs have a time limit and no pause feature. If you end the lab, you'll have to restart from the beginning.
- On the top left of your screen, click Start lab to begin
Creating a log sink
/ 20
Deploying the Pub/Sub to Splunk Dataflow Template
/ 30
Create a Service Account for Splunk TA
/ 30
Bonus - Pub/Sub Input
/ 10
Monitor and troubleshoot pipelines
/ 10
This lab was developed with our partner, Splunk. Your personal information may be shared with Splunk, the lab sponsor, if you have opted in to receive product updates, announcements, and offers in your Account Profile.
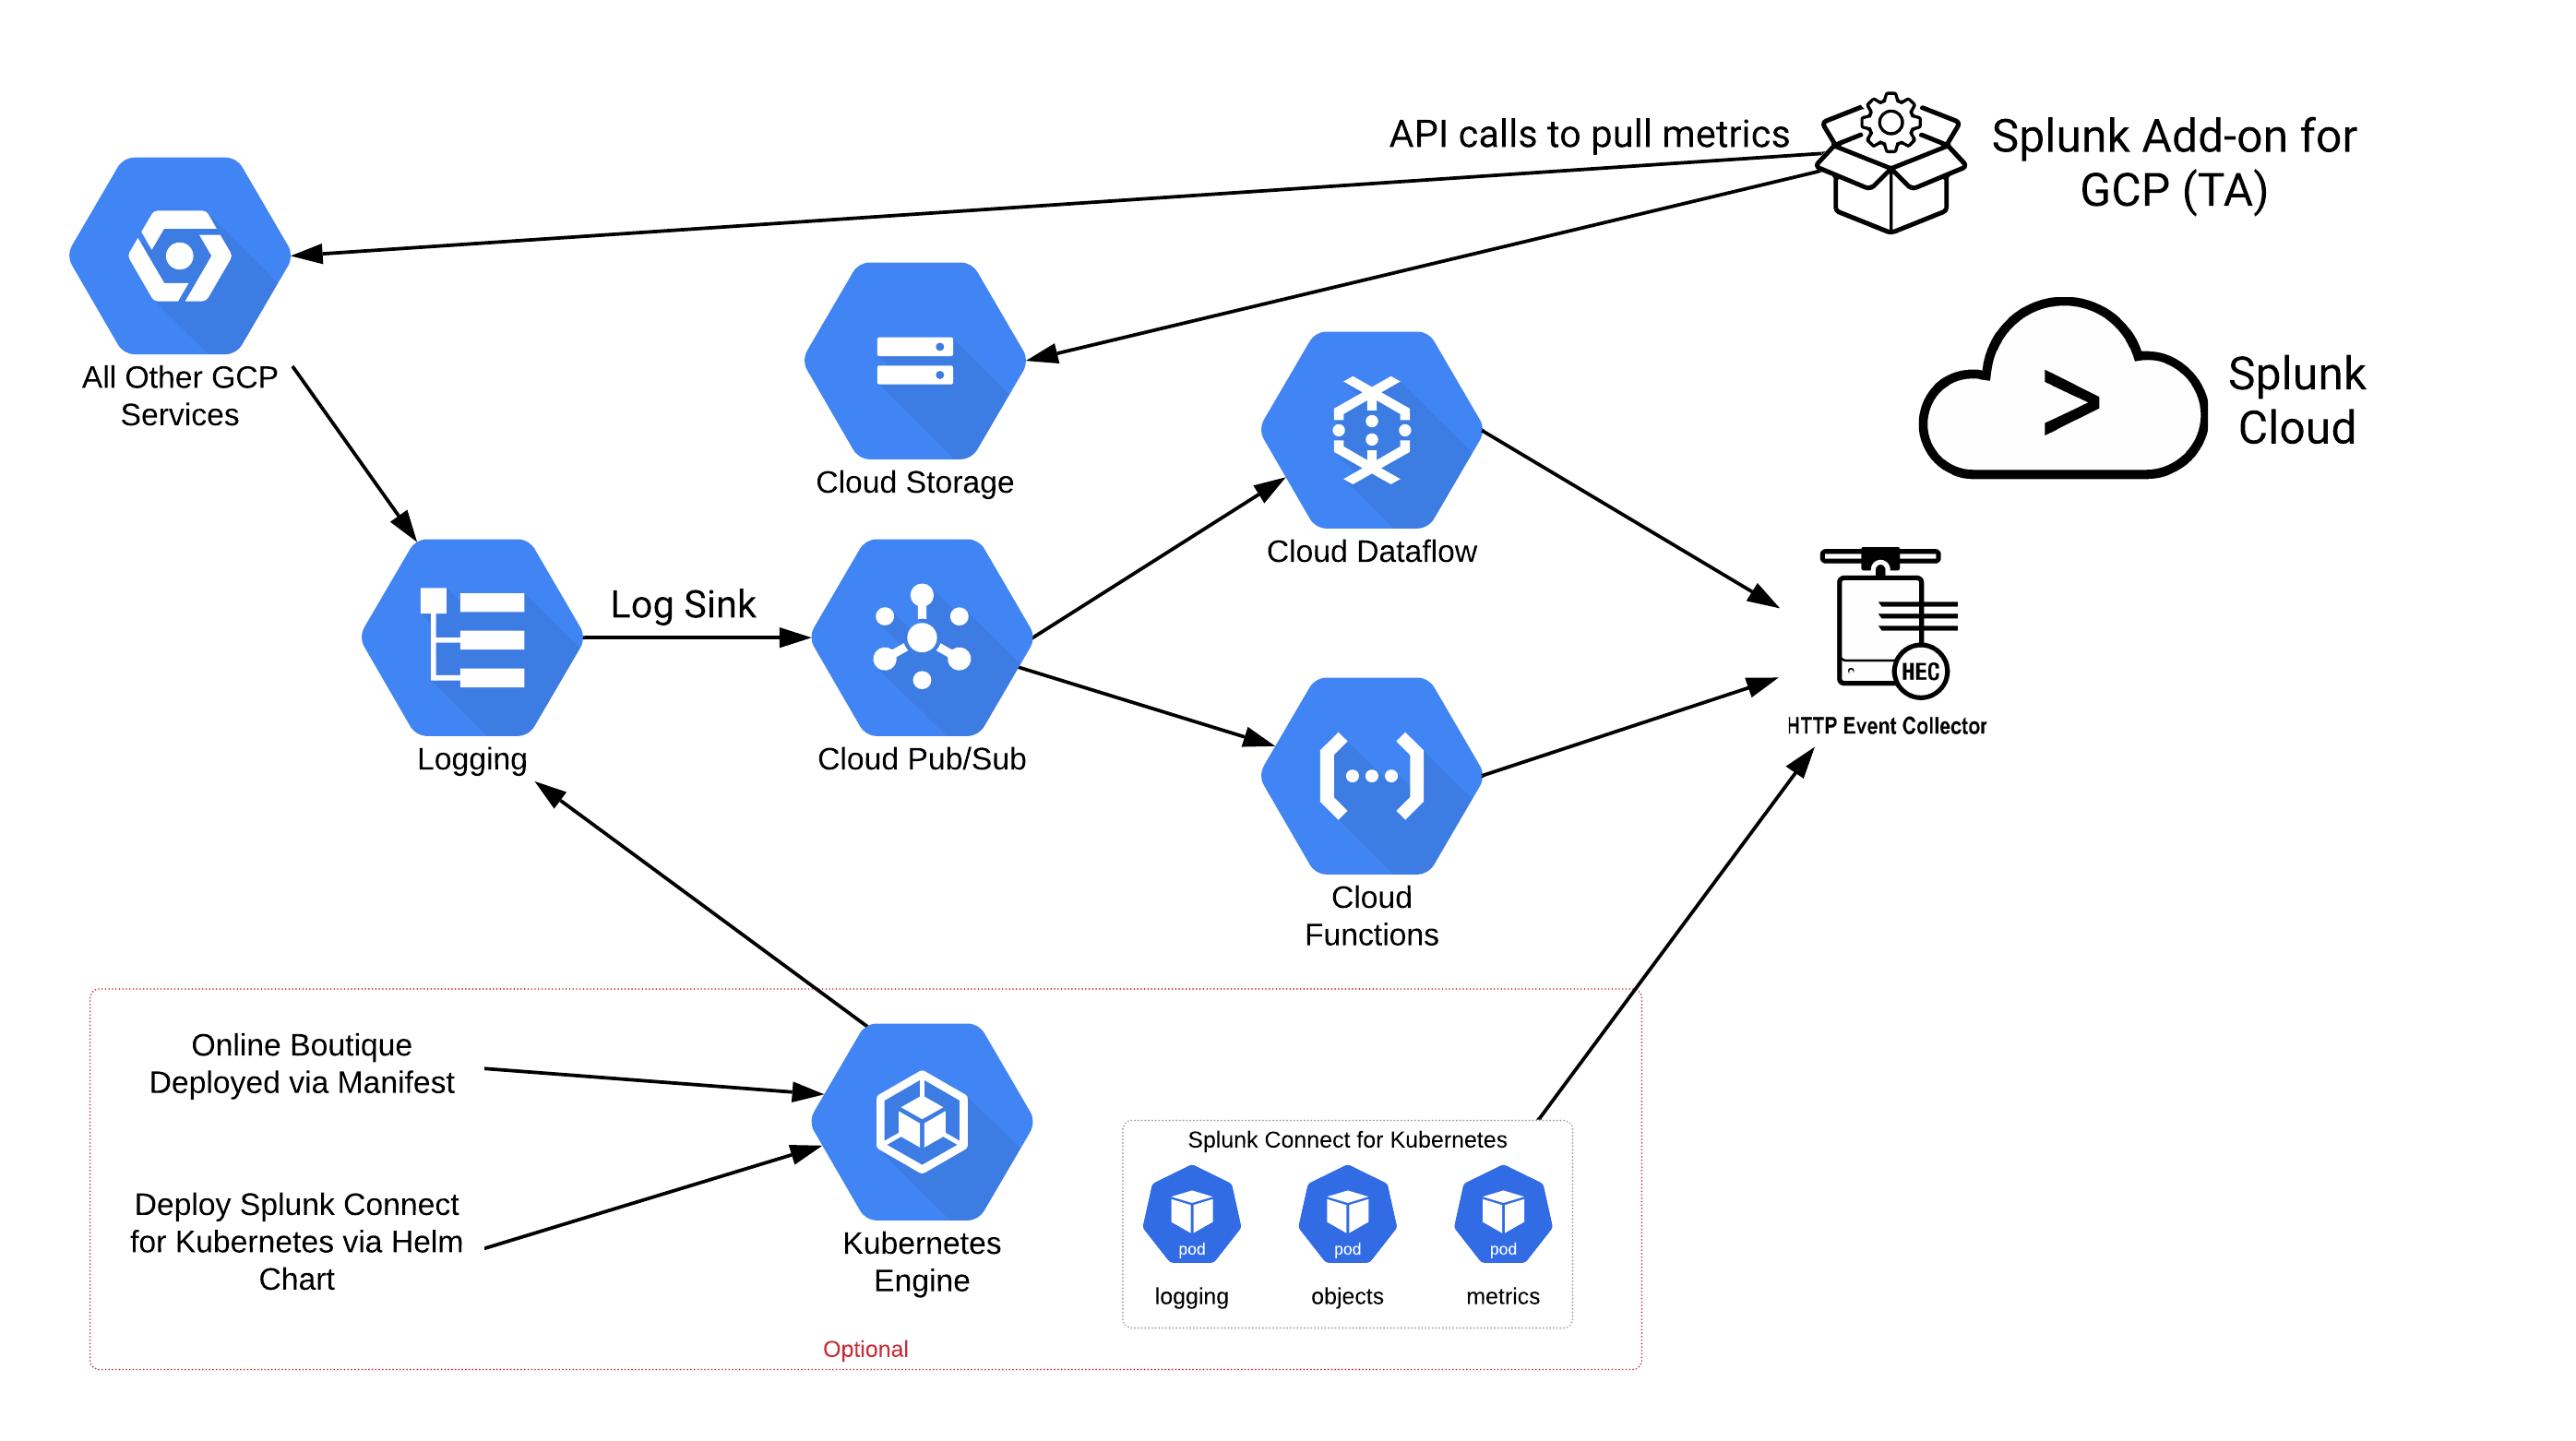
In this hands-on lab, you'll learn how to configure Google Cloud to send logging and other infrastructure data to Splunk Cloud via Dataflow, the Splunk Add-on for Google Cloud Platform, and Splunk Connect for Kubernetes (SC4K).
Although you can easily copy and paste commands from the lab to the appropriate place, students should type the commands themselves to reinforce their understanding of the core concepts.
In this lab, you will:
Prior to starting the timer on this lab, please create and configure a Splunk Cloud trial.
Visit splunk.com to sign up for a free trial account.
Once you have logged into splunk.com, click on "Free Splunk."
Then click Get the Free Trial.
Then click Start trial.
Credentials for your trial Splunk Cloud environment will be sent to your email. Please check your spam folder if you do not see the email in your inbox. Look for an email with the subject "Cloud Fulfillment". In this email you'll find a custom URL for your instance, your admin username and temporary password. This is not the same password of your Splunk Portal.
Copy that URL you received in the email and open it in a web browser. Log in your instance using the admin username and temporary password. Once you’ve logged into your Splunk Cloud instance, you will be asked to change the password and accept the terms of service. Please do so before proceeding.
Next, install the Splunk Add-on for Google Cloud.
On the left pane click on + Find More Apps.
Search for "Google Cloud" in the search box.
To narrow search results, ensure "IT Operations" and "Business Analytics" are checked under Category.
Choose Add-on under App Type, Splunk Supported under Support Type, Inputs under App Content, and Yes under Fedramp.
Look for the "Splunk Add-on for Google Cloud Platform" search result under Best Match.
Click on the Install button.
You will be required to enter your Splunk.com credentials. This should be the same account you used to initiate the Splunk Cloud trial. This is not the trial instance admin user and password that you just used.
Ensure you have placed a check in the box indicating you have reviewed the Splunk software terms and conditions.
Click the Agree and Install button to proceed.
Once you have logged in successfully, you will see a screen indicating that the add-on is downloading and installing.
If you encounter an error with your username/password ensure that you have verified your e-mail address (a confirmation is sent via e-mail to confirm the address).
Finally, you will see a screen indicating the installation is complete.
You may see a warning in the "Messages" dropdown section of the top navigation bar indicating that Splunk must be restarted. For the purposes of this lab, you can safely ignore this message.
An index is a repository for Splunk data. Splunk Cloud transforms incoming data into events which it then persists to an index.
You will need to create the following event indexes for this lab:
You will need to create the following metric indexes for this lab:
If this is the first time you're opening this app, click Skip tour in the bottom right corner.
Next, click on Settings.
Once this menu is expanded, click Indexes.
Click New Index.
Use "Index name" as gcp_data and leave "Index Data Type" set as Events.
Set "Max raw data size" to 0 and "Searchable retention (days)" to 15.
Click Save to create the index.
Following the same aforementioned gcp_data steps above, create the other gcp_ta, and gcp_connect indexes. Use the same type, size, and searchable time.
You will also need to create a metrics index for gcp_metrics. The steps are the same as previous indexes, with the exception of selecting a "Metrics" index rather than an "Events" index during creation.
The HTTP Event Collector (HEC) is a fast and efficient way to send data over HTTP (or HTTPS) to Splunk Cloud from a logging source such as Splunk Connect for Kubernetes (SC4K) or the Splunk Dataflow template. In this section, you will create HEC endpoints along with corresponding authentication tokens.
Click Settings > Data Inputs in the Splunk Cloud top navigation.
Click on Add New next to HTTP Event Collector.
Name the HEC gcp-sc4k and leave other fields as default.
Click Next.
In the "Selected Allow Indexes" chooser, select the gcp_connect and gcp_metrics indexes created in the previous step.
Select the gcp_connect index as the default index.
Review and submit the HEC configuration.
Copy the token value to a temporary scratch file. You will be using this token later in the lab.
Click Settings > Data Inputs in the Splunk Cloud top navigation.
Click on Add New next to HTTP Event Collector.
Name the HEC gcp-dataflow and leave other fields as default.
Click Next.
In the "Source type" section, click Select and specify google:gcp:pubsub:message as the source type.
In the "Selected Allow Indexes" chooser, select the gcp_data index.
Select the gcp_data index as the default index.
Review and submit the HEC configuration.
Copy the token value to a temporary scratch file. You will be using this token later in the lab.
Read these instructions. Labs are timed and you cannot pause them. The timer, which starts when you click Start Lab, shows how long Google Cloud resources will be made available to you.
This Qwiklabs hands-on lab lets you do the lab activities yourself in a real cloud environment, not in a simulation or demo environment. It does so by giving you new, temporary credentials that you use to sign in and access Google Cloud for the duration of the lab.
To complete this lab, you need:
Note: If you already have your own personal Google Cloud account or project, do not use it for this lab.
Note: If you are using a Pixelbook, open an Incognito window to run this lab.
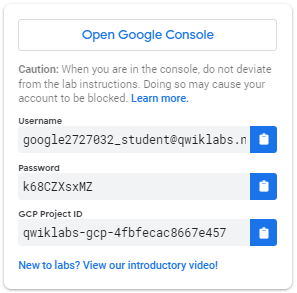
Click the Start Lab button. If you need to pay for the lab, a pop-up opens for you to select your payment method. On the left is a panel populated with the temporary credentials that you must use for this lab.
Copy the username, and then click Open Google Console. The lab spins up resources, and then opens another tab that shows the Sign in page.
Tip: Open the tabs in separate windows, side-by-side.
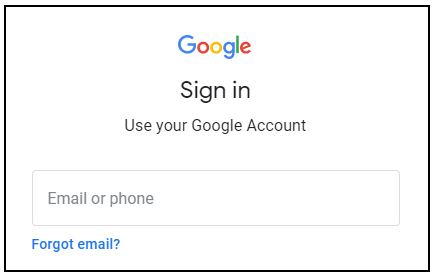
In the Sign in page, paste the username that you copied from the Connection Details panel. Then copy and paste the password.
Important: You must use the credentials from the Connection Details panel. Do not use your Qwiklabs credentials. If you have your own Google Cloud account, do not use it for this lab (avoids incurring charges).
Click through the subsequent pages:
After a few moments, the Cloud Console opens in this tab.
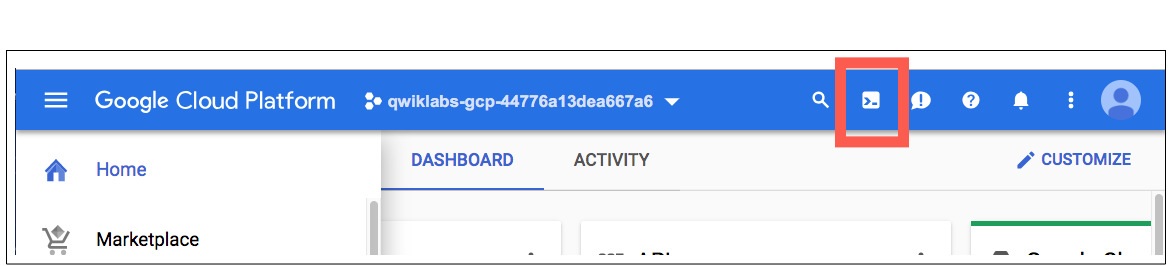
Cloud Shell is a virtual machine that is loaded with development tools. It offers a persistent 5GB home directory and runs on the Google Cloud. Cloud Shell provides command-line access to your Google Cloud resources.
In the Cloud Console, in the top right toolbar, click the Activate Cloud Shell button.
Click Continue.
It takes a few moments to provision and connect to the environment. When you are connected, you are already authenticated, and the project is set to your PROJECT_ID. For example:
gcloud is the command-line tool for Google Cloud. It comes pre-installed on Cloud Shell and supports tab-completion.
You can list the active account name with this command:
(Output)
(Example output)
You can list the project ID with this command:
(Output)
(Example output)
This section is only required if you're performing lab steps via the CLI.
Launch Cloud Shell.
Ensure the Project ID variables is set:
If the environment variable is not set, please follow the steps above under "Google Cloud Shell".
First, assign several Splunk Cloud-specific environment variables. You will need to supply the hostname of your Splunk Cloud instance along with the HEC tokens you created in the previous HTTP Event Collector setup steps:
For example:
Additionally, please set the following environment variables:
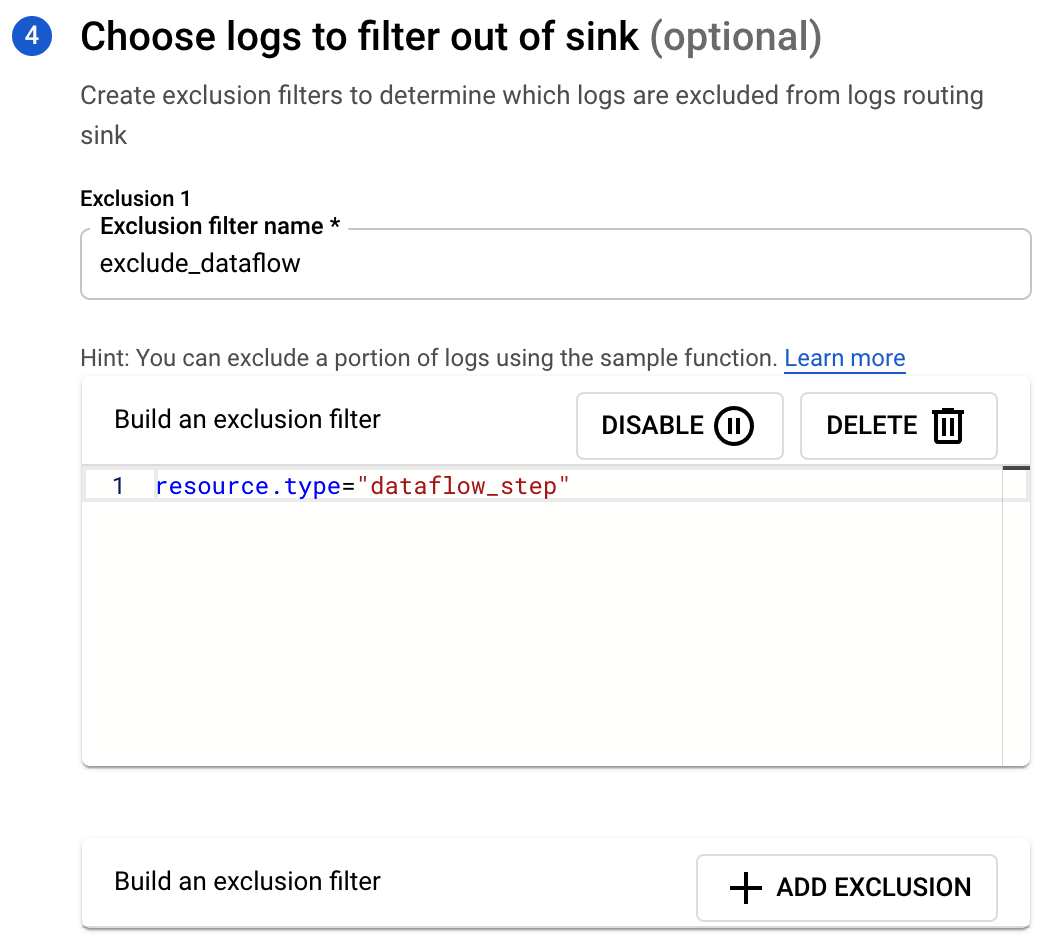
The first step to getting data from Operations Logging (Stackdriver) to Splunk is to create a log sink. All logging data for Google Cloud is sent to Operations Logging; the sink exports that data real-time to another location (Pub/Sub, BigQuery, Cloud Storage). You will forward the logs on to Pub/Sub for processing.
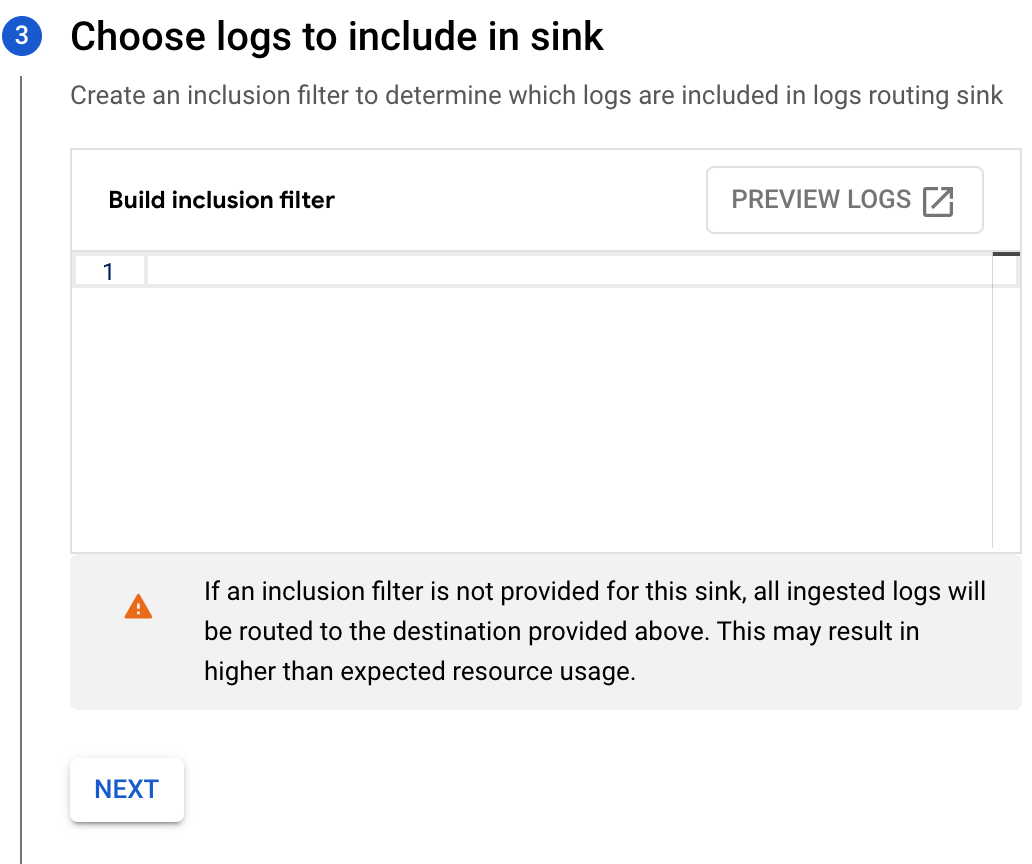
You have to be careful that you don't create an infinite loop of logging. If you don't have exclusions on the log sink then the system will attempt to send the log event of it sending a previous event which creates another log event that it will then try to forward.
This process also creates the destination Pub/Sub topic (automatically in the UI, manually via the CLI).
In the Cloud Console go to Analytics > Pub/Sub > Topics.
Click on Create Topic.
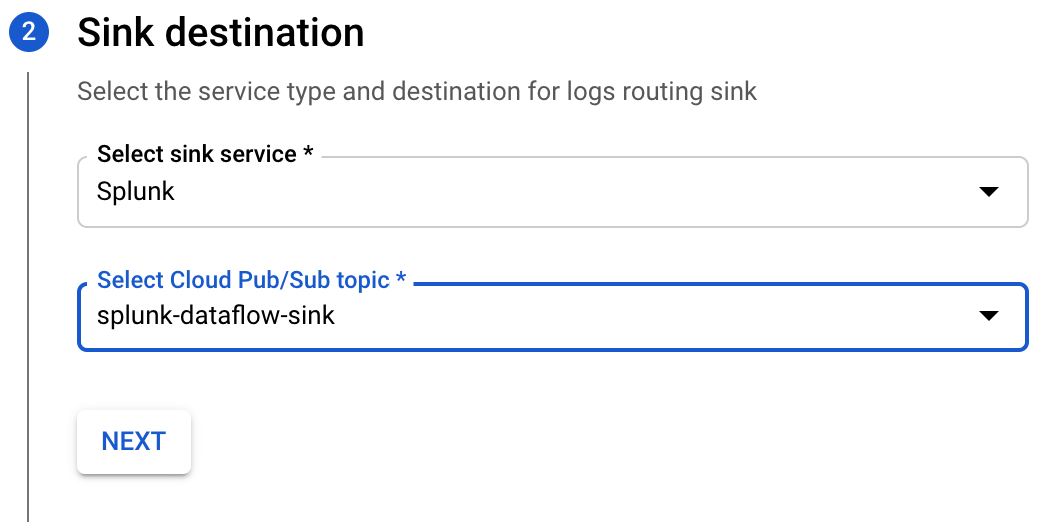
Name the sink splunk-dataflow-sink, leave the default values, and click Create.
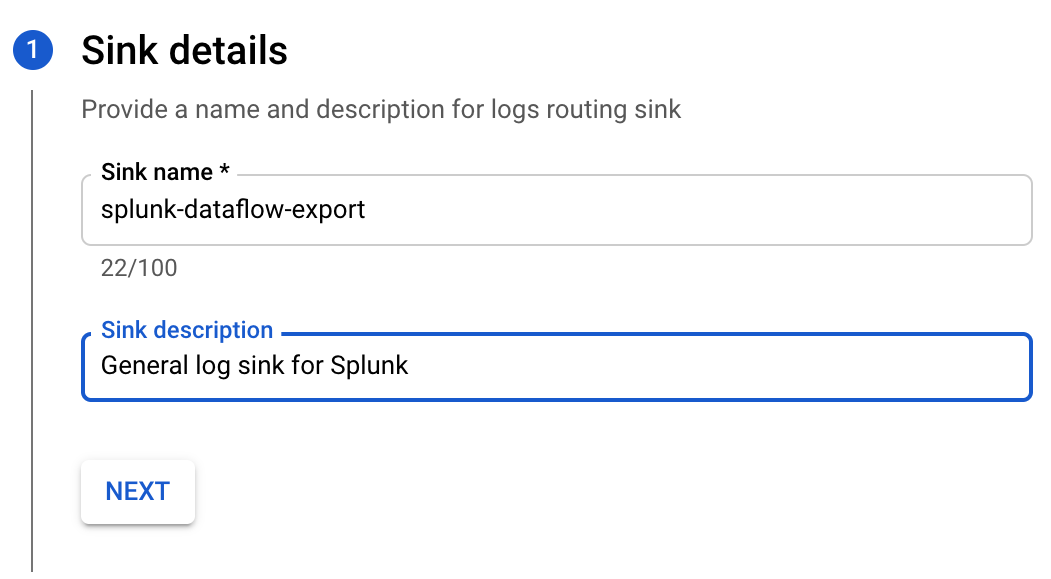
Next, in the Cloud Console go to Operations > Logging > Log Router.
splunk-dataflow-sink and click Next.Click Check my progress to verify the objective.
The next part of getting the logging sent to Splunk is the deployment of the Pub/Sub to Splunk Dataflow Template. This deploys a Dataflow pipeline that streams the events from a Pub/Sub subscription, batches them up, and sends them to Splunk HEC. Optionally (although not done in the lab), you can add an inline UDF function that manipulates the log messages. This could be a process to remove sensitive information or augment the message with additional data from another source.
The Pub/Sub to Splunk Dataflow template is just one way of sending data to Splunk. In a later section you will also explore using the Splunk Add-on for Google Cloud.
Go to Navigation menu > IAM & Admin > IAM.
Click the pencil icon on the compute@developer.gserviceaccount.com service account.
Select the Dataflow Admin role (in the Role dropdown menu) and click Save.
Now you will create a bucket for the Dataflow template used during deployment.
Go to Navigation menu > Cloud Storage > Buckets.
Click on + Create.
<project-id>-dataflow would be unique).Region for Location type and choose ‘<ql-variable key="project_0.default_region" placeHolder="<filled in at lab start>"></ql-variable>' for the Location.Now you will create a Pub/Sub Topic for the dead letter queue.
You'll see the one topic created for the logs router.
splunk-dataflow-deadletter for Topic ID.You'll be forwarded to the topic page for the dead letter queue.
Scroll down to subscriptions.
Click on Create Subscription > Create Subscription to create a subscription to store items forwarded to the dead letter queue. If a topic doesn't have a subscription anything sent to it is discarded.
Type deadletter in the Subscription ID field and leave all else as default.
Click Create.
splunk-dataflow-sink) by the Log Router.dataflow for Subscription ID and create the subscription for Dataflow (leave all other defaults).projects/<your-project-id>/subscription/dataflow).splunk-dataflow in the Job name field|
Input Cloud Pub/Sub subscription |
projects/<your-project-id>/subscriptions/dataflow |
|
HEC URL |
https://<splunk-cloud-host-name>:8088 |
|
Output deadletter Pub/Sub topic |
projects/<your-project-id>/topics/splunk-dataflow-deadletter |
|
Temporary location |
<your-project-id>-dataflow/tmp |
Click on Show Optional Parameters.
Set the parameters as shown:
|
HEC Authentication token |
<your-dataflow-hec-token> |
|
Batch size |
10 |
|
Maximum number of parallel requests |
4 |
|
Disable SSL certification validation |
|
|
Include full Pub/Sub message in the payload |
|
|
Max workers |
2 |
|
Worker region |
Use job's regional endpoint |
|
Use default machine type |
Unselected |
|
Machine type |
e2-medium |
The job should take a few minutes to deploy. Once deployed, you can monitor the job throughput and other metrics using the Job Graph and Job Metrics tabs. For example, you can monitor the throughput metric to track the number of events processed over time.
Click Check my progress to verify the objective.
In order to connect the Splunk Add-on for Google Cloud (TA) to Google Cloud to pull data, create a service account with appropriate permissions. In this lab you are providing the service account an exhaustive list of permissions as you are connecting all input methods. If you're using the TA only for a few of the inputs, a reduced list of permissions can be set.
Type splunk-ta in the Service account name field
Click Create & Continue.
Add the permissions needed (you can search to make it easier to find them):
Compute Admin
Logs Configuration Writer
Logs Viewer
Monitoring Viewer
Storage Admin
Storage Object Viewer
Viewer
Pub/Sub Viewer
Click Continue.
Click Done.
Click on your newly provisioned service account.
Click the Keys tab on the top bar.
Click Add Key > Create new key.
On the Create private key for "splunk-ta" page, leave the default JSON key type selected and click Create. This will download the JSON key file to your system - store this for later.
Click Check my progress to verify the objective.
gcp_creds in the Name field and paste the credentials from the JSON file that was downloaded when you created the service account in the Google Service Account Credentials field.If you encounter an invalid JSON error, verify that you haven't pasted any additional carriage returns (line ending) in the private key. If you copy the text from a terminal it may lead to extra lines. The private_key should be a single line that will line wrap in the UI.
Click on Inputs.
Expand the Create New Input dropdown menu.
You should see the different options, including Cloud Pub/Sub, Cloud Monitoring, Google Cloud BigQuery Billing, Cloud Storage Bucket, and Resource Metadata.
The table below details their purposes.
|
Input |
Purpose |
|
Cloud Pub/Sub |
Logging events and other Pub/Sub generated events |
|
Cloud Monitor |
Metrics such as CPU and DISK usages of Instances. |
|
Google Cloud BigQuery Billing |
Pull billing information from a Cloud Storage bucket. Note, this doesn't work currently work for everyone due to the decomissioning of File Export for Billing (only billing accounts with previous CSV configuration will work). |
|
Cloud Storage Bucket |
Pulls data from a Cloud Storage bucket such as application logs but could be any CSV, JSON or raw text. |
|
Resource Metadata |
Information on the resources in an organization/project. |
The Splunk Add-on for Google Cloud supports ingesting a variety of data sources from Google Cloud. You've already set up Dataflow to send Google Cloud logs to Splunk, so next you'll configure the Splunk TA to pull:
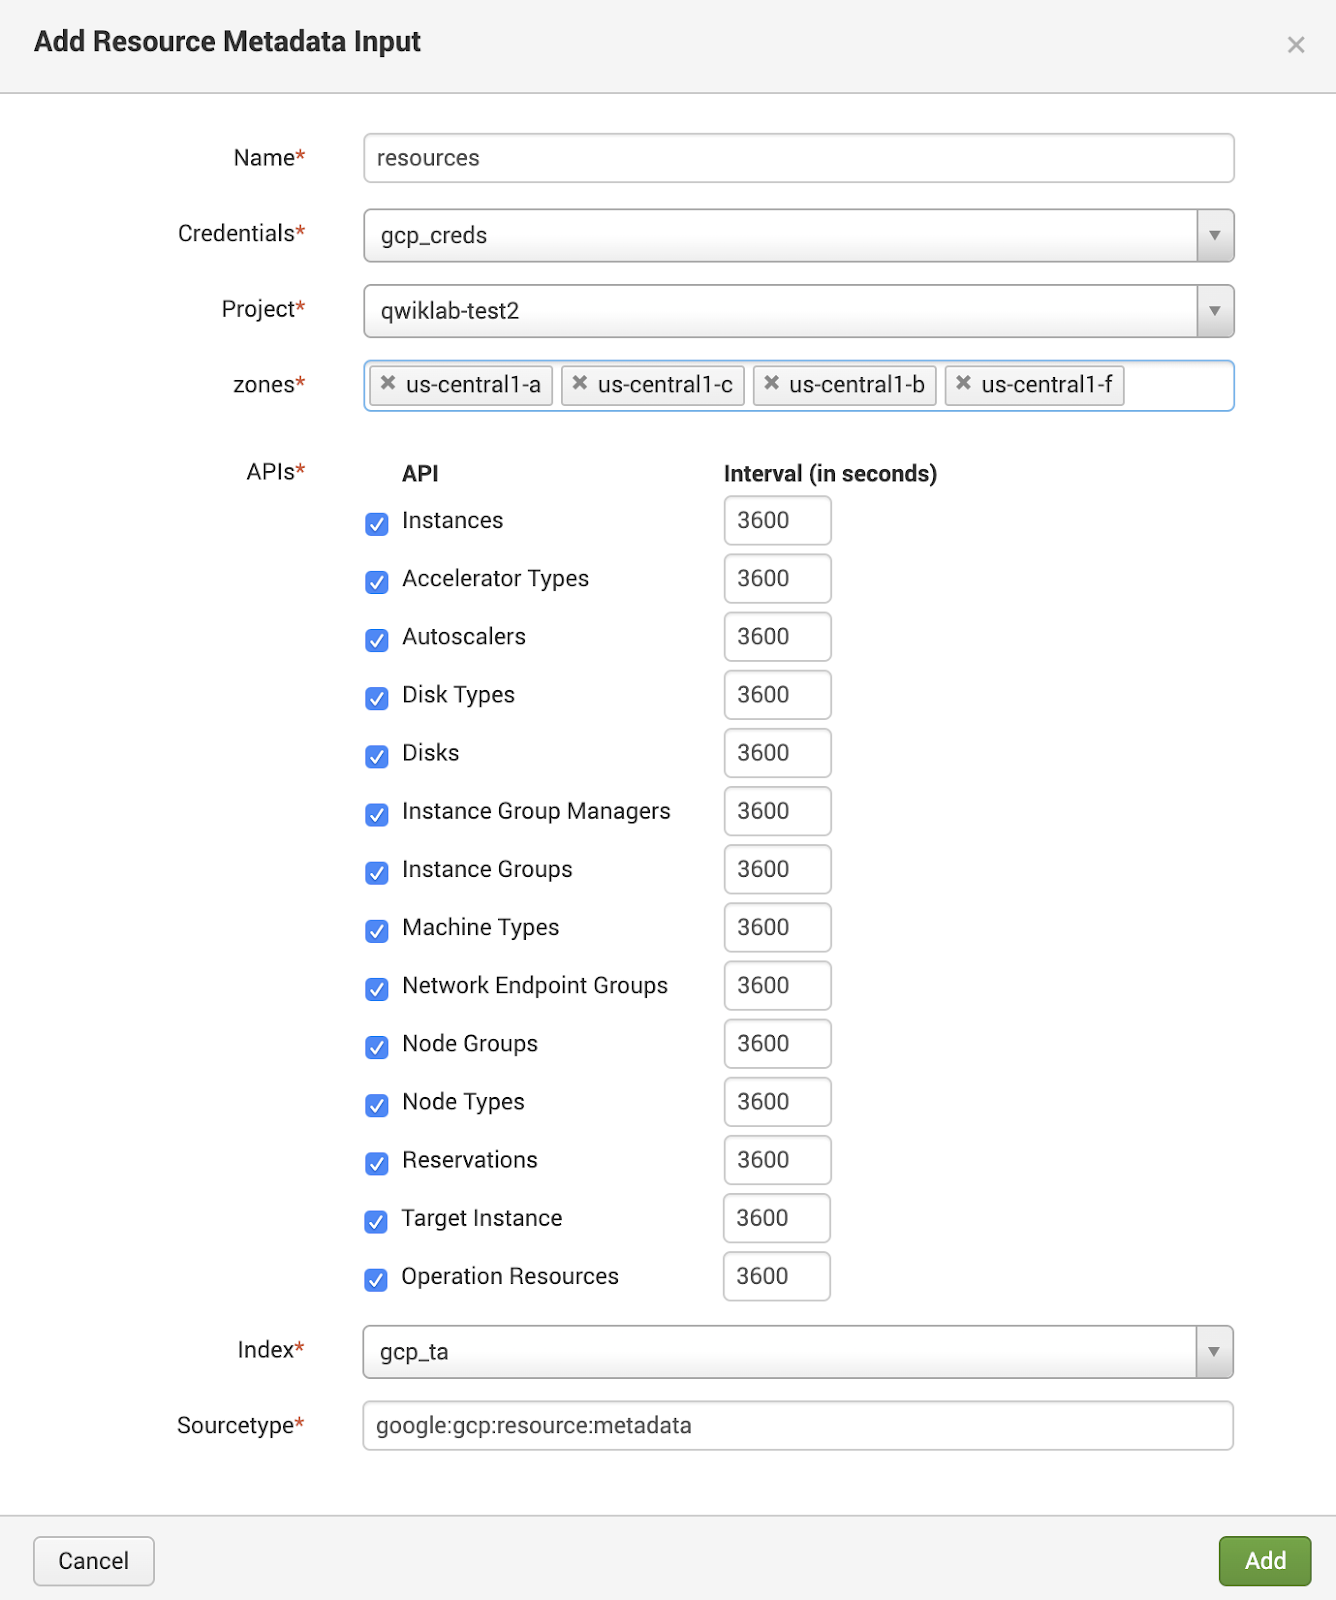
The Resource Metadata input can be configured to pull metadata from various Compute Engine resources and enable Splunk users to monitor and set up analytics for their Compute Engine deployments.
Click Create New Input > Resource Metadata > Compute Engine.
Configure a Resource Metadata input with the following (again, each project will be unique):
|
Name |
|
|
Credentials |
select the |
|
Project |
<your-project-id> |
|
Zones |
us-central1-a, b, c, f |
|
APIs |
leave all checked |
|
Index |
|
|
Sourcetype |
keep default |
Your configuration should resemble the following:
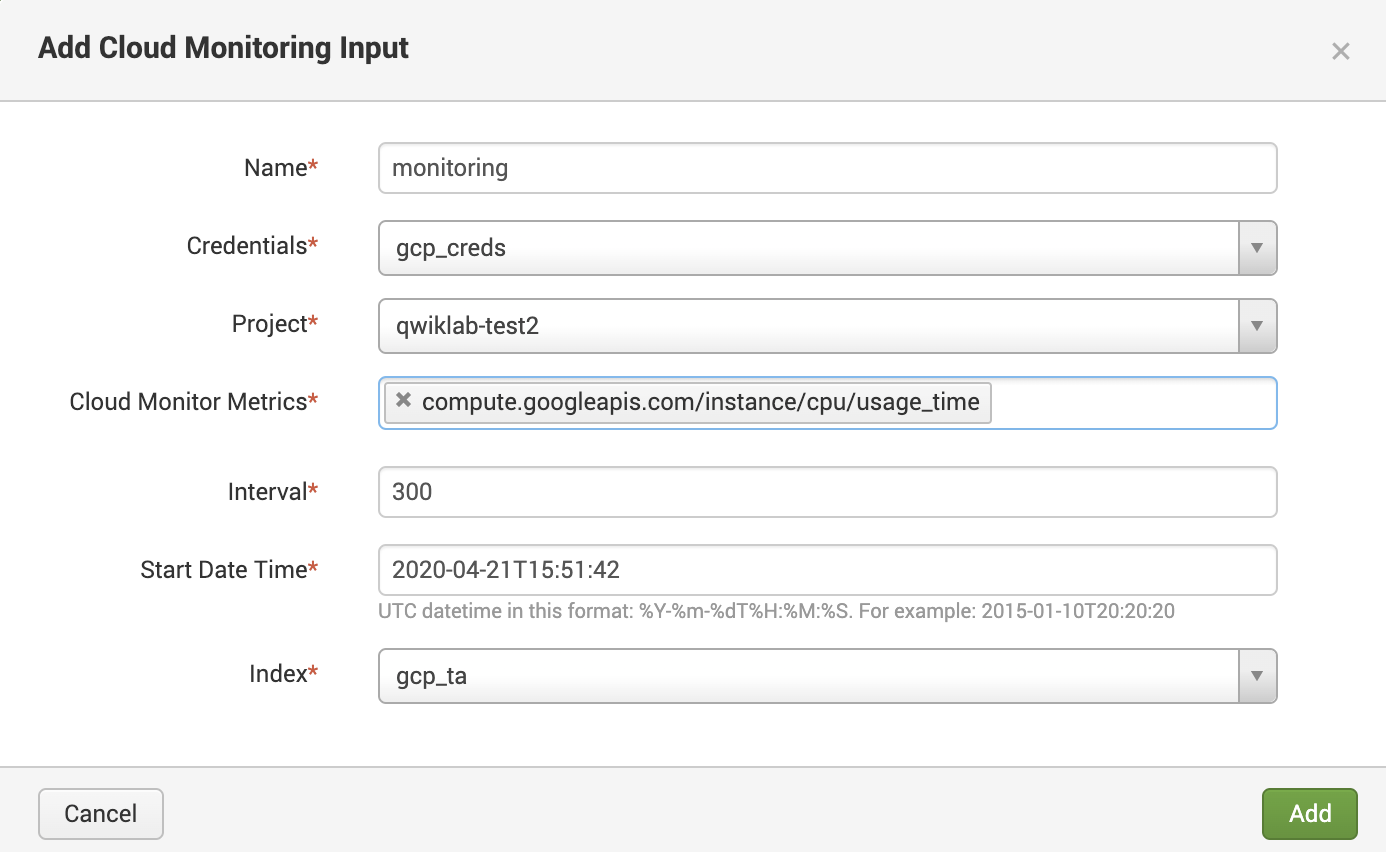
Cloud Monitoring collects metrics from a wide range of services on Google Cloud, as well as a variety of third-party software. A complete list of all predefined metrics can be found in the Metrics list reference. If you need something that isn't already defined, you can create your own custom metrics.
Click Create New Input > Cloud Monitoring.
Configure Cloud Monitoring Input with the following parameters:
|
Name |
|
|
Credentials |
select the |
|
Project |
<your-project-id> |
|
Cloud Monitor Metrics |
compute.googleapis.com/instance/cpu/usage_time |
|
Interval |
keep default |
|
Start Date Time |
keep default |
|
Index |
|
Your configuration should resemble the following:
This section requires usage of the CLI. Ensure the environment variables provided in the Setup section of this lab are present in your shell.
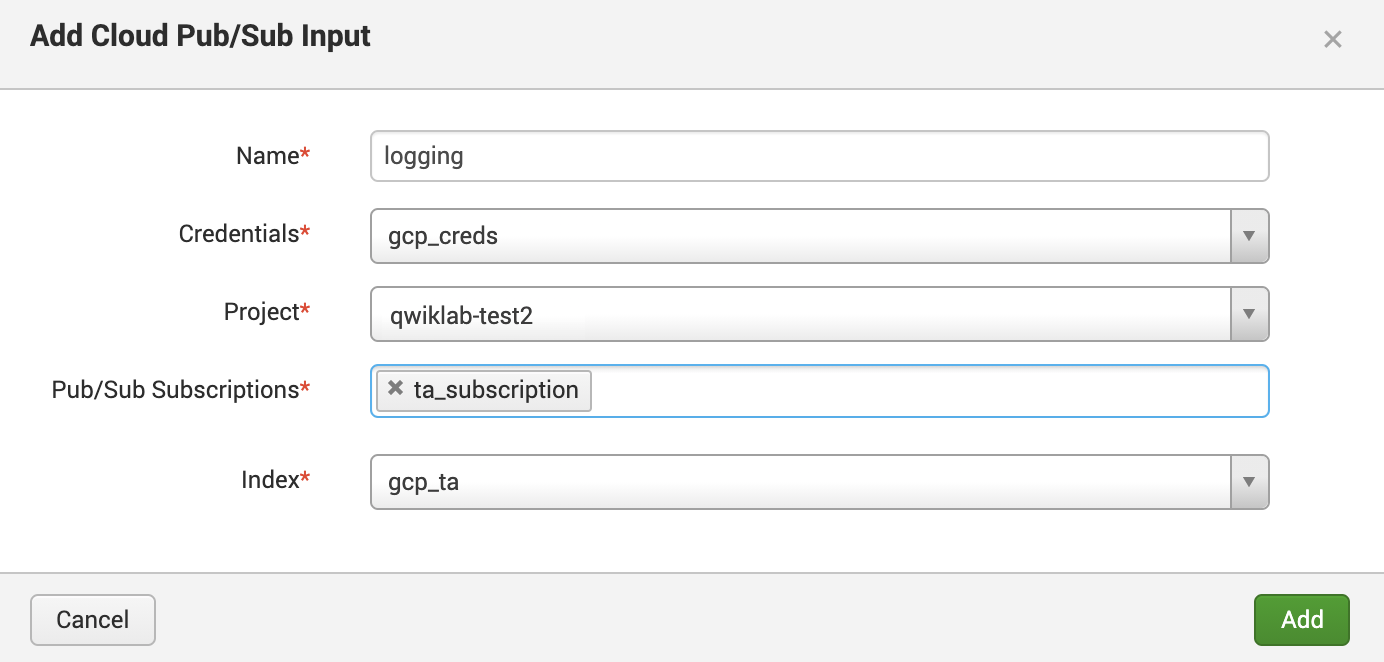
You can also ingest logs via the Pub/Sub input using the TA.
ta_subscription:Click Check my progress to verify the objective.
Finally, navigate back to the Splunk Cloud console.
Click Create New Input > Cloud Pub/Sub.
Fill out the configuration as follows, you can add the Cloud Pub/Sub input pointing to the subscription created:
|
Name |
|
|
Credentials |
select the |
|
Project |
<your-project-id> |
|
Pub/Sub Subscriptions |
|
|
Index |
|
Your configuration should resemble the following:
Now that you have various types of Google Cloud data hooked up to Splunk, take a look at some common Splunk searches you can use to get value out of this data.
This SPL will generate a table of those events.
While Splunk can be used for most troubleshooting scenarios, there is one situation where that cannot be done: when Dataflow has failed to send data to Splunk. To troubleshoot and monitor in these situations you'll have to rely on the built-in monitoring and logging in the Google Cloud console.
This section requires usage of the CLI. Ensure the environment variables provided in the Setup section of this lab are present in your shell.
The first time the monitoring console is opened it may prompt you to either create a new workspace (default select) or to add it to an existing workspace.
Accept the default select and click on Add.
Once the workspace has been prepared, open Cloud Shell and run the following to deploy a custom dashboard. You're free to edit and tweak the dashboards:
Go back to dashboards. You should see a dashboard in the list called Splunk Dataflow Export Monitor. If you don't, refresh the webpage.
After some time you should see the metrics for the Dataflow and Pub/Sub jobs.
Click Check my progress to verify the objective.
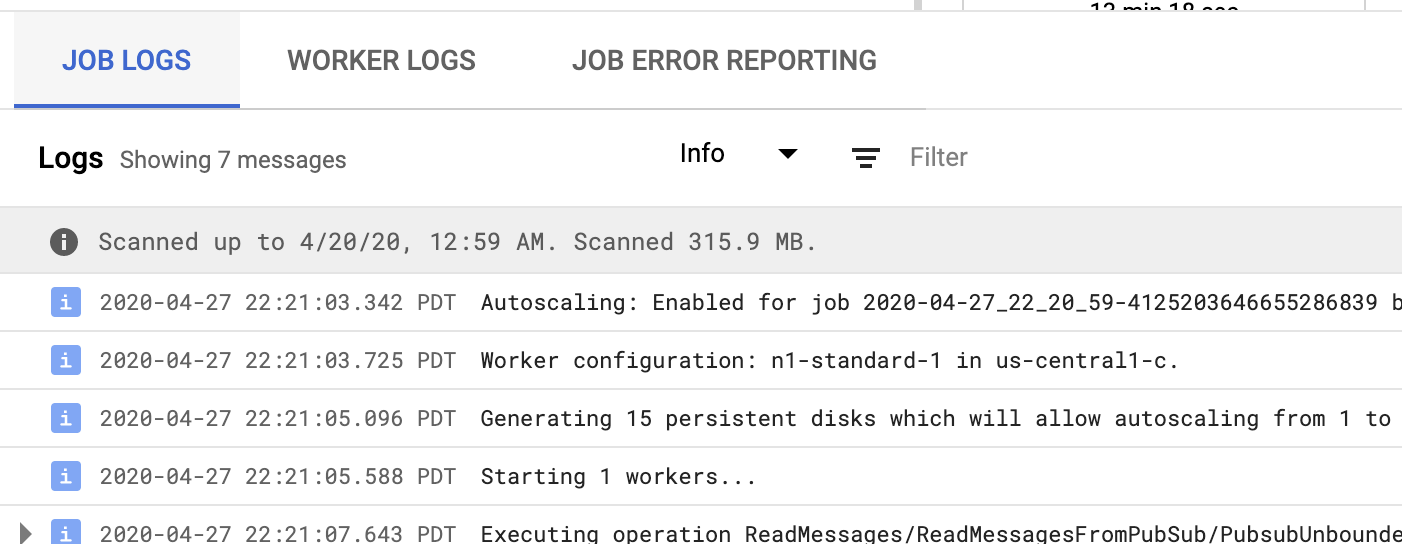
To see errors in Dataflow you can open up the Dataflow job by going to Navigation menu > Analytics > Dataflow > Jobs and clicking on the running job.
At the bottom of the page you can click on either Job Logs or Worker Logs to see logging relating to either the deployment and running of the stream itself (Job Logs) or logging relating to the function of the workers individually (Worker Logs).
In this lab you've seen two different ways to ingest logging data into Splunk.
The following table compares each method:
|
Method |
Pro |
Con |
|
Splunk Add-on for Google Cloud (TA) |
|
|
|
Dataflow |
|
|
This section requires usage of the CLI. Ensure the environment variables provided in the Setup section of this lab are present in your shell.
The Online Boutique Demo deploys numerous microservices and a simulated work log that will generate realistic log entries that you'll be able to inspect in Splunk. Refer to the GitHub repo for full details as to what is getting deployed.
The deployment can take a few minutes to fully spin up and show the external IP.
In the next few steps you will configure Splunk Connect for Kubernetes to send data to HEC. While much of this logging information is available via the standard Google Cloud logging, SC4K can provide deeper insight and allow Kubernetes visibility outside of Google Cloud.
Data should now be streaming into Splunk. Here's a couple of samples searches:
In this lab you used the Splunk Add-on for Google Cloud to create Splunk indexes, HTTP Event Collectors (HECs), log sinks, Cloud Storage buckets, and create Pub/Sub topics and subscriptions. You then launched a Dataflow template deployment, configure GCP-TA inputs, performed sample Splunk searches across ingested data, and monitored and troubleshooted Dataflow pipelines.
Check out the following for more information on Splunk with Google Cloud:
...helps you make the most of Google Cloud technologies. Our classes include technical skills and best practices to help you get up to speed quickly and continue your learning journey. We offer fundamental to advanced level training, with on-demand, live, and virtual options to suit your busy schedule. Certifications help you validate and prove your skill and expertise in Google Cloud technologies.
Manual Last Updated July 28, 2023
Lab Last Tested July 28, 2023
Creator Content available herein, is owned by Splunk Inc. and is provided "AS IS" without warranty of any kind.
Splunk, Splunk>, Turn Data Into Doing, Data-to-Everything and D2E are trademarks or registered trademarks of Splunk Inc. in the United States and other countries. All other brand names, product names, or trademarks belong to their respective owners. © 2021 Splunk Inc. All rights reserved.
Copyright 2024 Google LLC All rights reserved. Google and the Google logo are trademarks of Google LLC. All other company and product names may be trademarks of the respective companies with which they are associated.


This content is not currently available
We will notify you via email when it becomes available

Great!
We will contact you via email if it becomes available

One lab at a time
Confirm to end all existing labs and start this one