

Before you begin
- Labs create a Google Cloud project and resources for a fixed time
- Labs have a time limit and no pause feature. If you end the lab, you'll have to restart from the beginning.
- On the top left of your screen, click Start lab to begin
Chronicle Security Operations empowers cloud-first, modern SecOps teams to protect their organizations confidently, with cloud-native architecture, petabyte scale, sub-second queries, and automated responses.
In this lab you will learn the basics for performing basic administrative tasks within the Chronicle platform.
In this lab, you learn how to perform the following tasks:
Read these instructions. Labs are timed and you cannot pause them. The timer, which starts when you click Start Lab, shows how long Google Cloud resources will be made available to you.
This hands-on lab lets you do the lab activities yourself in a real cloud environment, not in a simulation or demo environment. It does so by giving you new, temporary credentials that you use to sign in and access Google Cloud for the duration of the lab.
To complete this lab, you need:
In this lab you will interact with Chronicle via the Chronicle Demo Platform. Open the Chronicle Demo Platform in a new browser tab.
When Chronicle was being built, the decision was made not to create another search language that users would need to learn to detect anomalies or threats in their data set. Instead, the Chronicle team leveraged YARA, which the Google VirusTotal team created and uses, but modified it to focus on logs and its associated telemetry.
As you start digging into YARA-L rules, it is important to understand the manner in which the rules are constructed. There can be as many as six sections in a rule. However, for the most basic rules, there are only three required sections:
As you add more capability to your rules, there are additional sections to add, but those extra sections also provide greater benefit in terms of fidelity and capability.
Rules can contain up to 6 sections:
In YARA-L 2.0, all variables are represented as $variable_name.
Variables can be defined within rules. They can be very important when comparing multiple events as well as temporarily storing specific values from events. The variables can then be used in performing actions such as counting the number of times an event occurs.
There are three different types of variables; Event, Placeholder and Match. All variables will be referenced with a dollar sign followed by the variable name. The hashtag variable will get introduced into the Match variable as well, but let’s not get ahead of ourselves.
Every single condition in the event section will have a variable in front of the UDM event or entity fields associated with it. The name of the variable can be arbitrary as you will see throughout this lab. The documentation will tell you that generally $u would indicate UDM events and $e would indicate UDM entity events, but this is not a hard and fast rule and in some examples you may see a variable like $event or $selection.
When you start getting into multi-event rules, you can describe events in a manner that makes it clear which events are which, i.e $failure or $success which might denote failed login events as compared to successful login events.
$event.target.user.userid
When working with multiple events, identifying failed logins as $failure.target.user.userid and successful logins as $success.target.user.userid is an easy way to keep their criteria separated and avoid confusion.
Defined in the event section and used to associate events with one another or to compare them.
Placeholder variables can be used to associate events with one another. You will be using this in the multi-event lab. In the above example, the $targetUser serves as a place where the target.user.userid value will reside. It can then be used to match other events with that same value. These placeholders can also be used in the outcome section.
One or more variables can be used to group results. These variable must first be defined in the events section as a placeholder.
The match variables are similar to the placeholder variables in the sense that they have been described in the event section but when used in the match section, you are going to apply that variable against a time window. In this case, you will be taking all of the events with the target user meeting the event criteria and grouping by that value over a 5-minute window.
It is similar to a SQL group-by section.
# is a special character in the condition section that can be used with event or placeholder variable names.
# can be used in place of $ for an event or placeholder.
Events or placeholders with # in place of $ will return a count of how many distinct events or placeholders were matched by the rule criteria.
Example Condition
When setting up conditions, you can use event or placeholder variable names. If you use the hashtag (#), you are looking for the number of distinct events or values that satisfy a condition, so $var would be equivalent to #var > 0.
You can also use the operator and if you have multiple criteria you need to meet before the rule fires. In the above example, you are looking for more than 5 distinct events that match your event criteria AND more than two values in targetUser. You will get into more examples of variables as we go.
Another capability within YARA-L is the use of event operators and modifiers.
and, or, and not can all be used within the event section. These, along with parenthesis, can be used to build out search criteria. For those who have worked with other tools that require these terms to be capitalized that is not the case here. and is assumed in the absence of other operators. In fact, if you define a list of events without specifying any operators it is assumed that and exists between each line.
Parenthesis can be used to ensure order of precedence is maintained.
nocase is a powerful modifier as well. This can be used to ignore case sensitivity by appending it to an event condition. In the below example, you are looking at a string, but this could apply to a regex as well. One important thing to note about nocase is that it cannot be applied to enumerated fields like metadata.event_type or network.ip_protocol. The fields that are enumerated are called out in the UDM field list and are what you would think of as reference lists that Chronicle has built into the system.
Example:
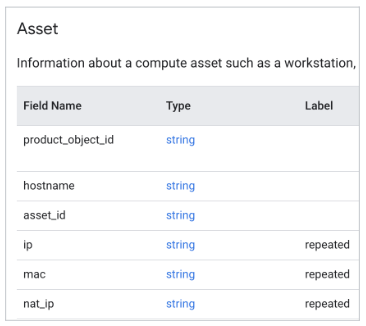
Fields that can have more than one value in them are called Repeated (Multi-value) fields. Ie mac, IP, nat_ip.
Please refer to the UDM field list to get more information.
any or all can be used to limit or broaden the search for values in fields that are labeled as repeated or multi-value.
For example, a server could have multiple IP addresses associated with it. The IP field is a repeated field and has an entry for each IP address. To ease searching in the rules engine, any or all can be used in front of the event variable to search through the repeated field list for the string specified.
Examples
In the above example, you might look for anytime you see the loopback address, 127.0.0.1 in the ip list and as soon as you see it, this meets your condition and the rule continues its evaluation. Alternatively, you have the all modifier looking across all values in that field. In this example, this rule may continue because none of the IP addresses match the loopback address.
With those basic concepts of YARA-L in place, let’s start looking at some rules. You are going to start with a single event rule and gradually add more complexity to it, so for some this may be reviewed but for others it may be brand new.
As mentioned earlier, this is where you will use the additional browser tab or window to access the Chronicle Demo Environment
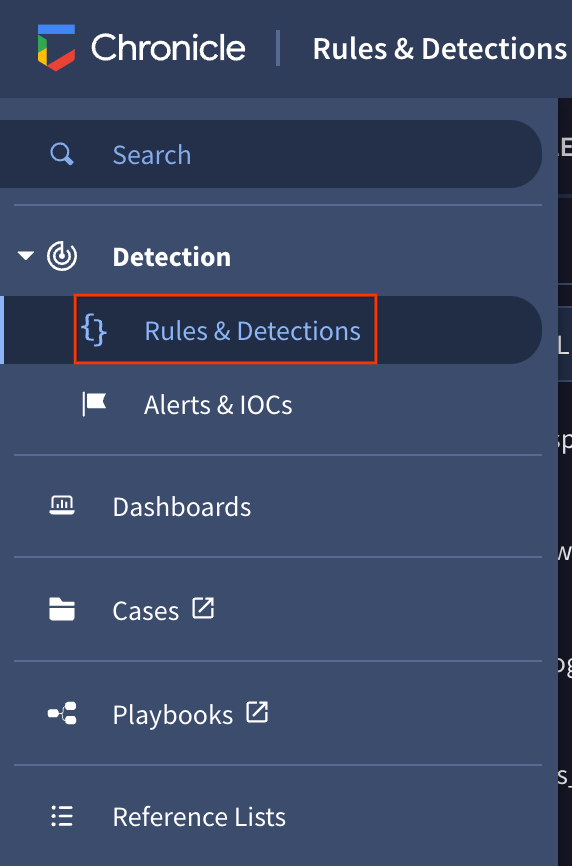
Start by navigating to the Rules section of the Chronicle instance. From left navigation menu, click Detection > Rules & Detections.
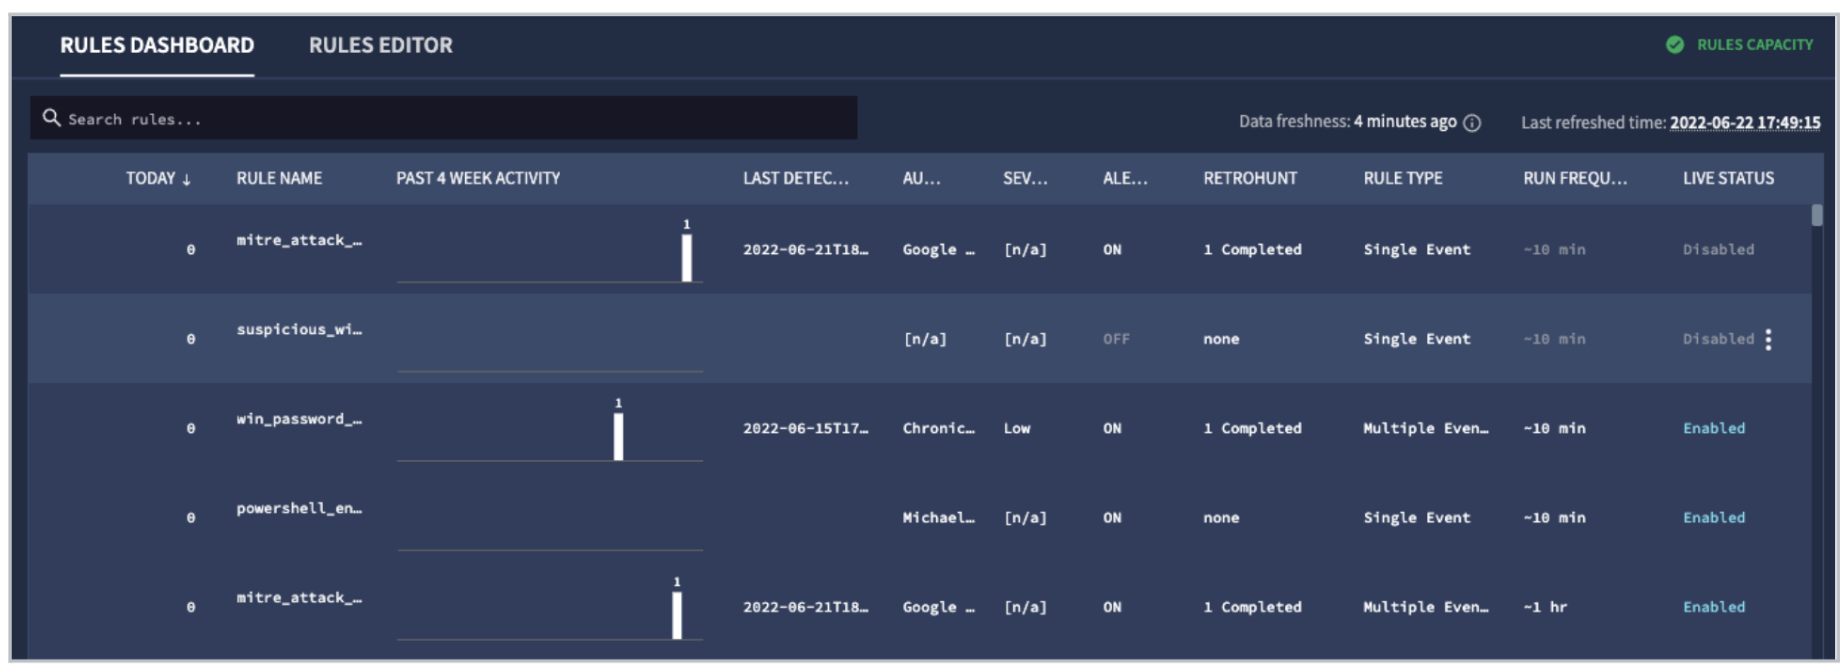
Select Rules Dashboard tab. The Rules Dashboard provides a breakdown of all the rules configured within the instance, as well as metrics around each of their performance. You can see when each of the rules last had a detection, metadata associated with the rules, how many retrohunts have been performed on each of the rules, the rule type, the frequency with which they are run, and whether they're live. Click on Rules Editor near the top of the window so you can view the logic within your rules.
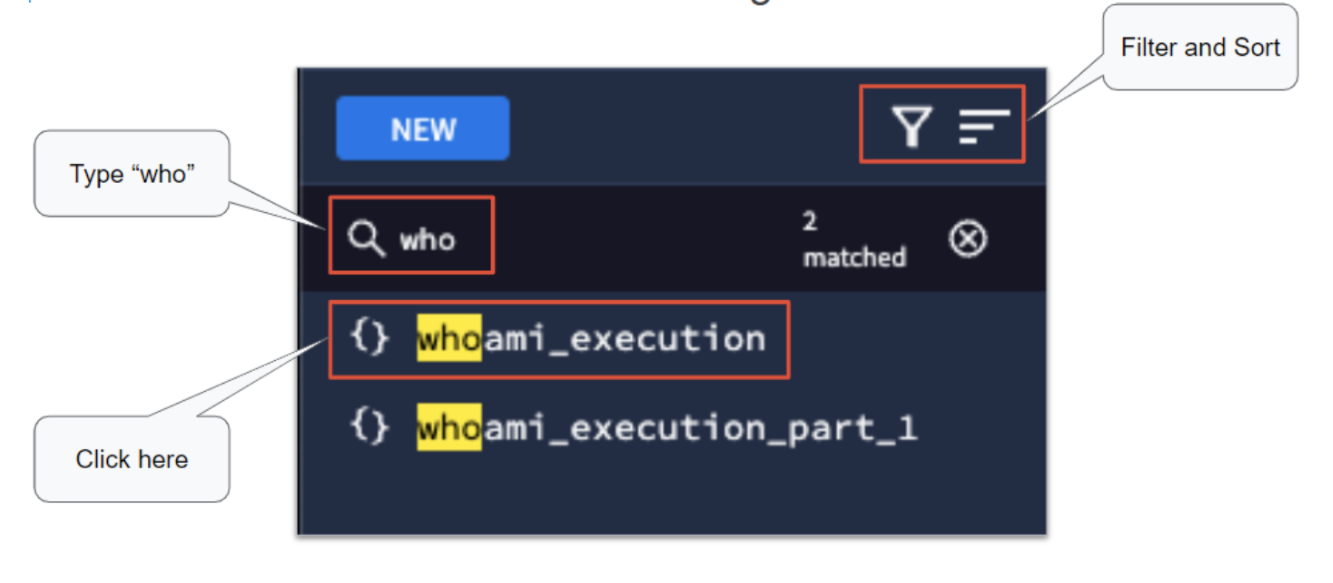
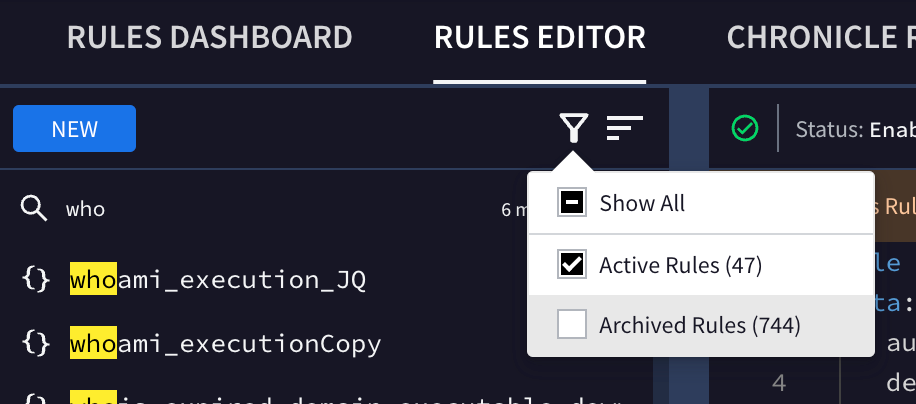
On the left side of the screen, there is a list of all of the rules on the instance. This list of rules can be filtered to include active rules, archived rules, or both. Active rules does not imply they are Live and Alerting, just that they are available for you to work with. If rules are archived, they cannot be edited until they are switched back to active. The sort allows you to sort the rules in alphabetical order, reverse alphabetical, or by last updated date. At the top, you can type a string in the text box and the rules that match that specified string will be shown. Type “who” into the text box and you will see the rules list shrink down to a smaller number. For this example, you want to look at the rule named whoami_execution, so click on that rule.
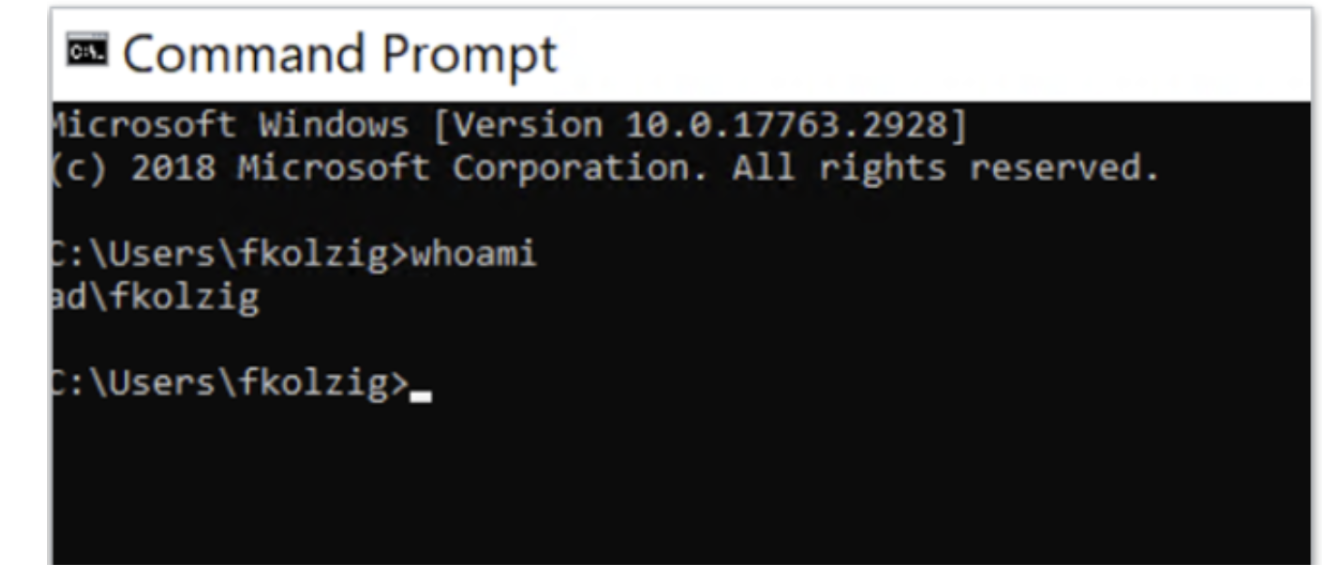
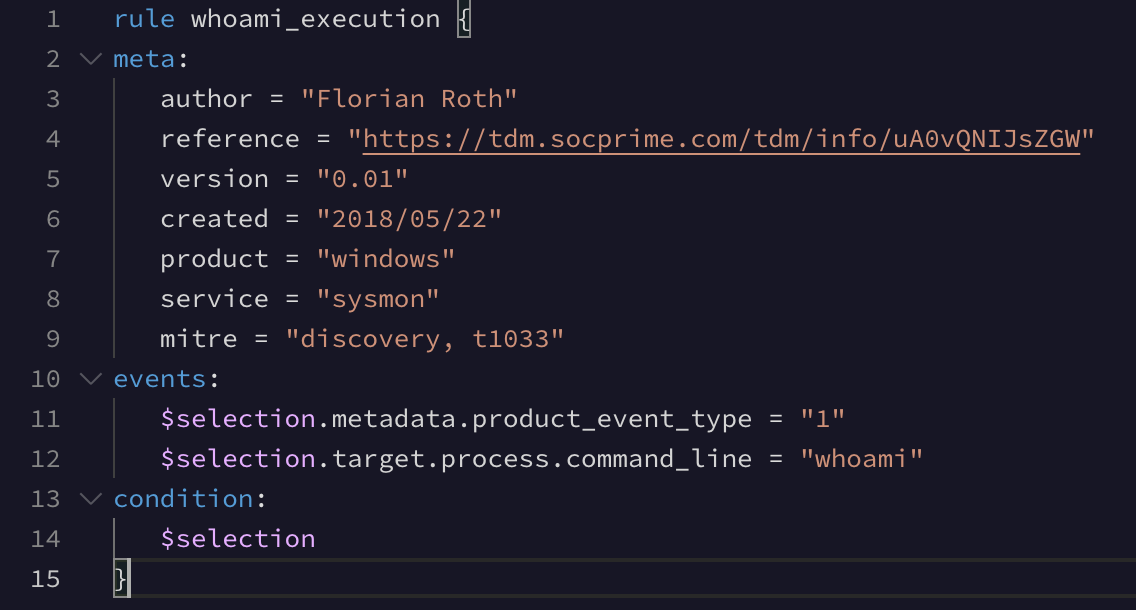
This is a very basic rule that alerts every time someone executes the "whoami" command, it serves as a starting point to understand the rules engine and how rules are constructed.
The events section is looking for values in two fields, the metadata.product_event_type and the target.process.command_line. This rule happens to rely specifically on Microsoft Sysmon data and the product_event_type is 1 which denotes process creation. The command_line is just looking for the string "whoami". Notice the $selection variable in front of each field.
The last piece is the condition section which is just looking for the events, in this case called $selection. If you see an event that matches the two conditions in the event section, the rule fires.
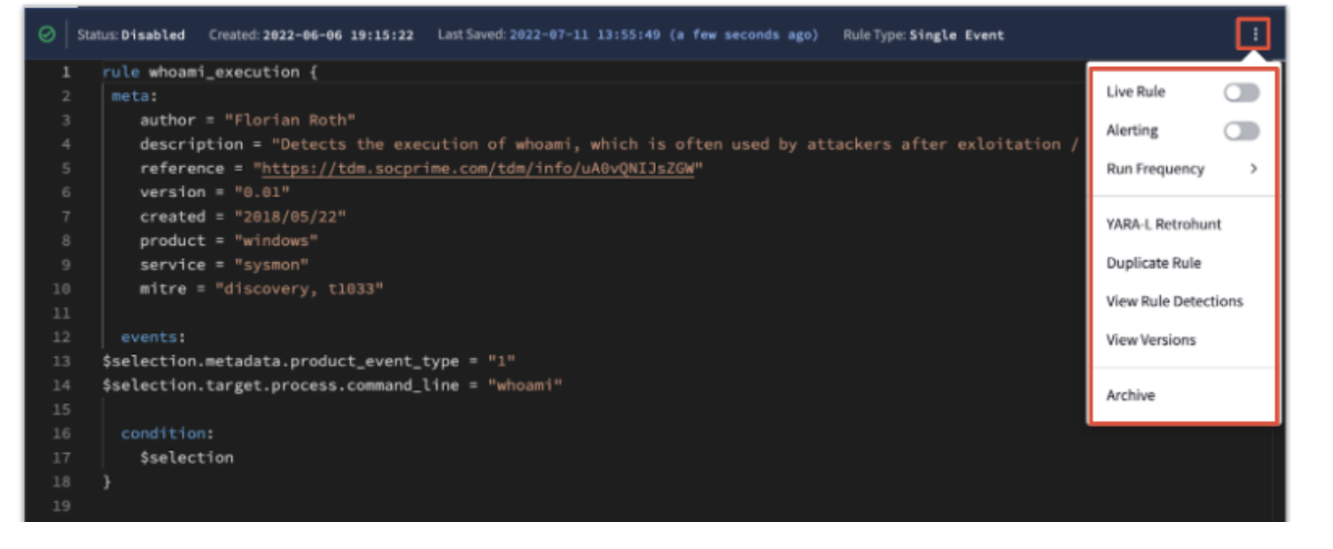
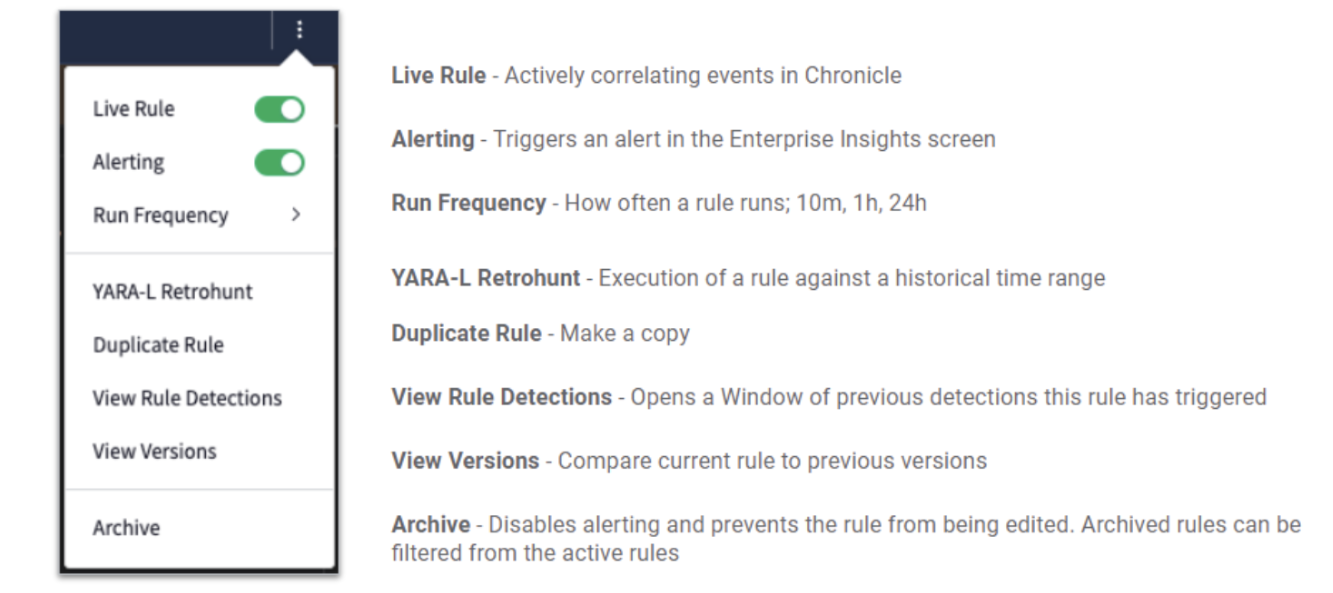
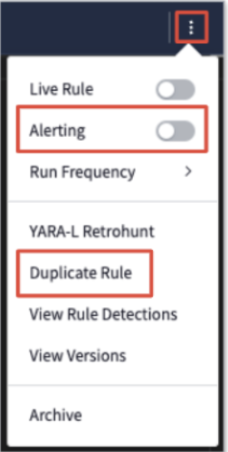
On the far right side of the screen, you will see three dots. Click on the dots and you will have a listing of options that can be applied to this rule. Let’s walk through these options briefly.
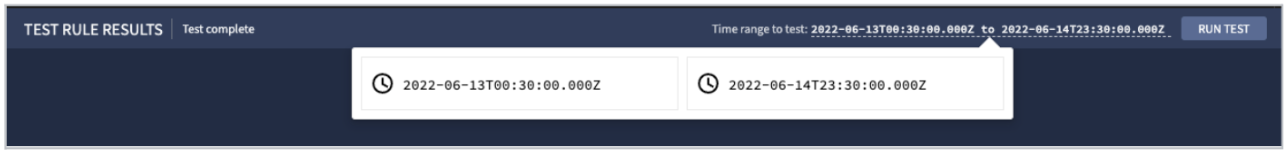
At the bottom of the rule editor is the test rule capability. Using this is considered a best practice when building rules because it runs very quickly against a time window to give you feedback on the criteria of the rule you are creating or modifying. The other nice thing about this is that even if the alert flag is switched on, the test rule functionality will not create alerts. If running a retrohunt alerts would be created. The test rule functionality can only run against a maximum of a two week interval of data. A retrohunt, on the other hand, can hunt against a much wider timeframe.
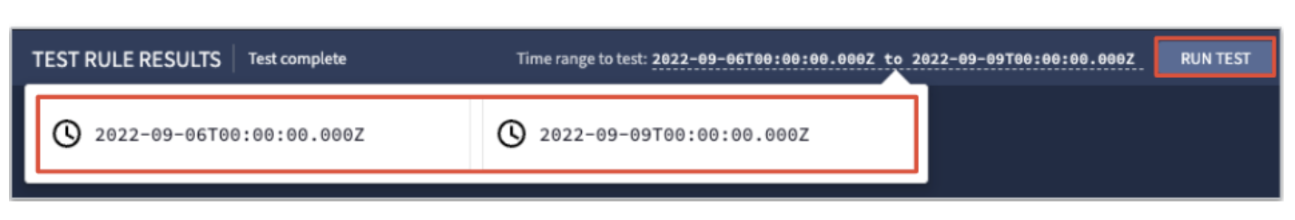
If you would like to test this rule, go ahead and set the time range to the past three days and click Run Test.
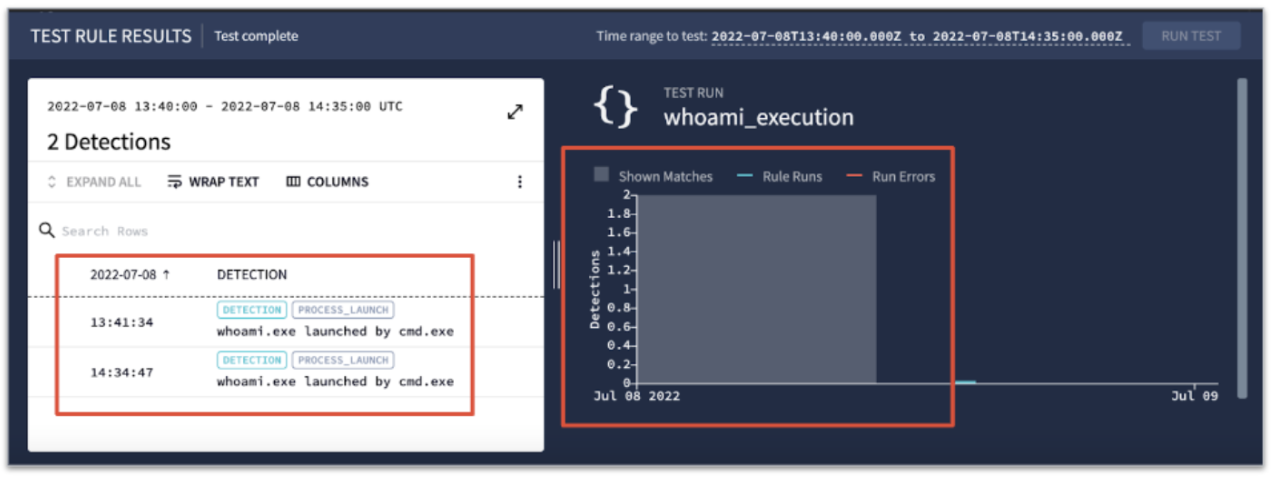
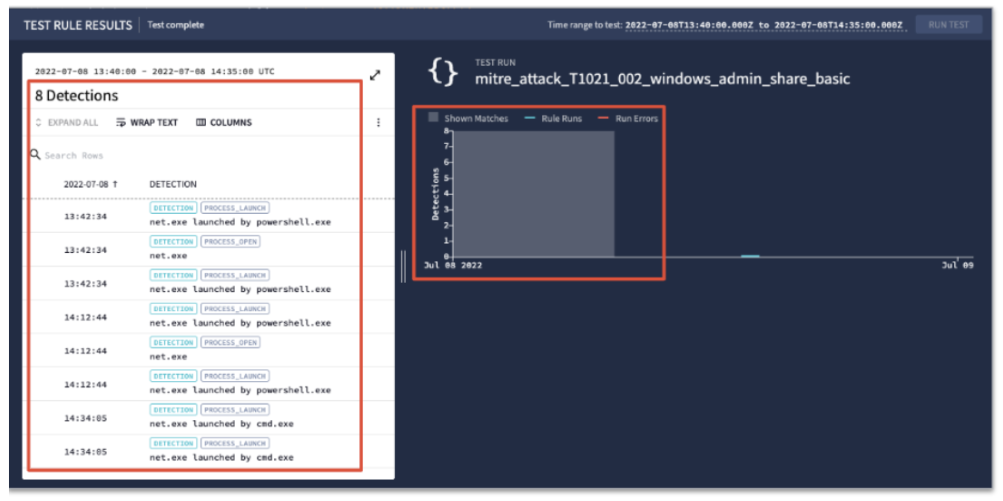
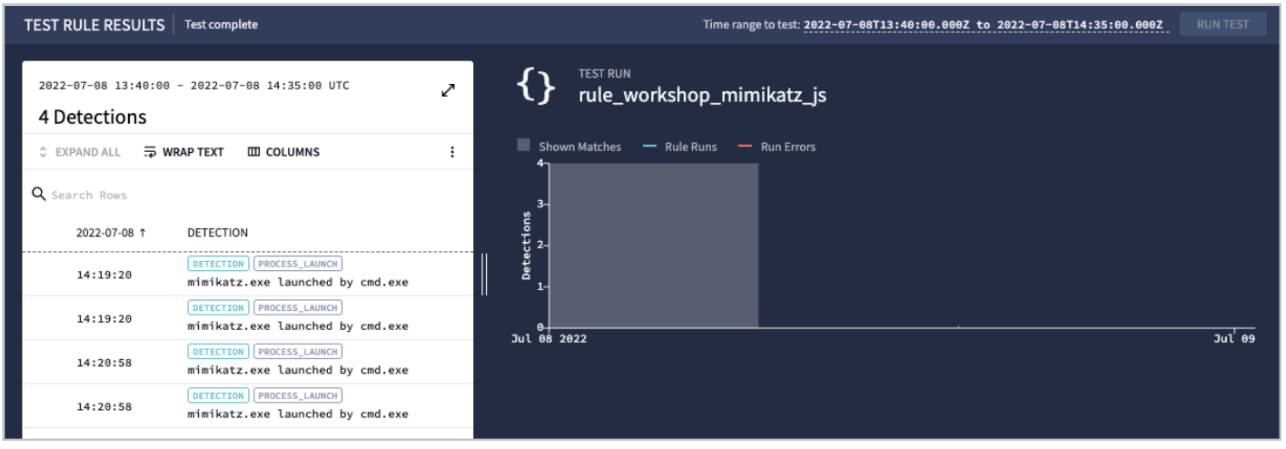
Here are the results from a test run.
On the left side of the screen, you get a listing of detections and to the right a bar chart with the date the events were seen. Notice in the detection section on the left side (the section in white), that you can click on the double-headed arrow to expand the section, you can wrap text, add columns and more. This capability isn’t unique to test rules, in fact you will see this elsewhere and it will be used a bit later.
Now let's move a little further into the event section and move away from just simple string matching across an entire field.
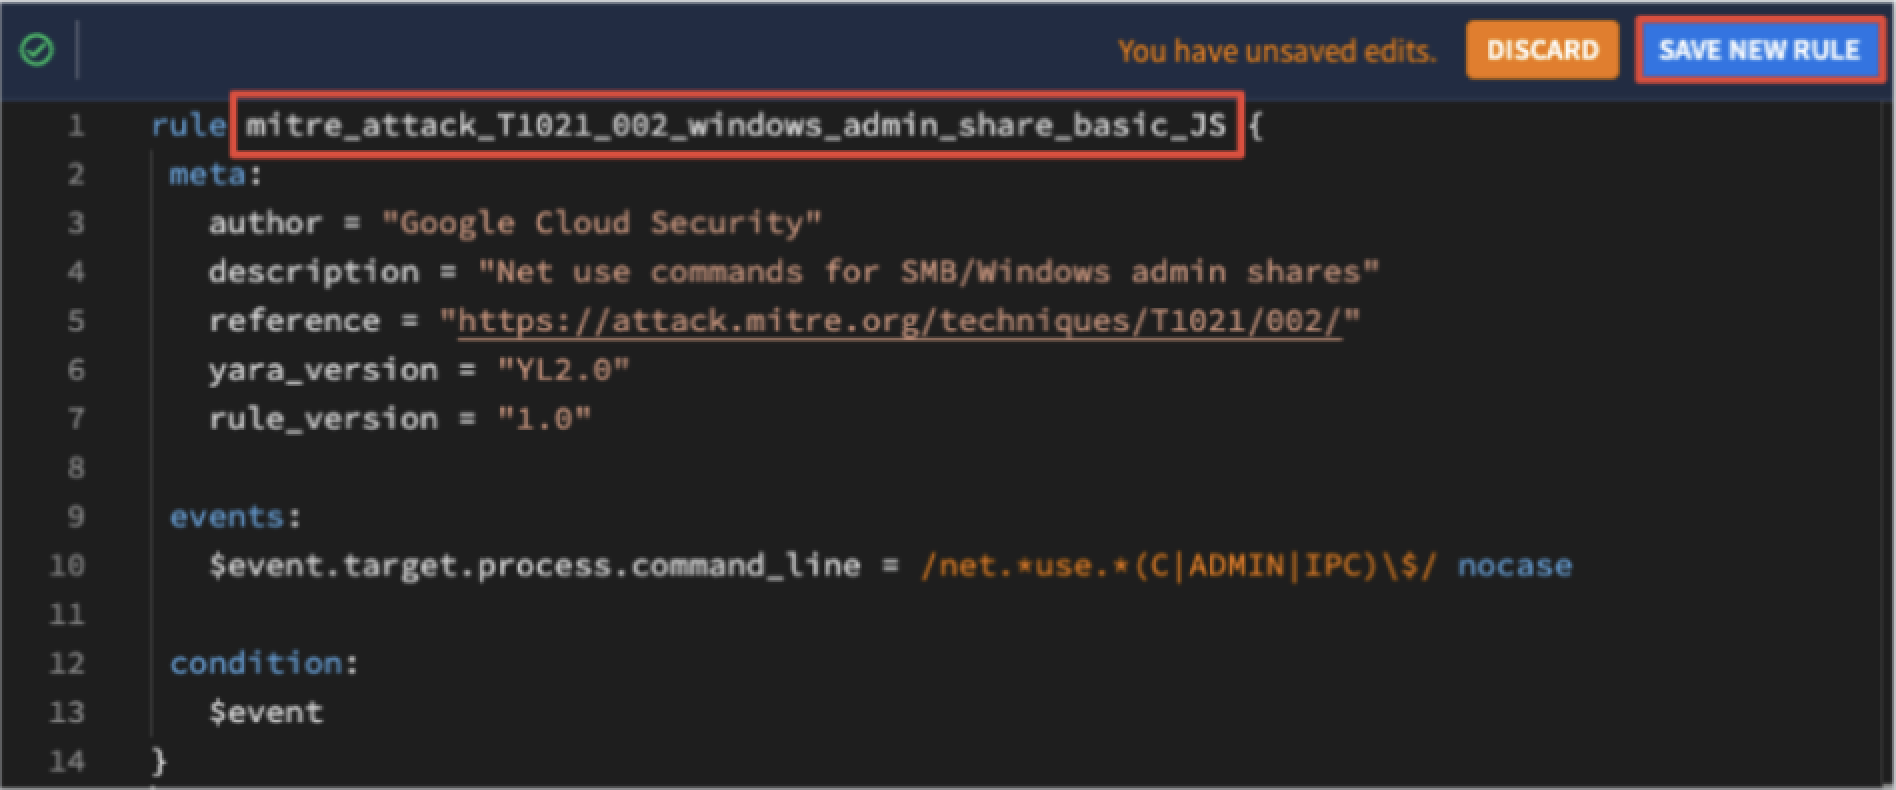
In the below example rule, you are looking at a MITRE ATTACK technique around establishing a windows admin share. The event criteria here is similar to the first example in the sense that you are looking for an event with a target.process.command_line of some value. However in this case, you are going to have some variance that will need to be accounted for. You want your newly created rule to fire anytime a "net use" command is executed looking for c$, admin$ or ipc$. You could use "or" statements but the problem complexity grows when an adversary specifies a specific drive letter in this command, which would create a number of permutations when combined with the three different shares. That would create a pretty big "or" statement. To complicate matters, Windows commands like "net" can sometimes have extra spaces in between the commands and a string match would also need to account for those spaces. To address these challenges, you can use regex to handle this nicely, using the syntax below:
.* between the commands. Because you are looking for either "C", "ADMIN", or "IPC", you can group those three variables and put a pipe (regular expression or statement) between each. Finally, you are looking for a dollar sign after one of those three terms but because the dollar sign has special meaning in regular expressions, you need to prepend it with an escape character, the backslash \</code> , so that Chronicle knows to treat the dollar sign as a literal dollar sign rather than denoting the end of a line. You can close the regular expression with a forward slash. Adversaries can try to be tricky by mixing capitalization with lower case, in order to account for that you add the nocase modifier to the end of your search.
For your first exercise, find the rule listed here and make a copy of it. Append your initials, or a unique identifier, to it so that each person is working on their own version of the rule and click Save New Rule. You are going to come back to this rule in a future exercise so make sure you can find it later.
You should have found the rule you wanted to work with and clicked in the top right corner of the rule, making sure Alerting was turned off and clicked Duplicate Rule.
The rule you created is editable and you would have modified the rule name to add your initials, date, and any other identifying information. You should have also noticed a "Discard" button and a "Save New Rule" button as well as a note about unsaved edits.
With your newly created Rule, you should have set the test time range and clicked Run Test.
You then should see that you have detections, as well as a bar graph displaying the detections over time.
You can combine regular expressions and strings from UDM fields into a single event.
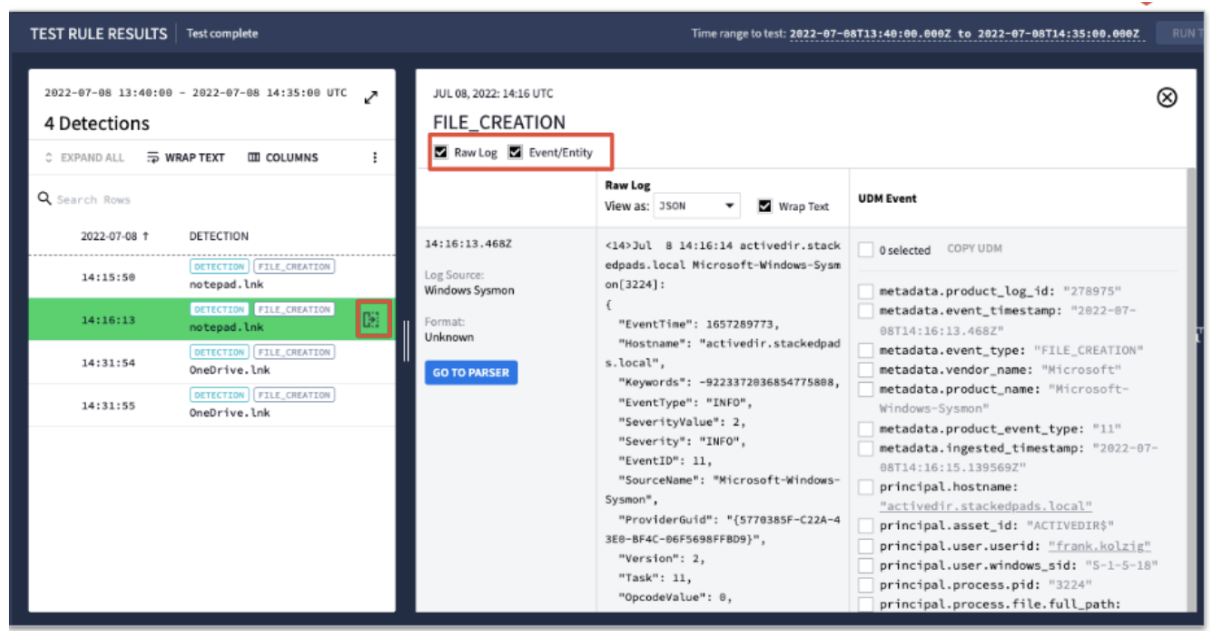
When you run the test rule, you should see the results below. One thing that has not been mentioned yet is the ability to get more detail from the detection. You will be adding columns to your detection in a bit, but for now here is a way to take a quick look at the raw log and UDM event from the detection itself.
You should now have a good idea of how to navigate the rules editor interface, modify rules, and use events to build criteria for rules.
metadata.product_event_type = "1"metadata.description = "4688"metadata.event_type can address both of these codes
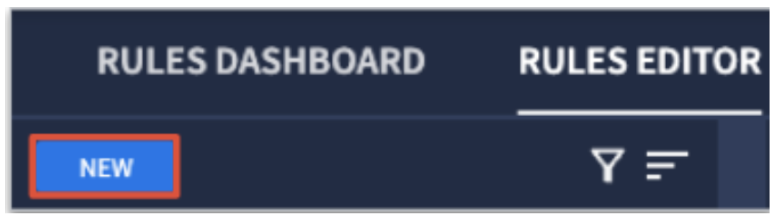
metadata.event_type = "PROCESS_LAUNCH"target.process.command_line is where we want to look for mimikatz for this exercise.You should have started off in the rules editor and clicked new to create a new rule.
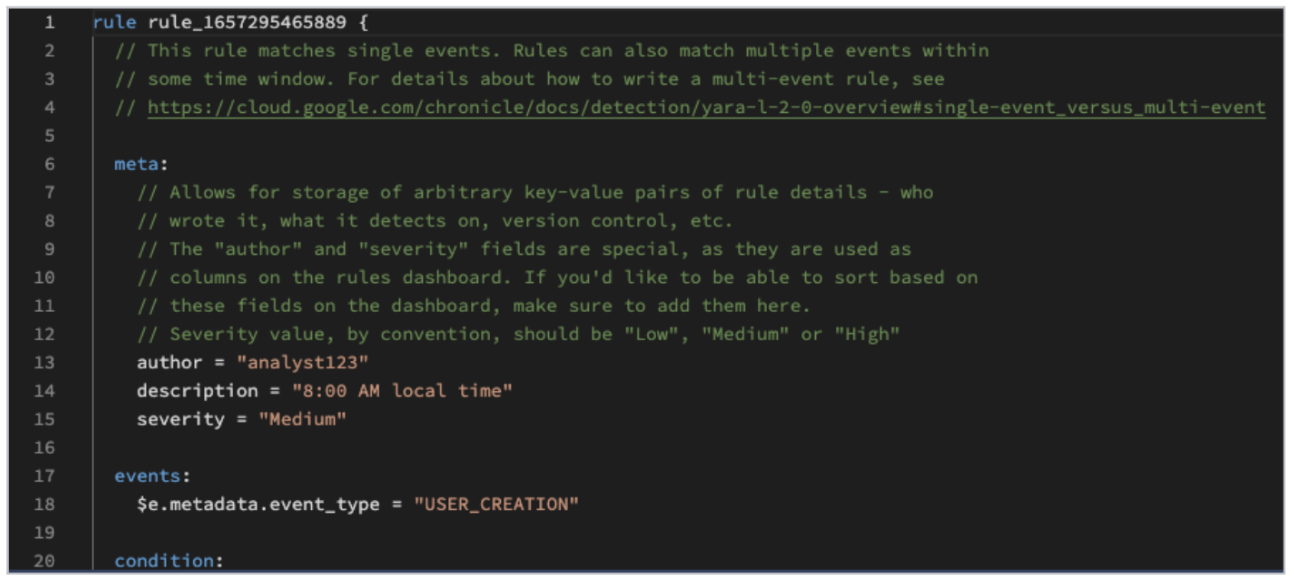
Chronicle gives you a template to get you started complete with the three key sections needed for a single rule. Notice the commented information. As you are building rules, using // to comment out a component of search criteria to test can be very useful. Also notice the guidance around "author" and "severity" in the "meta" section and how you can add additional values if you would like.
There are a few different strategies that can be used to explore your events as you build your rule. In this exercise, you were provided the field names because not everyone may be familiar with UDM fields. You could have created a basic rule that just looked at the metadata.event_type or metadata.product_event_type values, tested test and then looked at your results and the underlying fields and tuned from there.
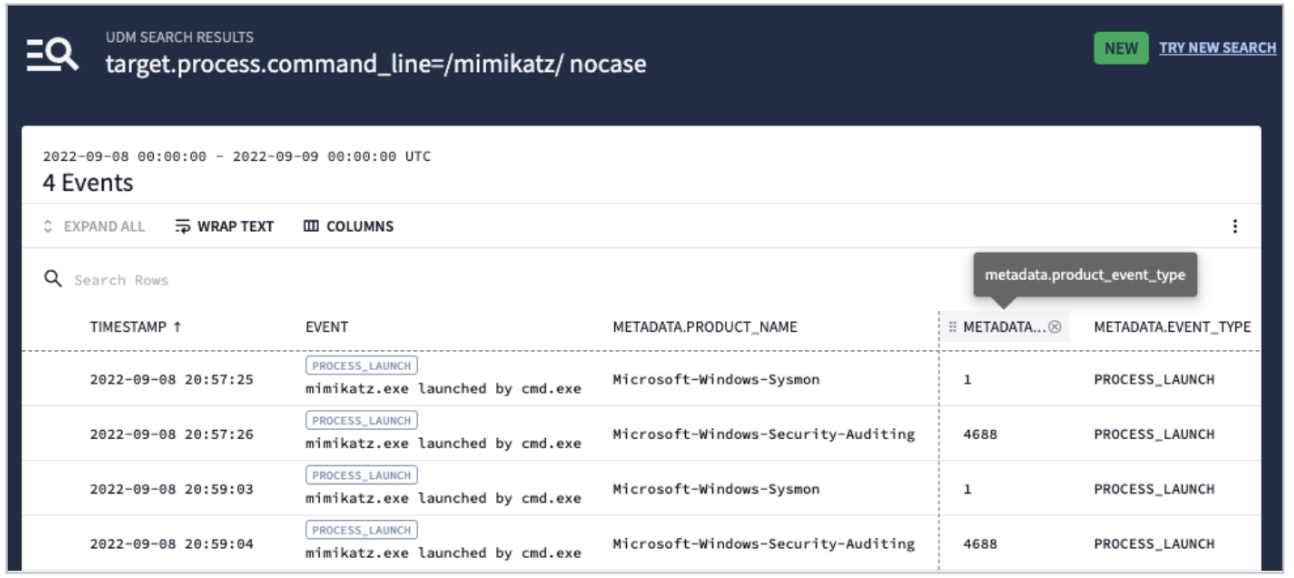
Another approach is to use the raw scan or the UDM search and explore the data to identify fields and values of interest. You can see the event type is the same and is a process_launch and the target.process.command_line contains mimikatz so that looks like a good place to start. Note that when using a regex search, you do NOT need to include anything to handle leading or trailing characters in the string.
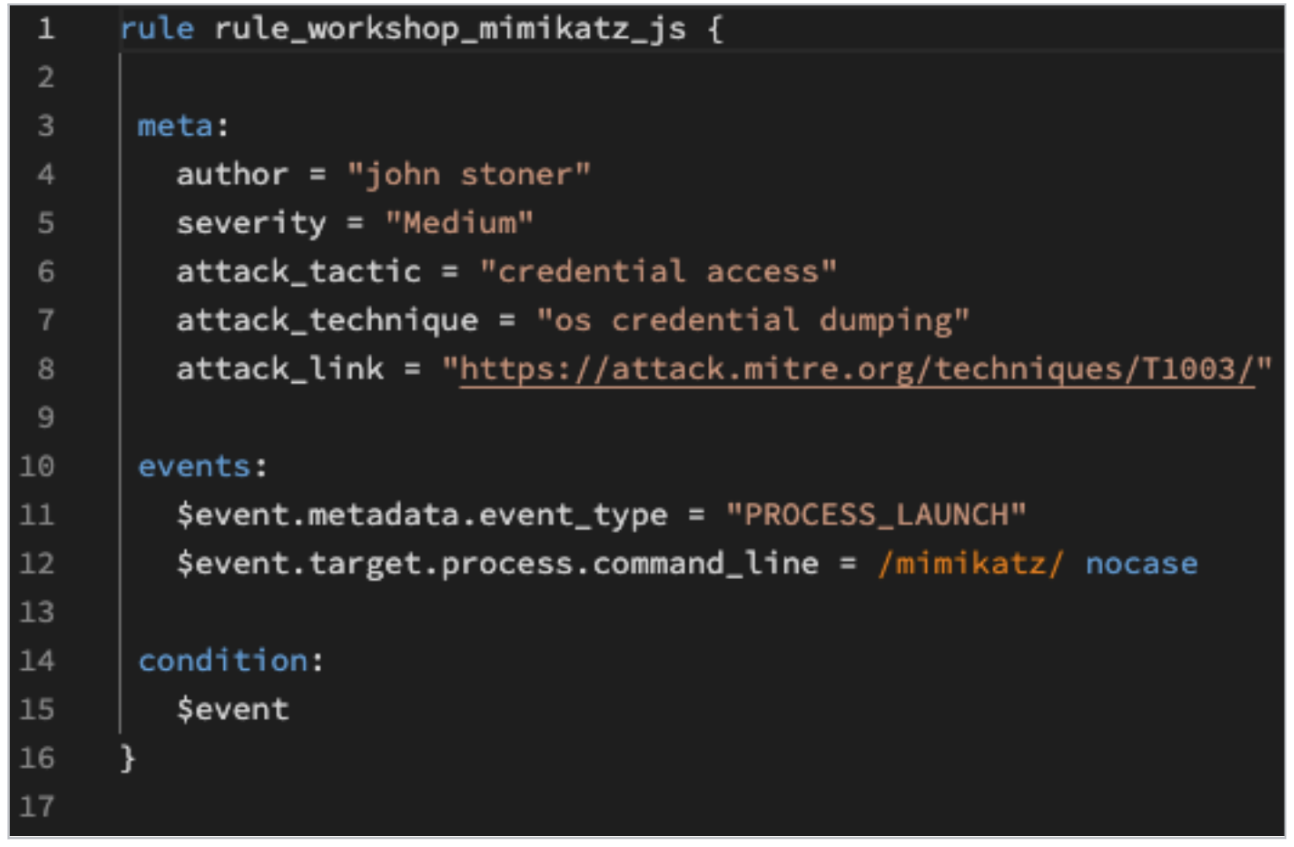
Here is the rule based on the event type and the command line values that were uncovered.
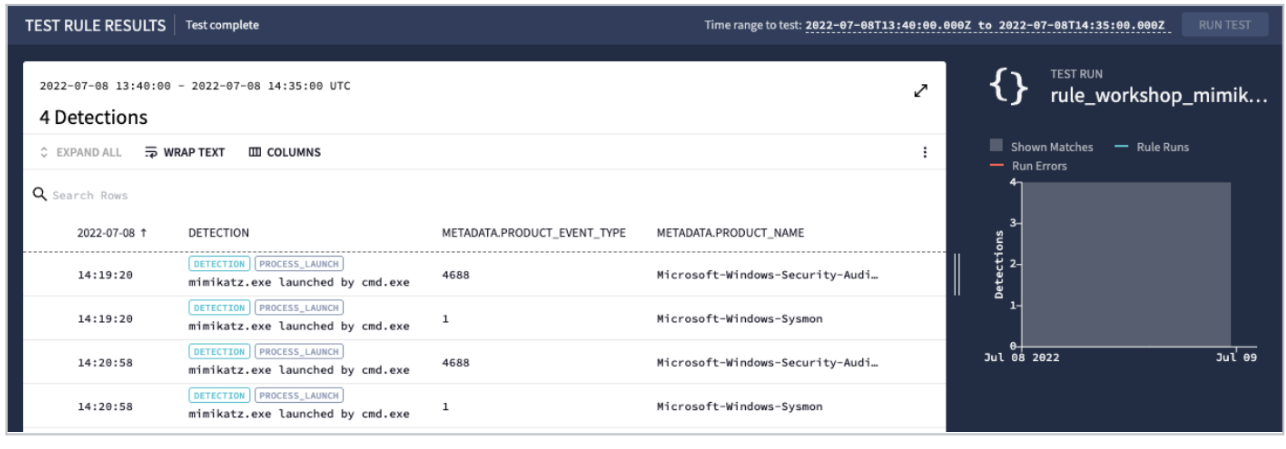
When you test the rule, there are multiple detections returned. You may want to hypothesize why there are two detections occurring at the exact same time.
You can see that with the metadata.event_type of PROCESS_LAUNCH, there are actually two distinct event codes in your data set that trigger on this, Windows Event code 4688 and Sysmon Event code 1. That’s not a bad thing, in fact it’s a good thing to know that you don’t have to worry about the details of a specific vendor code to find process launches. It is useful to have all events that are associated with a single process launch under a single detection. This way you can see mimikatz ran and that there are the multiple sources that saw this occur.
You now have a solid understanding of rule writing basics when using Chronicle.
Manual Last Updated January 20, 2025
Lab Last Tested January 20, 2025
Copyright 2025 Google LLC All rights reserved. Google and the Google logo are trademarks of Google LLC. All other company and product names may be trademarks of the respective companies with which they are associated.


This content is not currently available
We will notify you via email when it becomes available

Great!
We will contact you via email if it becomes available

One lab at a time
Confirm to end all existing labs and start this one