

始める前に
- ラボでは、Google Cloud プロジェクトとリソースを一定の時間利用します
- ラボには時間制限があり、一時停止機能はありません。ラボを終了した場合は、最初からやり直す必要があります。
- 画面左上の [ラボを開始] をクリックして開始します
Verify MC discovery client was created and activated.
/ 25
Verify collection is configured and data is transmitted to Migration Center.
/ 25
Verify AWS file was imported successfully.
/ 25
Verify Inventory TCO report has been generated.
/ 25
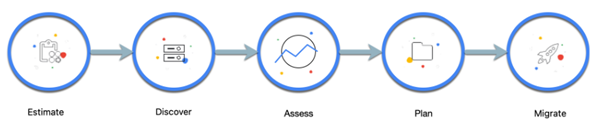
In this hands-on lab you'll learn how to assess a customer's existing environment and import data collected from Azure/AWS infrastructure. You'll generate inventory, Performance and Network Dependencies reports as well as financial reports such as TCO and Licenses reports.
Read these instructions. Labs are timed and you cannot pause them. The timer, which starts when you click Start Lab, shows how long Google Cloud resources are made available to you.
This hands-on lab lets you do the lab activities in a real cloud environment, not in a simulation or demo environment. It does so by giving you new, temporary credentials you use to sign in and access Google Cloud for the duration of the lab.
To complete this lab, you need:
Click the Start Lab button. If you need to pay for the lab, a dialog opens for you to select your payment method. On the left is the Lab Details pane with the following:
Click Open Google Cloud console (or right-click and select Open Link in Incognito Window if you are running the Chrome browser).
The lab spins up resources, and then opens another tab that shows the Sign in page.
Tip: Arrange the tabs in separate windows, side-by-side.
If necessary, copy the Username below and paste it into the Sign in dialog.
You can also find the Username in the Lab Details pane.
Click Next.
Copy the Password below and paste it into the Welcome dialog.
You can also find the Password in the Lab Details pane.
Click Next.
Click through the subsequent pages:
After a few moments, the Google Cloud console opens in this tab.

To begin, you will download and deploy the MC (Migration Center) discovery client in a simulated customer environment created for this purpose in Google Cloud.
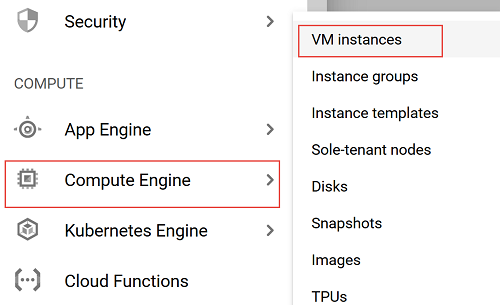
 ), select Compute Engine > VM instances.
If prompted, select the Google Cloud project assigned to your lab.
User name |
migrationcenter |
Password |
m1grat10nc#nt#r |
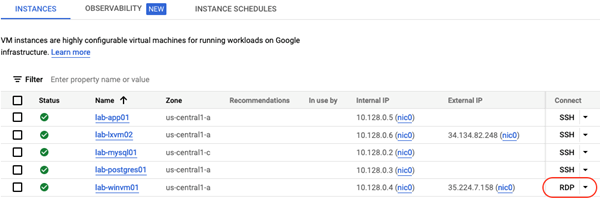
In this section, you will access Migration Center Assessments. Perform all the following steps from the RDP session.
Open Chrome browser installed on the Windows system you connected to.
Browse to the following url to login to Google Cloud:
Authorize with the same lab user that was used in the previous section. User details can be found in the overview, steps 3 to 5 or in the left panel of the Qwiklab.
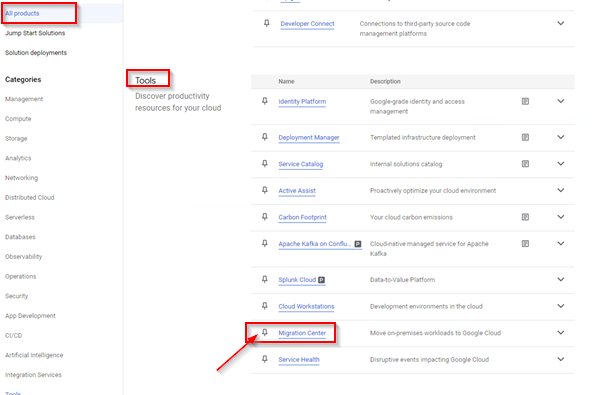
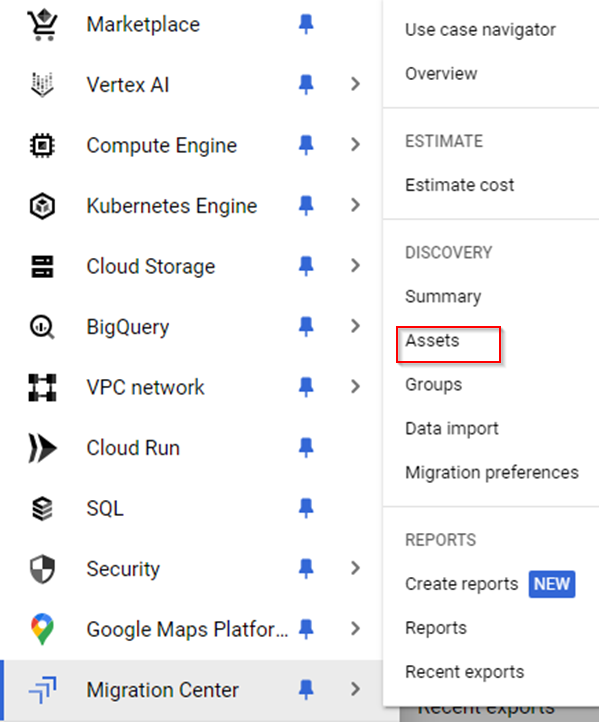
After login is done and GCP console opened, from the Navigation menu, click View All Products at the bottom of the panel, to open a list of all products.
Scroll down to the Tools section and click on the Pin icon next to Migration Center to add it to the Pinned menu section for quick access.
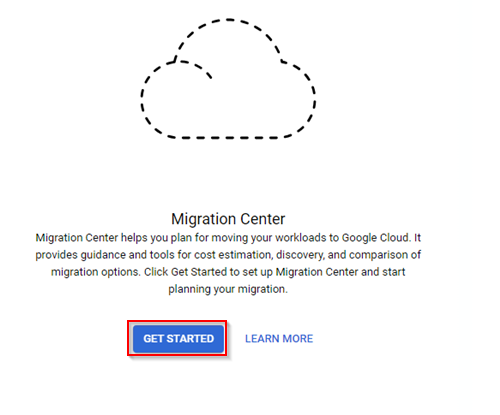
Click the Migration Center menu option.
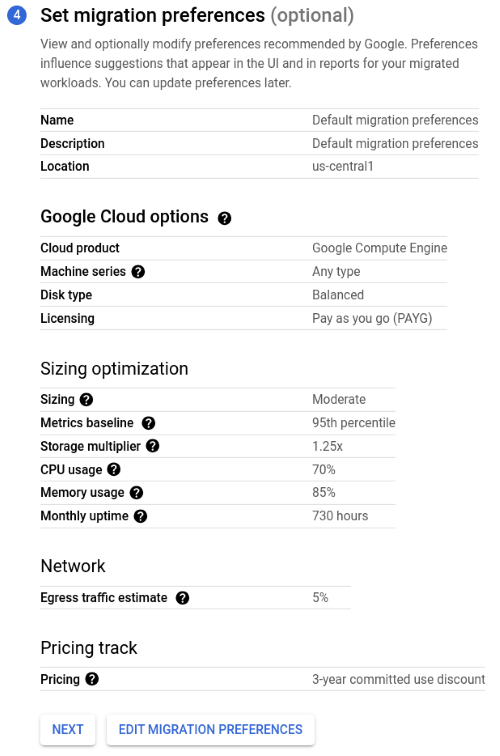
NOTE: When accessing Migration Center for the first time you will be prompted to set some default values.
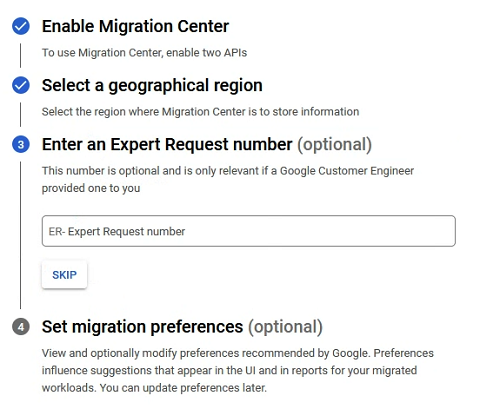
Click the Enable button in order to enable the required, but yet not enabled APIs.
When prompted, select
Click Skip on the Enter an Expert Request number prompt.
Click Continue.
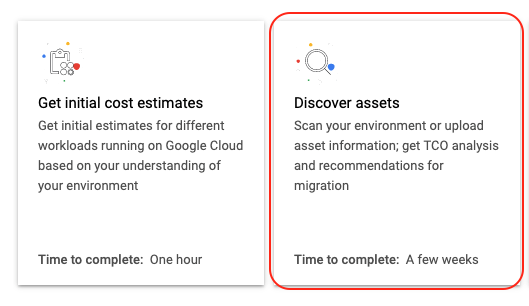
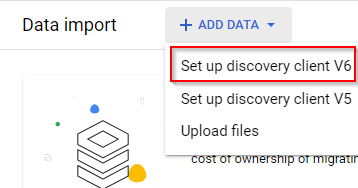
From the Migration Center overview dashboard click Discover Assets.
Wait for the download to complete.
Run the Migration Center Discovery Client V6 installer (mcdc.msi).
Click Yes when prompted to confirm permitting changes to the system.
Review and accept the license agreement.
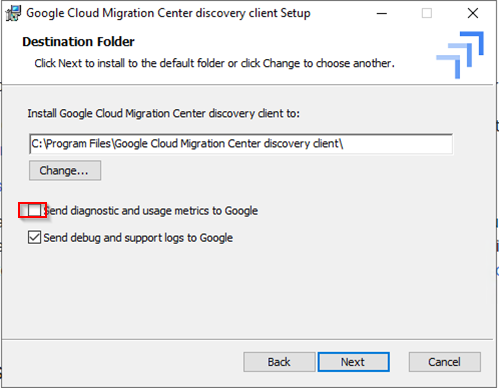
Uncheck the Send diagnostics and usage metrics to Google and click Next.
Once the installation has completed, you will get a popup for restart confirmation. Confirm OS restart and login again using steps 8,9 and 10 from the Setup and requirements section. After login you will see a new application shortcut on your desktop.
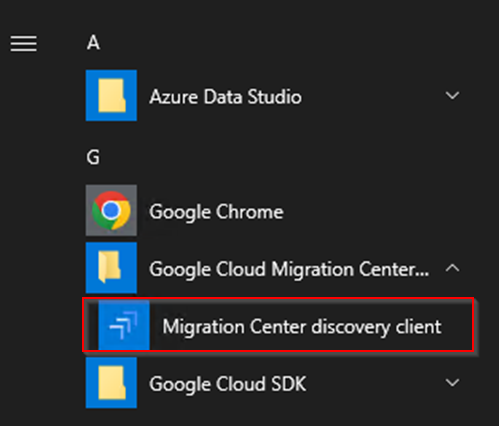
To run the Migration Center Discovery Client application, open the shortcut in the start menu.
When prompted to confirm user access control click Yes.
To start the login process, click Log in to Migration Center.
Connectivity check should be auto-completed and next step enabled.
Under Log in with Google, click Login with Google.
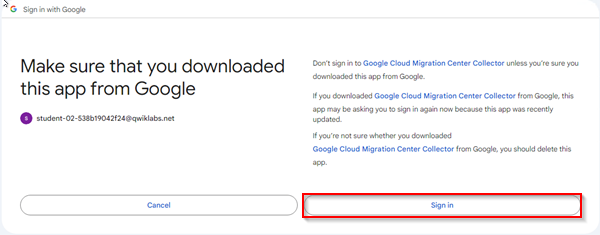
Follow the instructions on the screen, select the Google account assigned to the lab, then click Sign In on the next screen.
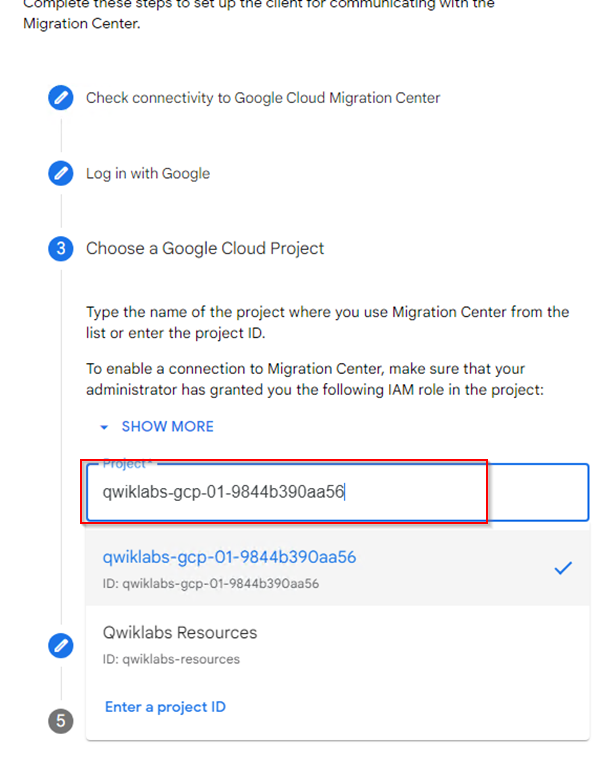
To proceed to the next step, click Continue.
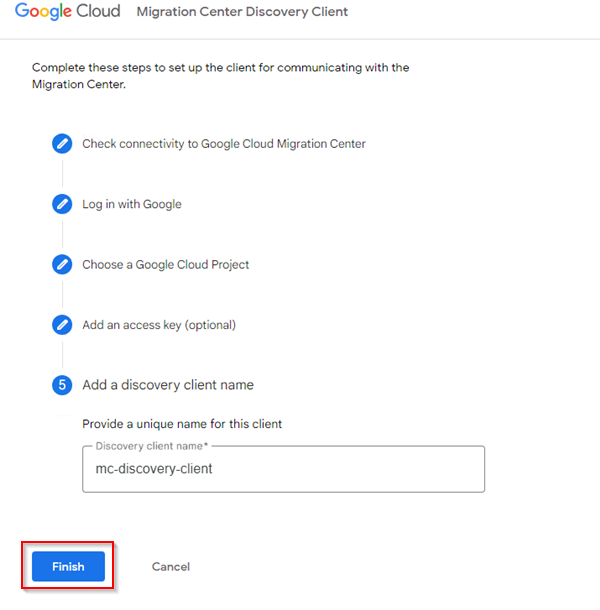
Click Continue under Add an access key .
Under Add a discovery client name, populate a name mc-discovery-client to your discovery client.
Note: The Migration Center Discovery client name can be any unique name, but for the sake of this lab, we want to use the fixed name mentioned above.
Click Check my progress to verify the objective.
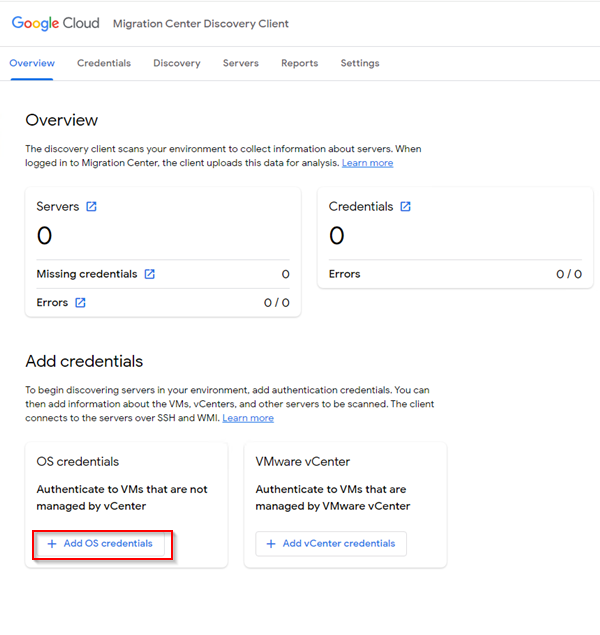
Once activation completes, the MC Discovery Client overview page will open.
Multiple credentials can be stored within MC Discovery Client to allow the collector to access systems belonging to different Active Directory domains, or having local accounts, or SSH keys.
Credential Name |
Lab |
Credential Type |
Username and Password |
Username |
migrationcenter |
Password |
m1grat10nc#nt#r |
You will also use user/key authentication to collect on some linux VMs.
Copy the downloaded file to the Windows system where MC Discovery Client is installed (Copy and paste the file using Remote Desktop session).
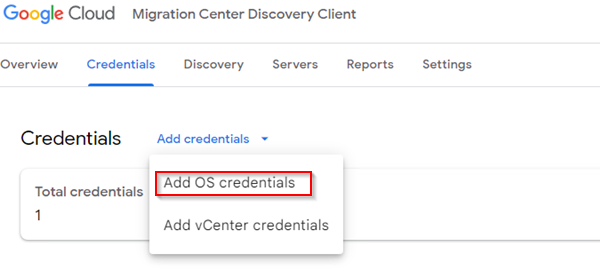
Click Add Credentials button.
Choose Add OS Credentials from the available types.
Credential Name |
Lab-key |
Credential Type |
SSH Key / Certificate (Linux Only) |
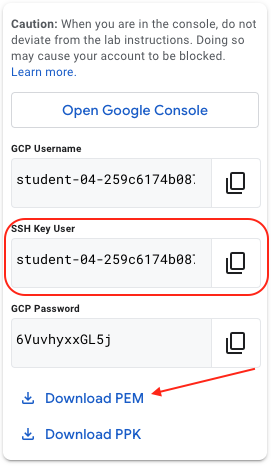
Username for this key |
Value from "SSH Key User" field in lab instructions (see top left panel) |
Click Browse key and certificate button and select the PEM file copied in step 6 |
Click the Save button.
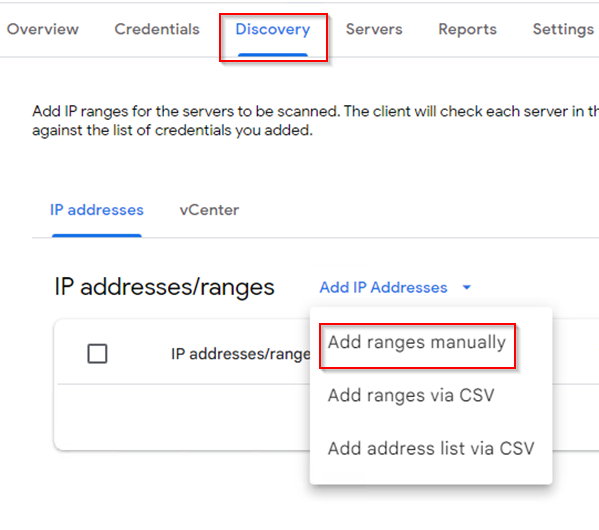
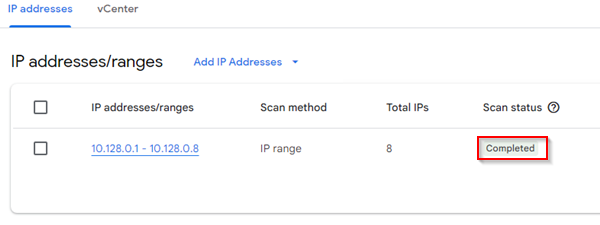
From the Discovery tab, click Add IP Addresses and select Add ranges manually from the dropdown.
IP address range scan allows for discovery of assets across the network.
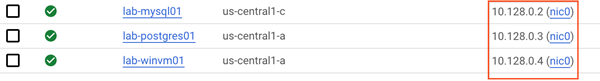
Important: Make a note of the Internal IP address configured for the lab VM Instances (e.g. 10.128.0.2). You will use the first three octets in the bulk scan.
For the beginning IP address, use the first three octets plus .1 (10.128.0.1 in this example). For the ending IP address, use the first three octets plus .8 (10.128.0.8 in this example).
Click the Save button.
This will start downloading of the file generated from the AWS account.
Decompress the downloaded zip file by right-clicking on it and selecting Extract ALL....
Click Extract.
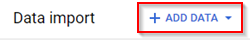
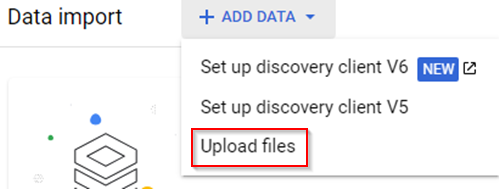
In Google Cloud, from the Navigation menu, select Migration Center and click on + Add Data button.
Select Upload files option.
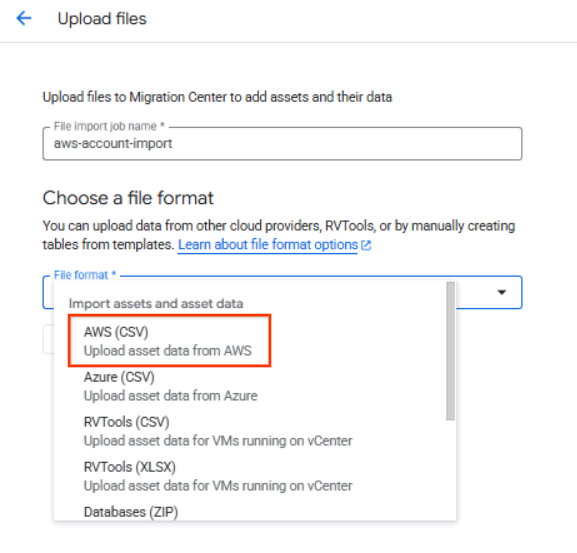
Enter aws-account-import into File import job name field.
From File format dropdown select AWS (CSV).
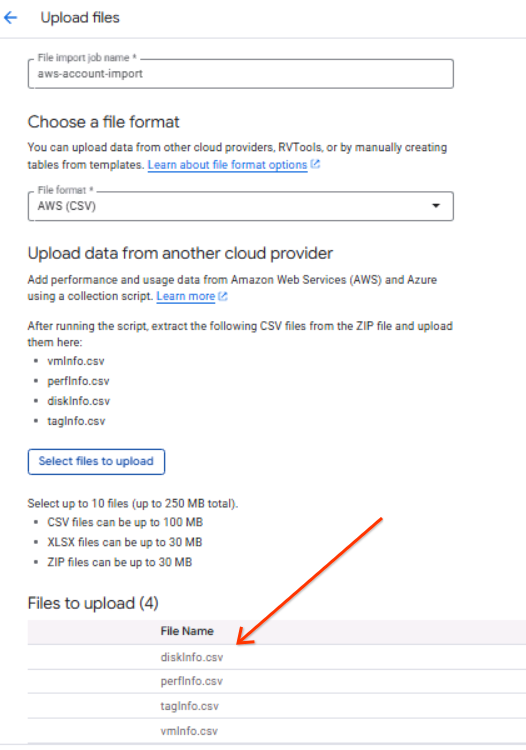
Click Select files to upload button.
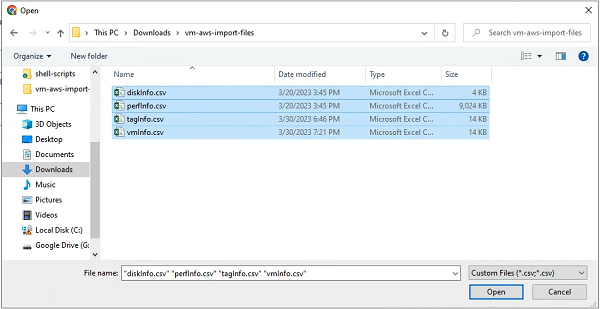
Navigate to the directory where the zip file was downloaded to (Default location: C:\Users\migrationcenter\Downloads\vm-aws-import-files).
Select all 4 files in the directory, click Open button. This will bring all selected files to the import page.
Click Upload Files.
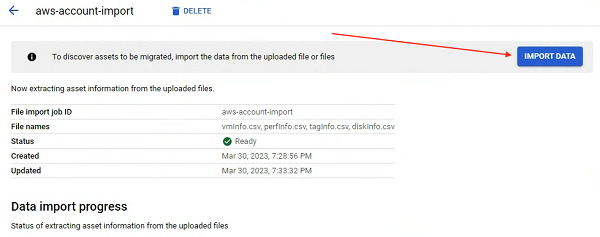
Once upload completes there should be a green check next to every file.
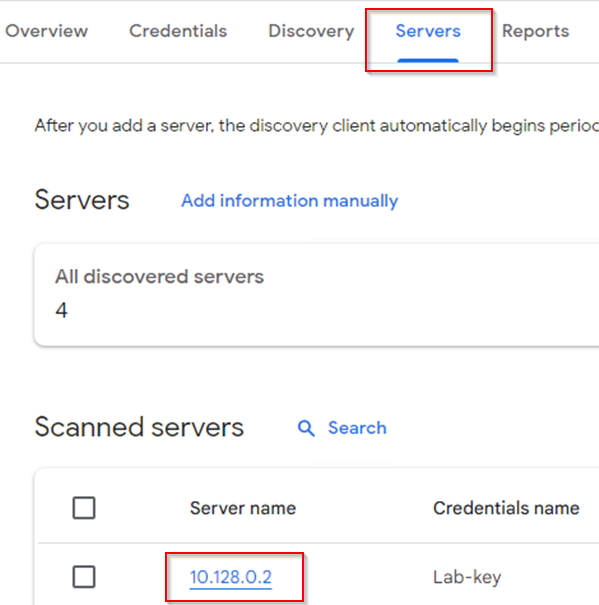
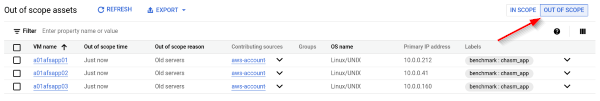
View list of collected assets.
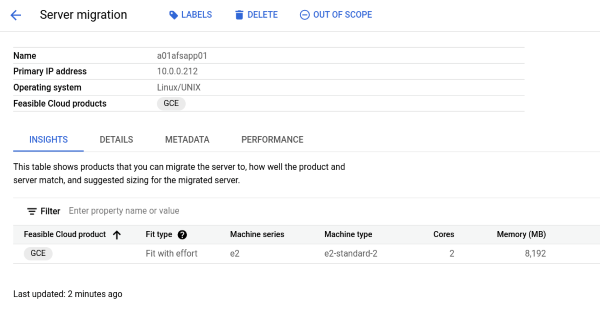
Click on the VM Name link of one of the assets in the list to view asset details.
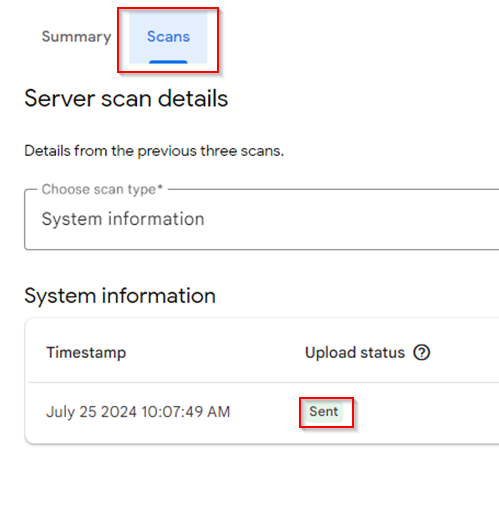
Switch between different tabs inside the asset details page to view more assets details such as Insights, Source VM Details, Metadata and Performance data.
Click the Back button to get back to the Assets list view.
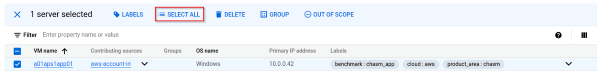
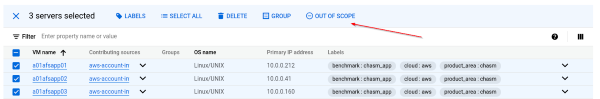
Select one or more assets to bring up the additional options like Select all button, for all available assets selection, based on applied filter.
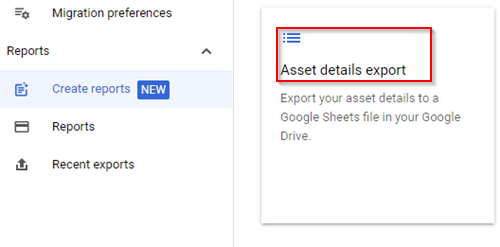
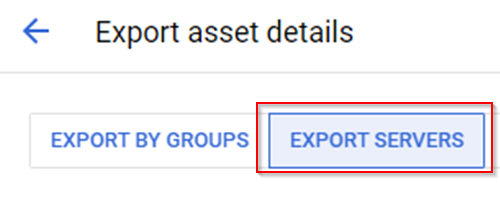
In the opened page, you have several ways to export assets details, by using a group with several servers or by exporting all Servers that were previously collected using MC Discovery Client or imported using file import option.
Click on the EXPORT SERVERS tab and then click the Export to CSV/Google Sheets button above the filter field.
At the popup window, click Export to Google Sheets to confirm and wait for the export to complete.
When export completed the OPEN spreadsheet link will become available, click it in order to view the exported report in Google Sheets.
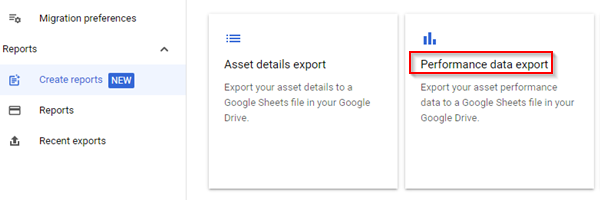
In order to generate a Performance Data report, at the Create Reports window, select Performance data export tile.
Similar to Assets Details Export, click on the EXPORT SERVERS tab and then click the Export to CSV/Google Sheets button above the filter field.
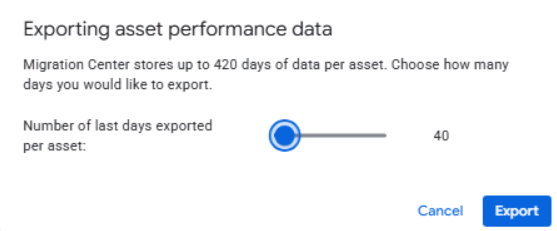
At the opened popup window, keep the same number of Days per assets and click on the Export button again. Wait for report generation.
At the popup window, click Export to Google Sheets to confirm.
Wait for export to complete. Once export is completed the OPEN spreadsheet link will become available. Click it to view the exported report in Google Sheets.
To generate a TCO report in the Migration Center, groups and migration preferences will have to be set.
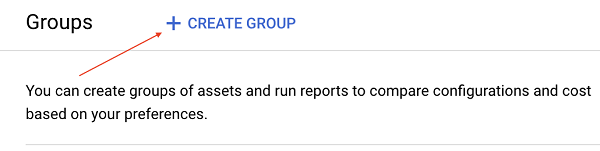
In Google Cloud, from the Navigation menu, select Migration Center and click on Groups sub-menu.
Click + Create Group.
Enter All Assets in the Group name field, Click Next.
From the list select all assets by clicking the check box next to VM name label.
Click the Create button.
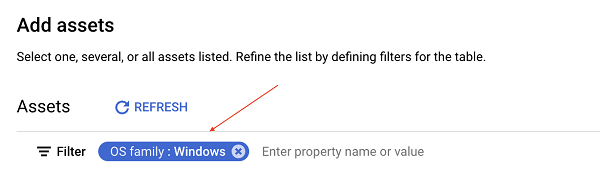
Repeat the steps above to create two more groups. Use filters to help selecting VMs.
| Group Name | Select criteria |
|---|---|
| windows-only | All VMs running Windows OS |
 |
|
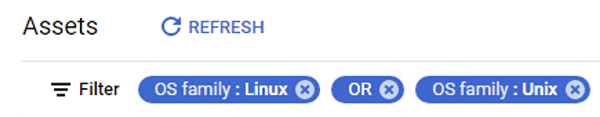
| linux-only | All VMs running Linux OS |
 |
|
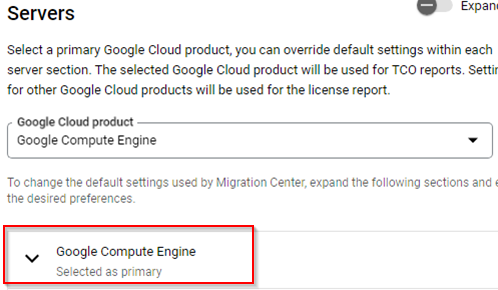
From the Navigation menu, select Migration Center and click on Migration preferences sub-menu.
Click + Create migration preferences button.
Populate aggressive-optimization-3-year-commit preference name at the dedicated field.
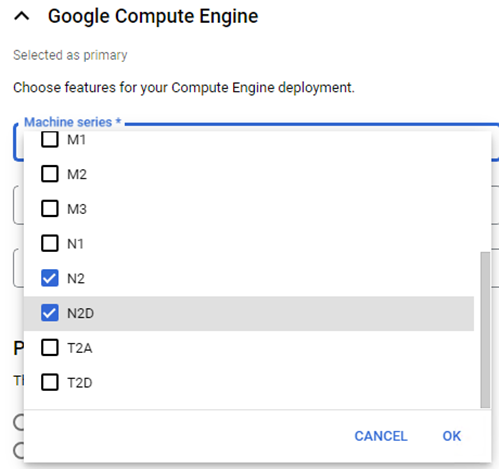
Expand Google Compute Engine section by clicking on it.
Repeat the above steps to create one more preference set using following values:
| Preferences name | moderate-optimization-1-year-commit |
| Machine series | C2, C2D |
| Disk type | SSD persistent disk |
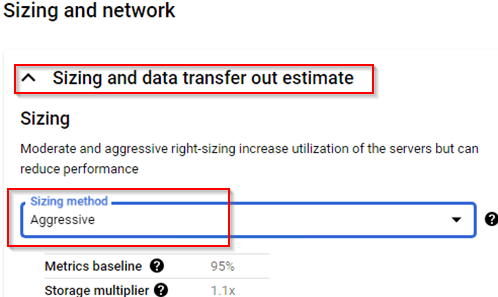
| Sizing method | Moderate |
| Product pricing track | 1-year resource-based committed use discount (USD) |
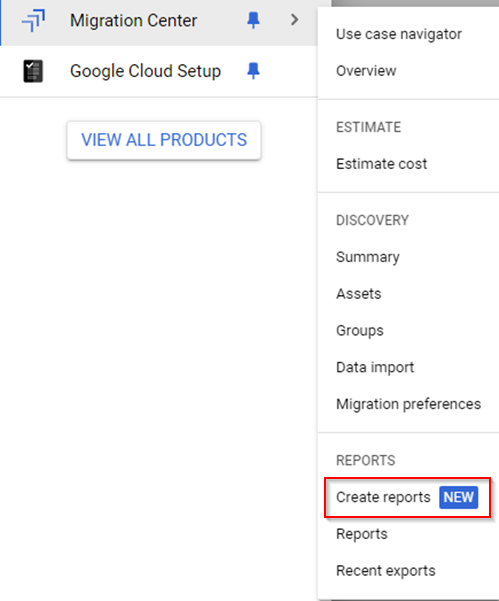
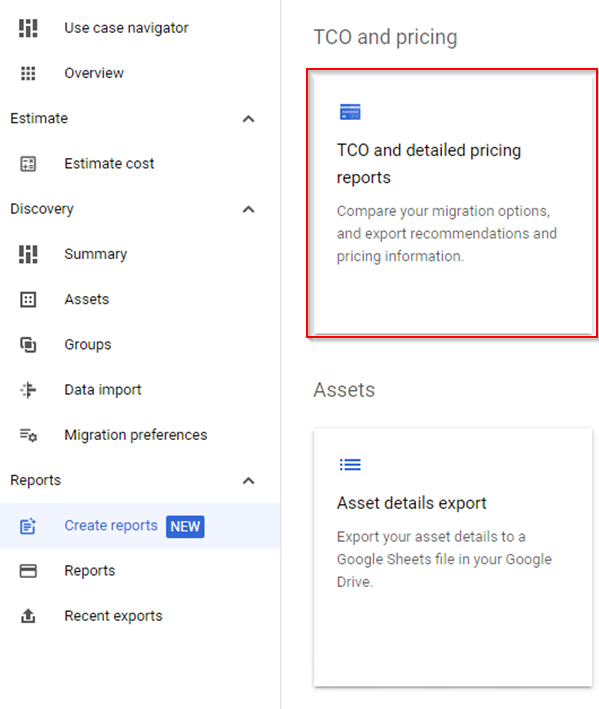
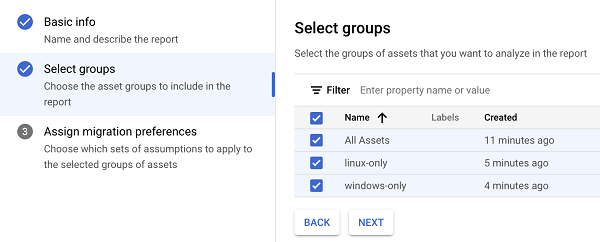
From the Navigation menu, select Migration Center and click on Create Reports sub-menu. Select TCO and detailed pricing report tile.
Enter lab-tco-report for report name, click Next.
Select All-assets, windows-only and linux-only groups, click Next.
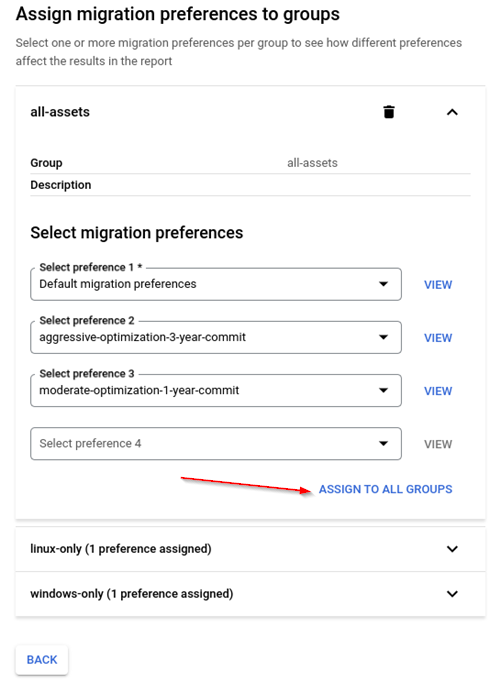
Click the down arrow on the all-assets group to show assigned preferences.
Select aggressive-optimization-3-year-commit from dropdown for preference 2.
Select moderate-optimization-1-year-commit from dropdown for preference 3.
Click Assign to all groups.
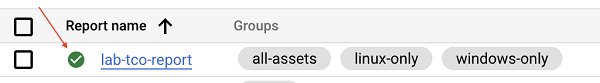
Click Generate Report.
Report can take up to 5 min to generate. Green checkbox indicates that the report is ready to view.
Click the report name to view details.
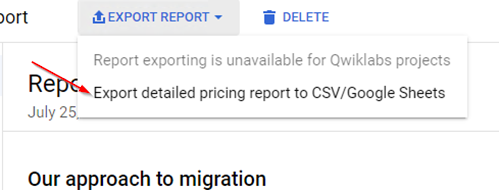
To export a Detailed Pricing Report go to EXPORT REPORT option and select Export detailed pricing report to CSV/Google Sheets option.
NOTE: Both TCO and Detailed Pricing report have an export to Google Slides and Google Sheets options correspondigly, however export to Google slides feature is not available in the lab.
Select Network Dependencies Export tile.
Similar to Inventory and Performance data reports, you have an option to export a report for a group of assets.
In the opened GROUPS tab, select all groups that were previously created at Task 8.
Click on the Export to CSV button at the bottom of the screen.
At the opened popup window, click Export button and wait for report generation.
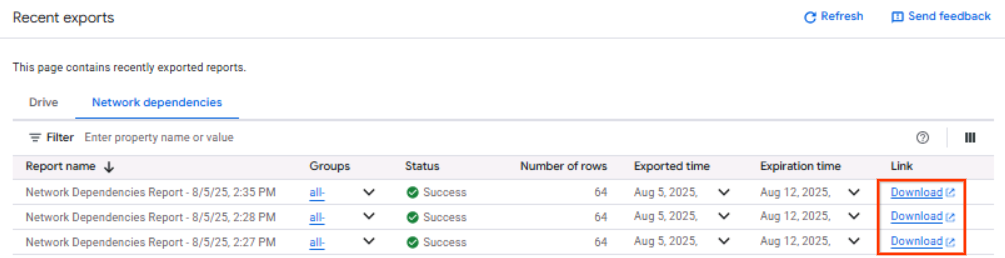
Click the Download button in order to download the generated Network Dependencies Report in CSV format.
You've successfully collected and analyzed the deployed infrastructure using the Migration Center.
To learn more about Migration Center, refer to the Migration Center Documentation.
...helps you make the most of Google Cloud technologies. Our classes include technical skills and best practices to help you get up to speed quickly and continue your learning journey. We offer fundamental to advanced level training, with on-demand, live, and virtual options to suit your busy schedule. Certifications help you validate and prove your skill and expertise in Google Cloud technologies.
Manual Last Updated August 07, 2025
Lab Last Tested August 07, 2025
Copyright 2025 Google LLC. All rights reserved. Google and the Google logo are trademarks of Google LLC. All other company and product names may be trademarks of the respective companies with which they are associated.


このコンテンツは現在ご利用いただけません
利用可能になりましたら、メールでお知らせいたします

ありがとうございます。
利用可能になりましたら、メールでご連絡いたします

1 回に 1 つのラボ
既存のラボをすべて終了して、このラボを開始することを確認してください