This lab was developed with our partner, Datadog. Your personal information may be shared with Datadog, the lab sponsor, if you have opted-in to receive product updates, announcements, and offers in your Account Profile.
GSP1168
Overview
Eventarc makes it easy to connect Google Cloud services with events from a variety of sources. It allows you to build event-driven architectures in which microservices are loosely coupled and distributed. It also takes care of event ingestion, delivery, security, authorization, and error-handling for you which improves developer agility and application resilience.
Datadog is a monitoring and security platform for cloud applications. It brings together end-to-end traces, metrics, and logs to make your applications, infrastructure, and third-party services observable.
Objectives
In this lab you will learn about using the Helm chart used to install the Datadog Agent. You will learn to:
Discover the Datadog provider.
Set up a channel to the Datadog provider.
Create a workflow to log events.
Create an Eventarc trigger with the channel.
Create a Datadog monitor.
Test the Datadog monitor, Eventarc trigger and the workflow.
Enable Datadog's Google Cloud integration.
Create a workflow to check Compute Engine VMs.
Connect Datadog monitoring alerts to Workflows with Eventarc.
Create a Datadog monitor and alert on VM deletions.
Setup and Requirements
Before you click the Start Lab button
Read these instructions. Labs are timed and you cannot pause them. The timer, which starts when you click Start Lab, shows how long Google Cloud resources will be made available to you.
This Qwiklabs hands-on lab lets you do the lab activities yourself in a real cloud environment, not in a simulation or demo environment. It does so by giving you new, temporary credentials that you use to sign in and access Google Cloud for the duration of the lab.
What you need
To complete this lab, you need:
Access to a standard internet browser (Chrome browser recommended).
Time to complete the lab.
Note: If you already have your own personal Google Cloud account or project, do not use it for this lab.
Note: If you are using a Pixelbook, open an Incognito window to run this lab.
How to start your lab and sign in to the Google Cloud Console
Click the Start Lab button. If you need to pay for the lab, a pop-up opens for you to select your payment method.
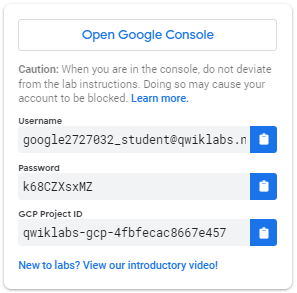
On the left is a panel populated with the temporary credentials that you must use for this lab.
Copy the username, and then click Open Google Console.
The lab spins up resources, and then opens another tab that shows the Sign in page.
Tip: Open the tabs in separate windows, side-by-side.
In the Sign in page, paste the username that you copied from the Connection Details panel. Then copy and paste the password.
Important: You must use the credentials from the Connection Details panel. Do not use your Qwiklabs credentials. If you have your own Google Cloud account, do not use it for this lab (avoids incurring charges).
Click through the subsequent pages:
Accept the terms and conditions.
Do not add recovery options or two-factor authentication (because this is a temporary account).
Do not sign up for free trials.
After a few moments, the Cloud Console opens in this tab.
Activate Cloud Shell
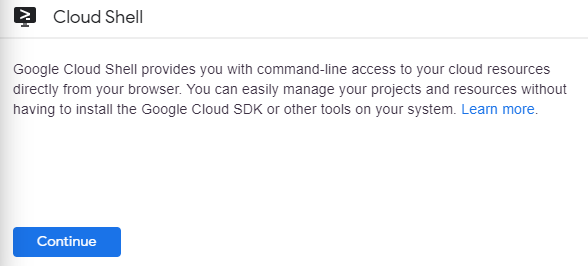
Cloud Shell is a virtual machine that is loaded with development tools. It offers a persistent 5GB home directory and runs on the Google Cloud. Cloud Shell provides command-line access to your Google Cloud resources.
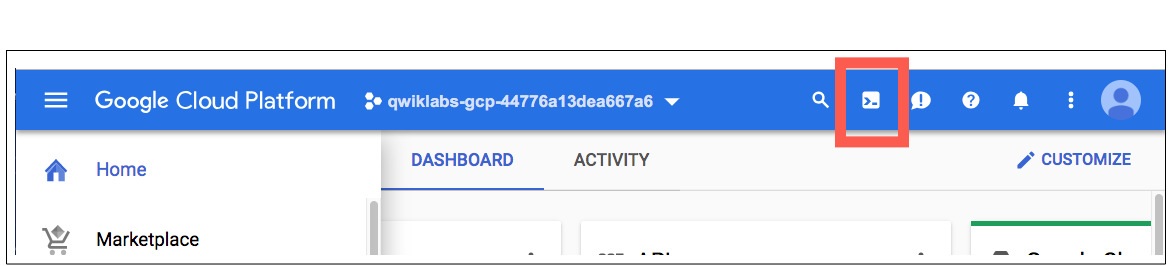
In the Cloud Console, in the top right toolbar, click the Activate Cloud Shell button.
Click Continue.
It takes a few moments to provision and connect to the environment. When you are connected, you are already authenticated, and the project is set to your PROJECT_ID. For example:
gcloud is the command-line tool for Google Cloud. It comes pre-installed on Cloud Shell and supports tab-completion.
You can list the active account name with this command:
In Cloud Shell, set your project ID and save it as the PROJECT_ID variable.
Also, set a REGION variable to the default region as described below. This is the region you will create resources in later.
PROJECT_ID={{{project_0.project_id|Project ID}}}
REGION={{{project_0.default_region|Default Region}}}
gcloud config set core/project $PROJECT_ID
Task2: Create Compute Engine VMs
You will start with some Compute Engine Virtual Machines (VMs). You will not be using them right away. Later in the lab you will use Datadog Google Cloud integration to monitor these VMs.
Click Check my progress to verify the objective.
Enable APIs
Task 4: Set up a Datadog Trial account
If you already have a trial account set up, you can use that. It is recommended that you do not use your production Datadog account to avoid cluttering the environment with test and training assets.
Navigate to https://us5.datadoghq.com/signup and enter your name, email, company, and a password. Make sure United States (US5-Central) is selected.
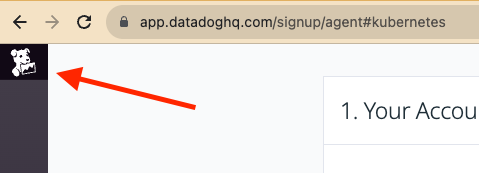
On the next page, close the Datadog sign up workflow by clicking on the Datadog icon.
Task 5: Discover the Datadog provider
An Eventarc provider is a service or entity that can emit events directly to Google Cloud which are then routed to your project. Third-party providers, such as Datadog, are non-Google Cloud providers that are integrated with Google Cloud through Eventarc.
In Cloud Shell, run the following command to see the list of Google Cloud and third-party providers:
gcloud eventarc providers list
This lists Google Cloud and third-party providers and the locations they are available in:
...
NAME: storage.googleapis.com
LOCATION: asia
NAME: cloudaudit.googleapis.com
LOCATION: asia
NAME: pubsub.googleapis.com
LOCATION: asia
...
You can narrow down the list to third-party providers with this command:
gcloud eventarc providers list --filter='eventTypes.type!~^google*'
You can also describe the Datadog provider to see the events it supports:
gcloud eventarc providers describe datadog --location $REGION
displayName: Datadog
eventTypes:
- filteringAttributes:
- attribute: monitor_id
description: The ID of the monitor that triggered the alert.
- attribute: alert_type
description: The type of the fired alert.
- attribute: info
description: Additionl information about the alert.
- attribute: msg_title
description: The title of the alert.
type: datadog.v1.alert
name: projects/qwiklabs-gcp-00-21fa5d7fc239/locations/us-central1/providers/datadog
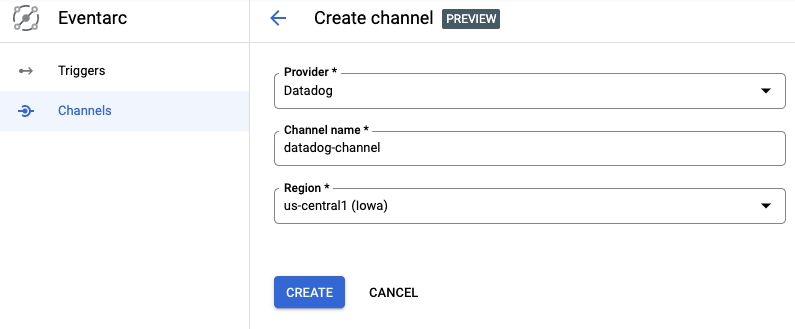
You need to set up a channel to integrate your project with a provider. This involves creating a channel, retrieving channel details and sending those details to the provider. Once the provider has initialized the connection to the channel, the provider can start sending events to your project.
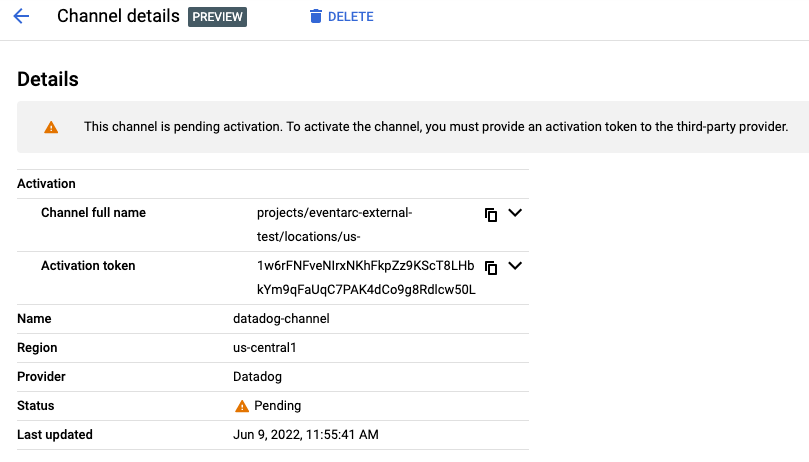
Similarly, you can see the channel from Google Cloud Console:
Note the channel full name and the activation token. You will need to send them to Datadog next.
The channel state indicates the channel's status. It can be one of the following:
PENDING—The channel has been created successfully and there is an activation token available to create a connection with the provider. To change the state of the channel from PENDING to ACTIVE, the token must be given to the provider and used to connect the channel within 24 hours of the channel's creation.
ACTIVE—The channel has been successfully connected with the provider. An ACTIVE channel is ready to receive and route events from the provider.
INACTIVE—The channel cannot receive events nor be reactivated. The provider is either disconnected from this channel or the channel activation token has expired and the provider isn't connected. To re-establish a connection with a provider, you must create a new channel for the provider.
An activation token is a single-use, time-restricted token, used to create a connection between a provider and a subscriber's project. Only a specific provider, selected during the channel creation process can use the token. The token is valid for 24 hours after the channel's creation. After 24 hours, the channel becomes INACTIVE.
Send channel details to the provider
You need to send the following channel details to the Datadog provider:
Channel name (eg. projects/qwiklabs-gcp-04-4e022c25f345/locations/us-east1/channels/datadog-channel)
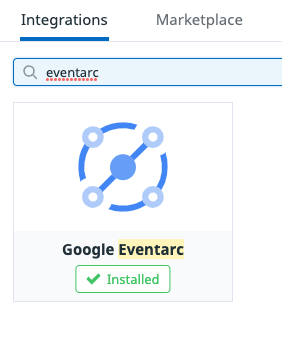
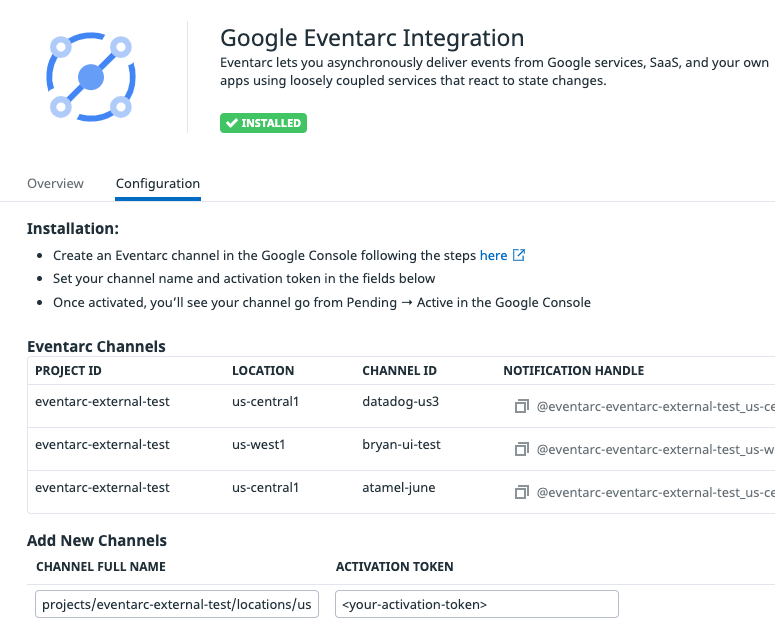
Login to Datadog, Go to Integrations page and search for Google Eventarc. Click the Configure button. If it is not installed, click on the Install button.
In the Configuration tab of the Google Eventarc integration, click on + Add New. Enter the full channel name and the activation token you copied from Cloud Shell:
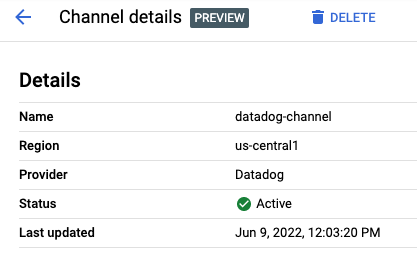
You should now see the channel in the list of channels and after a few seconds, you should also see the channel become active in Google Cloud Console:
Now, you're ready to use the channel!
Click Check my progress to verify the objective.
Create Eventarc channel
Task 6: Create a simple workflow
You need a destination in Google Cloud to receive events from the provider. Eventarc supports a number of event destinations such as Cloud Run, Workflows, Kubernetes services. In this case, deploy a workflow to simply log the received events.
Paste the following in Cloud Shell to create a new file called workflow-datadog1.yaml:
Note that the workflow is receiving an event as a parameter. This event will come from Datadog monitoring via Eventarc. Once the event is received, the workflow simply logs the received event.
The workflow is deployed but it's not running yet. It will be executed by an Eventarc trigger when a Datadog alert is received.
Click Check my progress to verify the objective.
Create a simple workflow
Task 7: Create an Eventarc trigger
You are now ready to connect events from the Datadog provider to Workflows with an Eventarc trigger.
Configure service account
You need a service account with the eventarc.eventReceiver role when creating a trigger. You can either create a dedicated service account or use the default compute service account.
For simplicity, use the default compute service account and grant the eventarc.eventReceiver role:
Click Check my progress to verify the objective.
Create Eventarc trigger
Task 8: Create a Datadog monitor
You will now create a Datadog monitor and connect it to Eventarc.
It will be a Hello World type monitor with default values. You will manually trigger it to generate the monitoring alerts which in turn will generate an Eventarc event in Google Cloud.
To create a monitor in Datadog, log in to Datadog. Hover over Monitors in the main menu and click New Monitor in the sub-menu. There are many monitor types. Choose the Metric monitor type.
In the New Monitor page, leave the defaults for steps 1 and 2.
In step 3, set Alert threshold to 1
In step 4, set Test monitor for Eventarc as the monitor name and click @ Add Mention to select @eventarc__your-region_your-channel-name
Keep the monitor page open for the next step where you will test the monitor.
Task 9: Test monitor and trigger
To test the Datadog monitor and the Eventarc trigger, you will manually trigger the monitor.
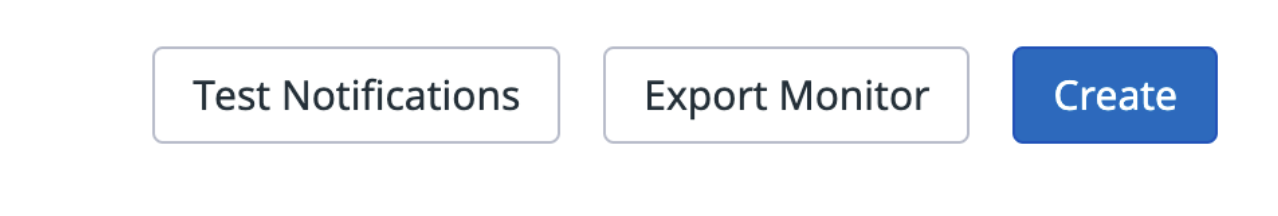
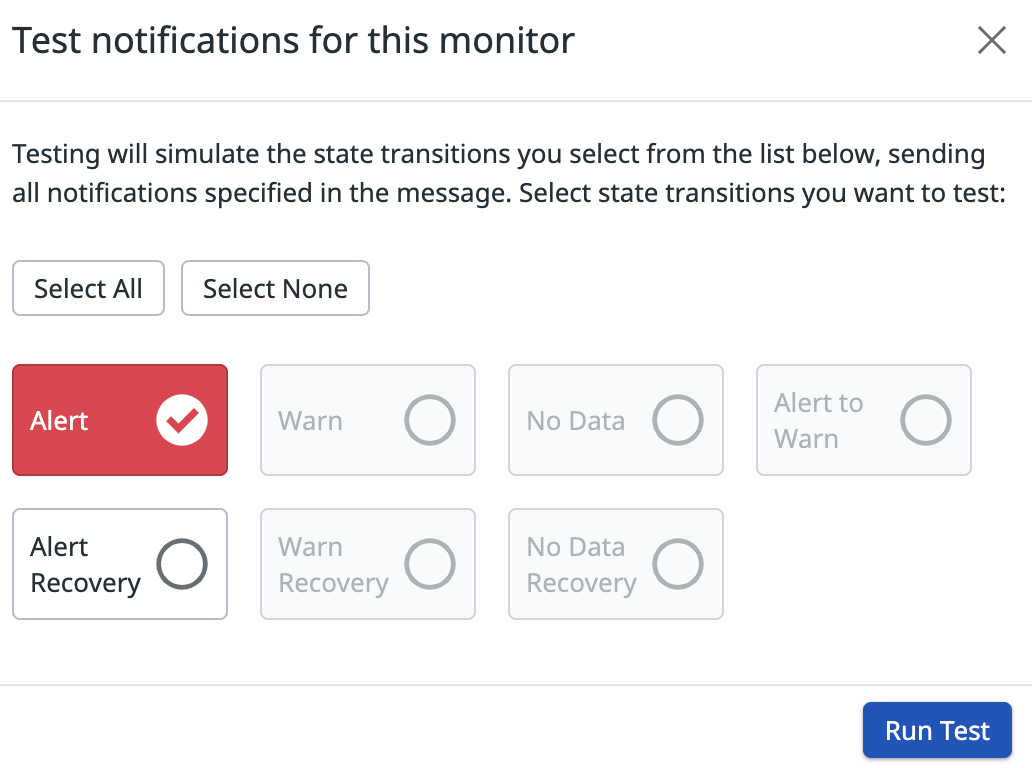
Scroll to the bottom of the monitor creation page you have been working on, and click on the Test Notifications button:
Then, click on the Run Test button:
This should simulate the state transition in the monitor and trigger an Eventarc event.
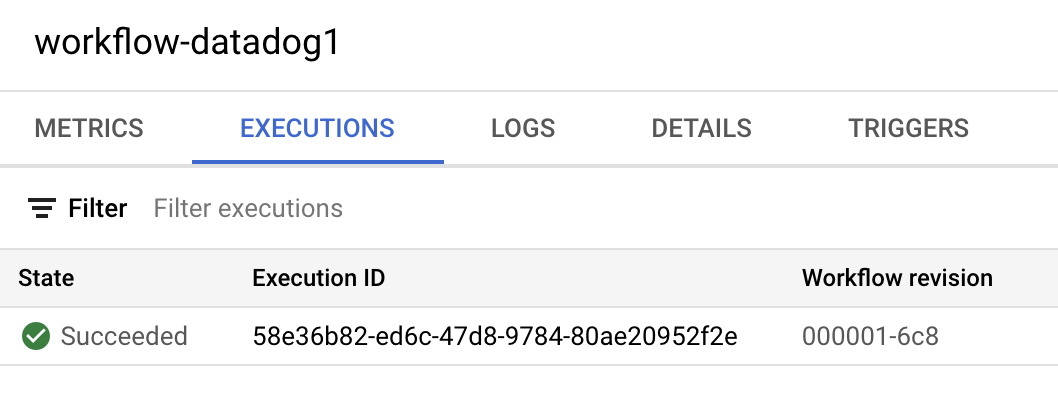
Back in the Google Cloud Console, from the Navigation Menu, go to the Workflows page. Check the workflow-datadog1 workflow. You should see that there's a new execution:
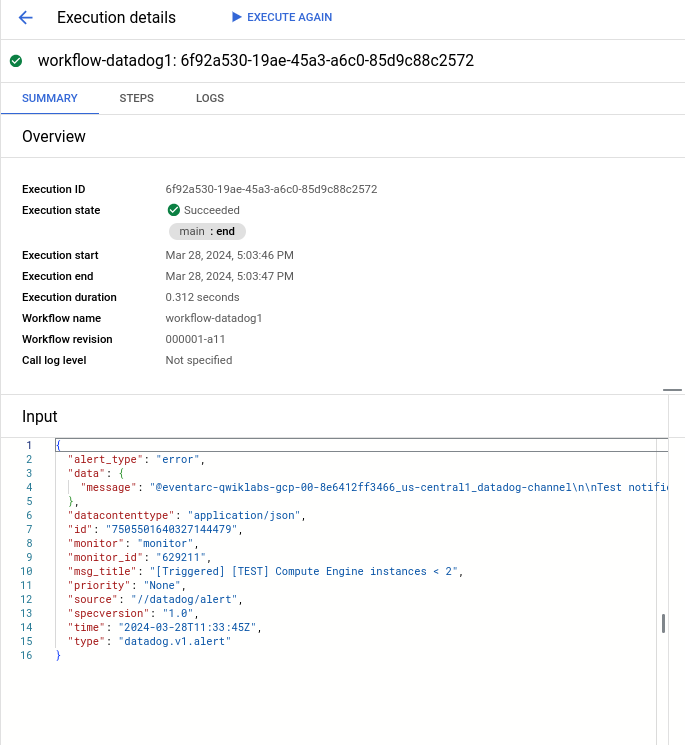
Check the details of the execution. You should see the Datadog event type datadog.v1.alert generated from the monitoring alert in the input of the workflow and also in the logs:
Click Check my progress to verify the objective.
Test Datadog monitor and Eventarc trigger Execution
Task 10: Enable Datadog's Google Cloud integration
To use Datadog to monitor a project, you need to enable APIs needed for Datadog, create a service account, and connect the service account to Datadog.
Create a service account
Datadog's Google Cloud integration uses a service account to make calls to the Cloud Logging API to collect node-level metrics from your Compute Engine instances.
In Cloud Shell, create a service account for Datadog:
DATADOG_SA_NAME=datadog-service-account
gcloud iam service-accounts create $DATADOG_SA_NAME \
--display-name "Datadog Service Account"
Enable the Datadog service account to collect metrics, tags, events, and user labels by granting the following IAM roles:
DATADOG_SA_EMAIL=$DATADOG_SA_NAME@$PROJECT_ID.iam.gserviceaccount.com
gcloud projects add-iam-policy-binding $PROJECT_ID \
--member serviceAccount:$DATADOG_SA_EMAIL \
--role roles/cloudasset.viewer
gcloud projects add-iam-policy-binding $PROJECT_ID \
--member serviceAccount:$DATADOG_SA_EMAIL \
--role roles/compute.viewer
gcloud projects add-iam-policy-binding $PROJECT_ID \
--member serviceAccount:$DATADOG_SA_EMAIL \
--role roles/monitoring.viewer
Note: These steps came directly from Datadog's documentation. For more information, visit https://docs.datadoghq.com/integrations/google_cloud_platform/#setup
Add the Datadog principal to your service account
In Datadog, navigate to Integrations, search for Google Cloud Platform and select it.
Click on Add GCP Account. If you have no configured projects, you are automatically redirected to this page.
If you have not generated a Datadog principal for your org, click the Generate Principal button.
Copy your Datadog principal to the clipboard and keep it for the next section.
Back in the Google Cloud console, under the IAM & Admin > Service Acounts menu, find the service account you created in the first section.
Go to the Permissions tab and click on Grant Access.
Paste your Datadog principal into the New principals text box.
Assign the role of Service Account Token Creator and click Save.
Note: If you previously configured access using a shared Datadog principal, you can revoke the permission for that principal after you complete these steps.
Complete the integration setup in Datadog
In your Google Cloud console, navigate to the Service Account > Details tab for the service account you created. There, you can find the email associated with this Google service account. It resembles <sa-name>@<project-id>.iam.gserviceaccount.com. Copy this email.
Return to the integration configuration tile in Datadog (where you copied your Datadog principal in the previous section).
In the box under Add Service Account Email, paste the email you previously copied.
Click on Verify and Save Account.
Enable Datadog's Google Cloud integration
Task 11: Create a workflow
Now that you have 2 VMs running, create a workflow that will respond to alerts from a Datadog monitor. The workflow can be as sophisticated as you like but in this case, the workflow will check the number of VM instances running and if it falls below 2, it will create new VM instances to make sure there are 2 VMs running at all times.
Copy the following contents and paste them in Cloud Shell to create a workflow-datadog2.yaml file:
Note that the workflow is receiving an event as a parameter. This event will come from Datadog monitoring via Eventarc. Once the event is received, the workflow checks the number of running instances and creates new VM instances, if needed.
The workflow is deployed but it's not running yet. It will be executed by an Eventarc trigger when a Datadog alert is received.
Click Check my progress to verify the objective.
Create a workflow
Task 12: Create an Eventarc trigger for Compute
You are now ready to connect events from the Datadog provider to Workflows with an Eventarc trigger. You will use the channel and the service account you set up in the first codelab.
Create a trigger with the Datadog channel, event type and also a workflow destination:
Click Check my progress to verify the objective.
Create an Eventarc trigger for Compute
Task 13: Create a Datadog monitor for compute
You will now create a Datadog monitor and connect it to Eventarc.
The monitor will check the number of Compute Engine VMs running and alert if it falls below 2.
To create a monitor in Datadog, log in to Datadog. Hover over Monitors in the main menu and click New Monitor in the sub-menu. There are many monitor types. Choose the Metric monitor type.
In the New Monitor page, create a monitor with the following:
Choose the detection method: Threshold Alert.
Define the metric: gcp.gce.instance.is_running from (everywhere) sum by (everything)
Evaluate the minimum of the query over the last 5 minutes
Set alert conditions:
Trigger when the metric is below the threshold
Alert threshold: < 2
Notify your team:
Example Monitor name: Compute Engine instances < 2
Click @ Add Mention and select: @eventarc__your-region_your-channel-name
Now, click Create at the bottom to create the monitor.
Task 14: Test monitor and trigger
To test the Datadog monitor, the Eventarc trigger and eventually the workflow, you will delete one of the VMs:
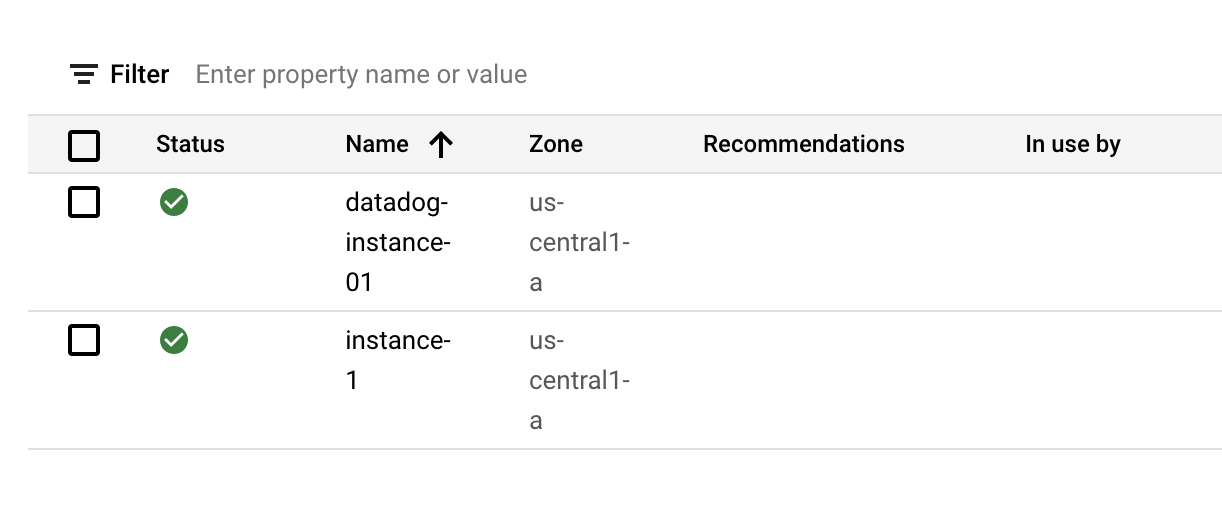
After a few seconds, you should see the instance deleted in Google Cloud Console.
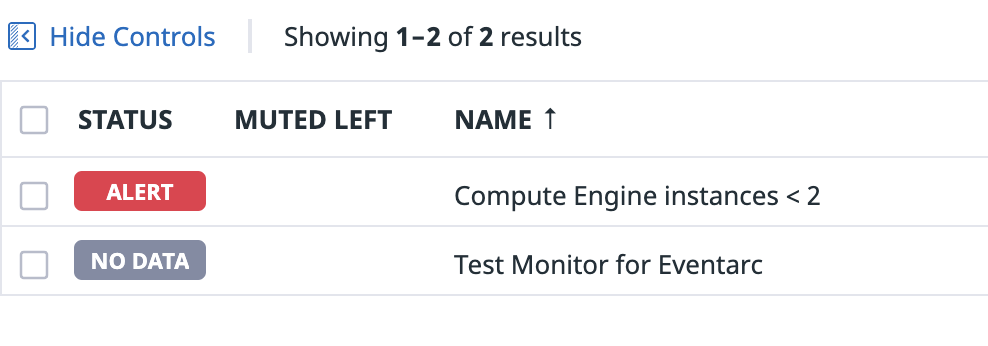
There's a bit of latency for this change to show up in Datadog. After some time (typically 10 mins), you should see the monitor in Datadog to detect and alert this under Manage Monitors section:
Tip: If you don't want to wait for Datadog monitor to alert, you can manually trigger the alert by going to the monitor page, editing the monitoring and clicking on the `Test Notifications` button.
Once the Datadog monitor alerts, you should see that alert go to Workflows via Eventarc. If you check the logs of Workflows, you should see that Workflows checks to find out the difference between the current instance count and expected instance count:
...helps you make the most of Google Cloud technologies. Our classes include technical skills and best practices to help you get up to speed quickly and continue your learning journey. We offer fundamental to advanced level training, with on-demand, live, and virtual options to suit your busy schedule. Certifications help you validate and prove your skill and expertise in Google Cloud technologies.
Manual Last Updated August 23, 2023
Lab Last Tested October 13, 2022
Copyright 2024 Google LLC All rights reserved. Google and the Google logo are trademarks of Google LLC. All other company and product names may be trademarks of the respective companies with which they are associated.
Lab membuat project dan resource Google Cloud untuk jangka waktu tertentu
Lab memiliki batas waktu dan tidak memiliki fitur jeda. Jika lab diakhiri, Anda harus memulainya lagi dari awal.
Di kiri atas layar, klik Start lab untuk memulai
Gunakan penjelajahan rahasia
Salin Nama Pengguna dan Sandi yang diberikan untuk lab tersebut
Klik Open console dalam mode pribadi
Login ke Konsol
Login menggunakan kredensial lab Anda. Menggunakan kredensial lain mungkin menyebabkan error atau dikenai biaya.
Setujui persyaratan, dan lewati halaman resource pemulihan
Jangan klik End lab kecuali jika Anda sudah menyelesaikan lab atau ingin mengulanginya, karena tindakan ini akan menghapus pekerjaan Anda dan menghapus project
Konten ini tidak tersedia untuk saat ini
Kami akan memberi tahu Anda melalui email saat konten tersedia
Bagus!
Kami akan menghubungi Anda melalui email saat konten tersedia
Satu lab dalam satu waktu
Konfirmasi untuk mengakhiri semua lab yang ada dan memulai lab ini
Gunakan penjelajahan rahasia untuk menjalankan lab
Gunakan jendela Samaran atau browser pribadi untuk menjalankan lab ini. Langkah ini akan mencegah konflik antara akun pribadi Anda dan akun Siswa yang dapat menyebabkan tagihan ekstra pada akun pribadi Anda.
In this lab, you will learn how to use the Datadog Monitoring with Google Eventarc.