Checkpoints
Import a CSV file and create a standard table
/ 20
Create a table based on the results of a query using CTAS
/ 20
Work with nested data
/ 20
Deduplicate data
/ 20
Answer business questions with a report
/ 20
Collect, process, and store data in BigQuery
- Activity overview
- Scenario
- Setup
- Task 1. Get started with BigQuery
- Task 2. Explore the Fintech data
- Task 3. Import a CSV file and create a standard table
- Task 4. Join data from two tables
- Task 5. Create a table based on the results of a query using CTAS
- Task 6. Work with nested data
- Task 7. Deduplicate data
- Task 8. Answer business questions with a report
- Conclusion
- End your lab
 IMPORTANT:
 Take screenshots of your work for each task to add to your portfolio.
 Make sure to complete this hands-on lab on a desktop/laptop only.
 There are only 5 attempts permitted per lab.
 As a reminder – it is common to not get every question correct on your first try, and even to need to redo a task; this is part of the learning process.
 Once a lab is started, the timer cannot be paused. After 1 hour and 30 minutes, the lab will end and you’ll need to start again.
 For more information review the Lab technical tips reading.
Activity overview
This lab is part of a capstone project. In this lab, you will apply your knowledge of cloud data analysis and the first three stages of the data journey: collect, process, and store.
You will be given a scenario and a set of tasks to complete using BigQuery. These tasks will require you to use your skills to work and transform data in the BigQuery environment, answer questions about the data, and complete challenges that will test your data transformation skills.
By successfully completing this lab, you will demonstrate your ability to use a cloud data platform like BigQuery for data storage and analysis, and gain practical experience applying SQL to explore, filter, deduplicate, and aggregate data to address a specific business need.
Scenario
TheLook Fintech is a new financial technology company that provides loans to independent online store owners who need funds to buy inventory. Its mission is to change the way people get loans to grow their businesses. As a growth-stage startup, TheLook Fintech has successfully identified its target market and is now working hard to scale up rapidly.
You've been hired as a cloud data analyst. Your first assignment is to develop and implement a plan to help the Treasury department use data effectively to track their performance and growth.
In a meeting with Trevor, the head of the Treasury department, three business questions were identified.
These questions are:
- How can we better monitor our cash flow to make sure the loans we are funding each month is not greater than the money coming in?
- How can we identify the top reasons customers take out a loan from our company?
- How can we track the location where borrowers have taken out loans?
The meeting with Trevor also provided important information about the key metrics needed to answer these business questions.
Cash flow is the amount of money in and out of a company over time. TheLook Fintech needs to make sure that the amount of money coming in from loan payments and other sources is greater than the amount of money going out to fund loans and pay other expenses.
The loan purpose is another important metric to track. Trevor explained that there is a strong correlation between the reasons borrowers give for taking out loans and how likely they are to repay those loans. To make sure that lending is on track, it is important to monitor the primary purpose for the loans.
The borrower location is also a key concern. The Treasury department is seeking to understand how loans are distributed geographically. This is because high concentrations of loans in one region can increase the risk of collective defaults. An even distribution of loans across regions can help to reduce this risk by ensuring that lenders are not overly reliant on any one area for their loan repayments.
Your analysis will focus on these three key metrics.
In this lab, you’ll use BigQuery to collect, process, and store the data to answer these business questions and prepare a series of reports for Trevor.
To do this, First you’ll set up the BigQuery working environment. Then, you’ll explore the loan data to find the information Trevor is requesting. Next, you’ll Import a file with a new classification of states and store the data as a standard table. Then, you’ll join two tables to prepare a report with the combined data. Next, you’ll deduplicate the purpose data. Finally, you’ll produce a report with the total amount of loans issued by day and year.
Setup
Before you click Start Lab
Read these instructions. Labs are timed and you cannot pause them. The timer, which starts when you click Start Lab, shows how long Google Cloud resources will be made available to you.
This practical lab lets you do the activities yourself in a real cloud environment, not in a simulation or demo environment. It does so by giving you new, temporary credentials that you use to sign in and access Google Cloud for the duration of the lab.
To complete this lab, you need:
- Access to a standard internet browser (Chrome browser recommended).
- Time to complete the lab---remember, once you start, you cannot pause a lab.
How to start your lab and sign in to the Google Cloud console
-
Click the Start Lab button. On the left is the Lab Details panel with the following:
- Time remaining
- The Open Google Cloud console button
- The temporary credentials that you must use for this lab
- Other information, if needed, to step through this lab
Note: If you need to pay for the lab, a pop-up opens for you to select your payment method. -
Click Open Google Cloud console (or right-click and select Open Link in Incognito Window) if you are running the Chrome browser. The Sign in page opens in a new browser tab.
Tip: You can arrange the tabs in separate, side-by-side windows to easily switch between them.
Note: If the Choose an account dialog displays, click Use Another Account. -
If necessary, copy the Google Cloud username below and paste it into the Sign in dialog. Click Next.
You can also find the Google Cloud username in the Lab Details panel.
- Copy the Google Cloud password below and paste it into the Welcome dialog. Click Next.
You can also find the Google Cloud password in the Lab Details panel.
- Click through the subsequent pages:
- Accept the terms and conditions
- Do not add recovery options or two-factor authentication (because this is a temporary account)
- Do not sign up for free trials
After a few moments, the Console opens in this tab.

Task 1. Get started with BigQuery
As a cloud data analyst, one of the first things you will need to do when working on a project is open your working environment and locate the data that you will be working with in your analysis.
In this task, you'll open up the BigQuery environment, select an existing BigQuery project, and locate the Fintech data set.
- Go to Navigation Menu > BigQuery. Click Done.
- Locate the fintech dataset under the Explorer section. This is the dataset you will use for the next task.
Task 2. Explore the Fintech data
The Fintech dataset contains loan information that can be used to answer Trevor's business questions. One key piece of information is the total loan amount.
In this task, you’ll explore the tables in the Fintech dataset to find the table and column that contains the total loan amount. This information is important to help Trevor keep track of the company’s cash outflow.
- Open each table in the fintech dataset.
- Use the Details tab to learn more about each table.
- Use the Schema tab to identify which columns are included in each table and the data type of each column.
- Use the Preview tab to view a preview of the data. Locate the column with the loan amount to verify that it has the information that you need.
Trevor explains that when TheLook Fintech lends to its customers, the date that the money becomes available to the customer is known as the “issued” date. This is another key piece of information that you’ll need to help Trevor’s team track the total amount of cash that goes out each day or month.
Locate the table in the Fintech dataset that has the date each loan was issued and then answer the questions below.
Task 3. Import a CSV file and create a standard table
Most of the data needed for analysis is found in the Fintech dataset, but some must be collected from another source. Trevor has provided a CSV file that maps US states to regions and subregions. This key information will allow Trevor to track loans by the state or region where the borrower took out the loan.
The CSV file is located in Cloud Storage in the following location:
Below is an example of the data in the CSV file:
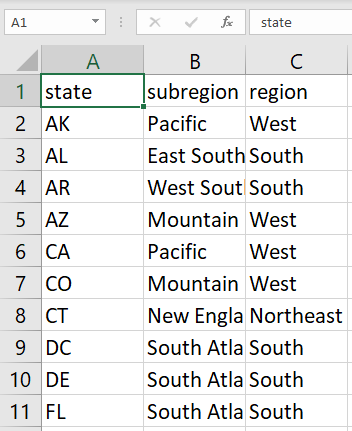
In this task, you’ll import the CSV file into BigQuery and store it as a standard table.
- Review the following code that you’ll use to import the CSV file. Then answer the questions below.
-
Copy and paste the above command into the Untitled tab to create the standard table with the data from the CSV file.
-
Click Run.
Next, review the table that you created and compare it to the original CSV file:
-
In the Explorer pane, select the state_region table. If the table is not displayed, you may have to refresh the dataset.
-
Click on the Preview tab, and examine the data you just imported into BigQuery.
Click Check my progress to verify that you have completed this task correctly.
Task 4. Join data from two tables
Now that you have explored and collected the data you need, you’re ready to process the data to make it usable for analysis.
Trevor wants a single report that includes the loan_id, loan_amount, and region name. But this information is currently in two tables.
In this task, you’ll identify the tables that contain the columns you need and use SQL to join the two tables to create the report.
- Review the tables in the Fintech dataset and then answer the questions below.
- In the Query Editor, run Query A and Query B, and review the results. Then answer the question below:
Query A
Query B
Task 5. Create a table based on the results of a query using CTAS
Trevor wants to do additional filtering and analysis of the data from the report using Google Sheets.
But to do this, you will first have to create a table to store the data.
A CTAS statement, or CREATE TABLE AS SELECT statement, is a SQL statement that creates a new table based on the results of a SELECT statement. It is a powerful tool that can be used to create new tables quickly and easily. Tables made with CTAS statements can also be exported easily in BigQuery so that they can be shared with others.
In this task, you’ll create a new table using CREATE TABLE AS SELECT, and then connect that table to Google Sheets.
- Copy and paste the following command into the Query Editor:
CREATE OR REPLACE TABLE is used to create a table or replace the existing table each time the query is run.-
Click Run.
-
Locate the new table. You may have to refresh!
Click Check my progress to verify that you have completed this task correctly.
-
In the Explorer pane, select the newly created loan_with_region table. (Click Refresh to refresh the dataset if the table is not displayed).
-
On the toolbar, click Export, then select Explore with Sheets. A Google Sheet will open that contains the same connected to the loan_with_region table.
- Review the data in the Google Sheet.
You’ll now be able to share the Google Sheet with Trevor, offering them a way to work with the data in a spreadsheet format.
Task 6. Work with nested data
Trevor is researching the main reasons why people get loans from TheLook Fintech because they have found that the reasons borrowers take out money is a strong predictor if the money will be repaid.
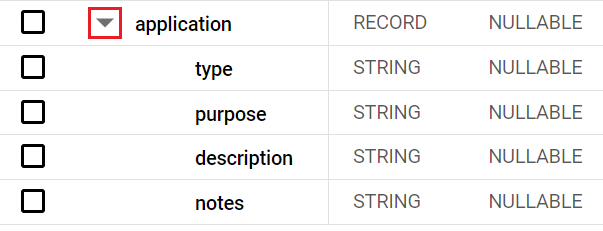
They ask you to create a simple report that includes the purpose each borrower gave when asking for the loan. But finding this data may be tricky because it is captured as part of the loan application process and stored in a nested column called purpose.
In this task, you’ll find the purpose column, which is nested in the application record, and run a query to find the reasons borrowers take out loans.
-
In the Explorer pane, select the loan table.
-
Select the Schema tab and locate the application column.
-
In the Schema tab, click on the drop-down arrow next to application to expand the record.
- Click on the Preview tab, and examine the sample data of the loan table.
Do you think the following query will return the purpose of each loan from the loan table?
- Copy and paste the following command into the Query Editor:
- Click Run.
- Copy and paste the following command into the Query Editor:
- Click Run.
This query returns the purpose of each loan in the loan table, which Trevor can use to examine the most common reasons why people get loans from TheLook Fintech.
Columns within records (or structs) are referenced by the name of the record followed by the name of the column, using dot notation. For example, to reference the purpose column in the application record, you would use the application.purpose notation.
Click Check my progress to verify that you have completed this task correctly.
Task 7. Deduplicate data
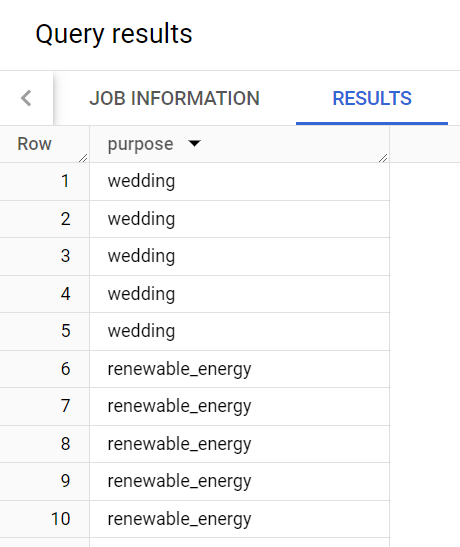
When you created the list of loan purposes for Trevor, it looks like some of the reasons borrowers took out loans appears more than once.
For example, the reason “wedding” appears multiple times.
Here are the query results:
Duplicate data is a common problem cloud data analysts face. The process of removing duplicates from a data set is known as deduplication.
Challenge: Create a single column table with distinct values
- Write a query to create a table named
fintech.loan_purposesthat has a single column namedpurposewith distinct values for thepurposecolumn in thefintech.loantable.
CREATE TABLE AS SELECT (CTAS) statement.Click Check my progress to verify that you have completed this task correctly.
Task 8. Answer business questions with a report
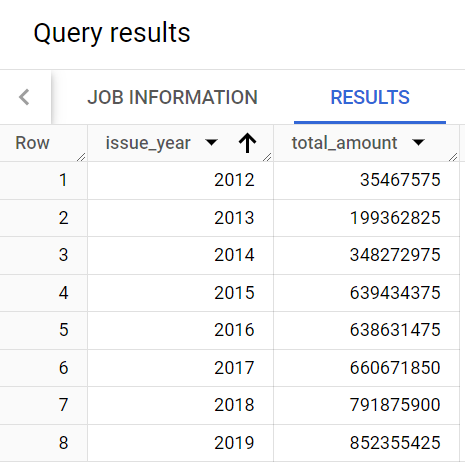
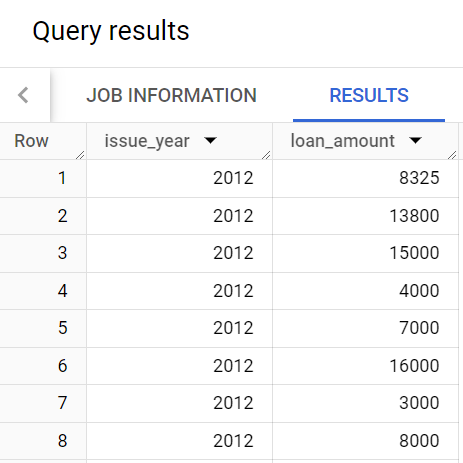
Trevor also needs a report with the total amount in loans issued by year. In this task, you’ll write a query that produces that data, and then create a table with the results.
Trevor explains that he would like a report with a structure similar to this that includes both an issue_year and total_amount column.
Next, examine the data.
- Copy and paste the following command into the Query Editor:
- Click Run.
The query should return results similar to the following:
- Copy and paste the following command into the Query Editor:
- Click Run.
Note that the keywords GROUP BY and the function sum() were used in the query
Challenge: Create a table that counts loans grouped by year
Write a query to create a table called loan_count_by_year in the fintech dataset that counts loan_id grouped by issue_year.
Click Check my progress to verify that you have completed this task correctly.
Conclusion
As a cloud data analyst at TheLook Fintech, you have successfully provided the data Trevor and the Treasury department need to better understand the company's cash flow and make informed business decisions.
First, you started by exploring the loan data to find the information Trevor requested, such as the total loan amount in the Fintech dataset.
Next, you imported a file with a new classification of states, which Trevor wanted to use to change how loans are categorized by region.
Then, you created a new table with the results of a query, which Trevor would use to create a report that displays the loan ID, loan amount, and region name.
You deduplicated the data to remove any duplicate records.
Finally, you produced a report with the total amount of loans issued by day and year, which Trevor needed to better understand the company's cash flow.
You are well on your way to understanding how to collect, process, and store data for analysis.
End your lab
Before you end the lab, make sure you’re satisfied that you’ve completed all the tasks. When you're ready, click End Lab and then click Submit.
Ending the lab will remove your access to the lab environment, and you won’t be able to access the work you've completed in it again.
Copyright 2024 Google LLC All rights reserved. Google and the Google logo are trademarks of Google LLC. All other company and product names may be trademarks of the respective companies with which they are associated.