Points de contrôle
Deploy model and views to production
/ 50
Build a Look
/ 50
Model dimensions and measures using LookML
 IMPORTANT:
 Make sure to complete this hands-on lab on a desktop/laptop only.
 There are only 5 attempts permitted per lab.
 As a reminder – it is common to not get every question correct on your first try, and even to need to redo a task; this is part of the learning process.
 Once a lab is started, the timer cannot be paused. After 1 hour and 30 minutes, the lab will end and you’ll need to start again.
 For more information review the Lab technical tips reading.
Activity overview
One powerful feature of Looker Enterprise is the development mode. Looker’s development mode allows you to create and manage LookML models, which are the foundation of Looker's semantic layer. LookML models allow you to define relationships in your data, and create custom visualizations and reports.
LookML also allows you to define dimensions and measures. Dimensions are attributes of the data that help you to describe it. For example, a dimension could be product SKUs, user email addresses, or an inventory category. Measures are aggregations of one or more dimensions. For example, a measure could be the sum of sales, the average sales price, or a count of purchases to identify the most popular product.
In this lab activity, you will use the development mode in Looker Enterprise to define dimensions and measures using LookML. You will then use these dimensions and measures to extract answers to stakeholder questions.
Scenario
The head of analytics at TheLook eCommerce has announced a new project to model the company's data using LookML. This is a big task, as the database includes data from all of the company's divisions, including warehouse, manufacturing, finance, sales, marketing, and eCommerce.
As a cloud data analyst, you have been asked to create a new LookML project in Looker's development mode. You will then create a view and model the dimensions and measures in the data. This will allow various stakeholders across the company to derive business value from the data collected.
Here’s how you'll do this: First, you’ll create a LookML project. Next, you’ll develop views in Looker. Then, you’ll create measures in Looker. Next, you’ll create dimensions in Looker. Finally, you’ll build a Look.
Setup
Before you click Start Lab
Read these instructions. Labs are timed and you cannot pause them. The timer, which starts when you click Start Lab, shows how long Google Cloud resources will be made available to you.
This practical lab lets you do the activities yourself in a real cloud environment, not in a simulation or demo environment. It does so by giving you new, temporary credentials that you use to sign in and access Google Cloud for the duration of the lab.
To complete this lab, you need:
-
Access to a standard internet browser (Chrome browser recommended)
-
Time to complete the lab---remember, once you start, you cannot pause a lab
How to start your lab and sign in to Looker
-
Click the Start Lab button. On the left is the Lab Details panel with the following:
- Time remaining
- The Open Looker button
- The temporary credentials that you must use for this lab
- Other information, if needed, to step through this lab
Note: If you need to pay for the lab, a pop-up opens for you to select your payment method. -
Click Open Looker.
Tip: Arrange the tabs in separate windows, side-by-side.
- Copy the Looker username (email) and password below and paste it into the Looker Log in dialog.
Looker username (email):
Looker password:
You can also find the Looker username (email) and password in the Lab Details panel.
- Select the Stay logged in checkbox, and click Log In.
After a successful login, the Looker instance for this lab will display.
Task 1. Create a LookML project
In this task, you’ll create a LookML project in Development mode. In Looker, there are two main modes: development mode and production mode. Production mode is the environment where your Looker data and content is live and accessible to all users. Development mode is a sandbox environment where you can make changes to your LookML files and preview how they will affect your data and content without impacting the live content. Once you're happy with your changes in Development mode, you can merge them into Production, where they will be visible to everyone.
- Slide the Development mode toggle, located at the bottom right side of the Looker user interface, to activate Development mode.
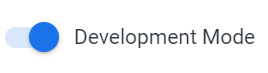
Once this mode is activated, a banner displays the following message: You are in Development Mode.
-
Select Develop in the navigation panel.
-
Select Projects in the Develop menu. The LookML Projects page displays.
-
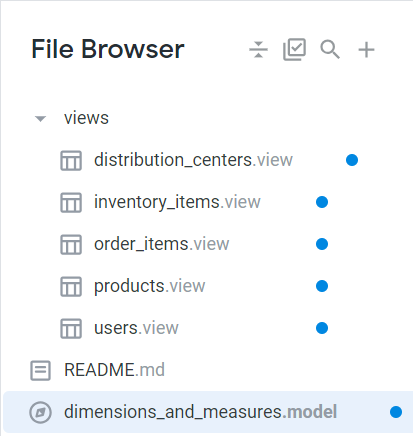
In the LookML Projects section, under Projects, click the dimensions_and_measures link. The dimensions_and_measures folder opens on the File Browser.
-
Click the + button next to File Browser to create a new file.
-
Select Create Project Manifest. The manifest.lkml file opens in the File Browser.
-
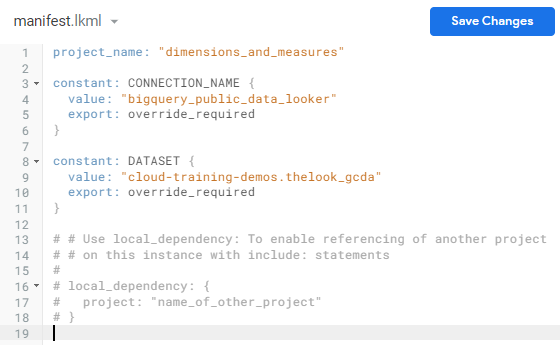
Paste the following snippet into the manifest.lkml file, below the project_name line:
The manifest.lkml file should now contain the following code:
-
Click Save Changes.
-
Click Commit Changes & Push. The Commit dialog displays.
-
In the Message field, type created manifest file, and click Commit.
Task 2. Create a data model
In this task, you'll create a data model and change its connection parameter value.
-
Click the + button next to File Browser.
-
Select Create Model. The Create File dialog displays.
-
In the Enter file name field, type dimensions_and_measures.
-
Click Create. The dimensions_and_measures.model file displays in the File Browser.
-
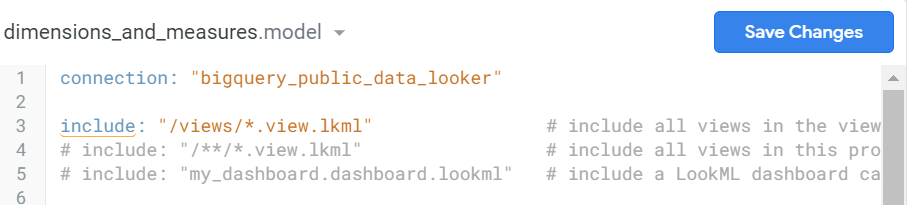
In the first line of the dimensions_and_measures.model file, change the
connectionparameter value fromconnection_nametobigquery_public_data_looker.
The dimensions_and_measures.model file should now contain the following code:
- Click Save Changes.
Task 3. Create a view
In this task, you’ll create a view file from an existing database table while in Development Mode.
-
With the dimensions_and_measures.model model file still open, click the + button next to File Browser, then select Create View From Table.
-
On the Create Views from Tables page, in the Enter custom db field, type cloud-training-demos and press the ENTER key.
Looker displays a list of datasets associated with the bigquery_public_data_looker connection.
-
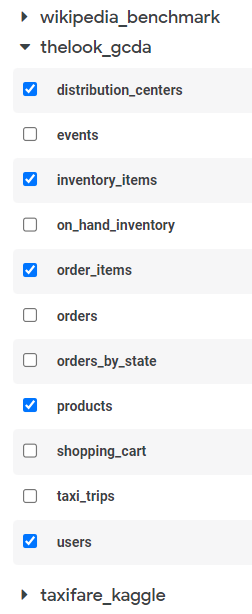
Using the drop-down icon for thelook_gcda, expand this list to access all available tables.
-
Select the following five tables to create views from by checking the box next to each one:
distribution_centersinventory_itemsorder_itemsproductsusers
- Scroll to the bottom of the page and click Create Views. The Generator Results page displays views containing LookML for all the table columns.
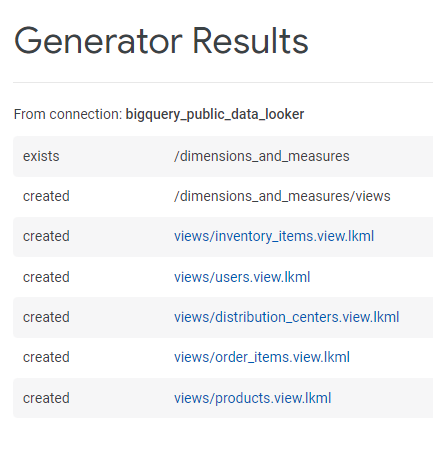
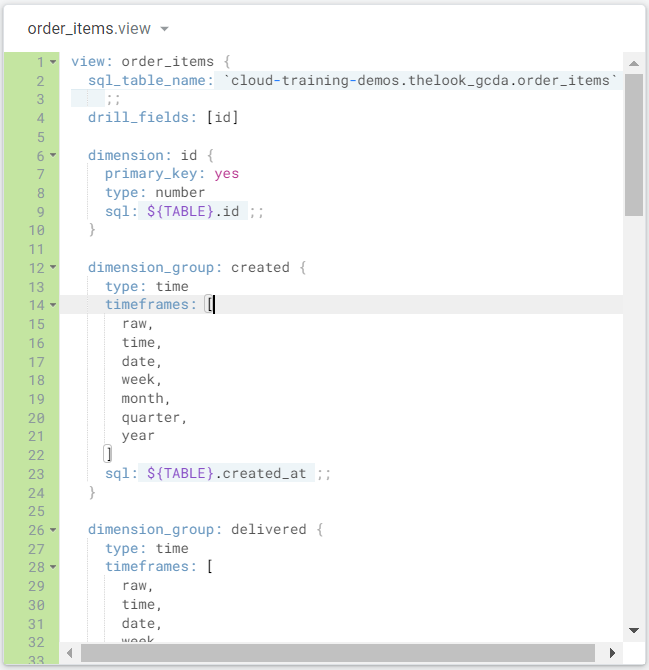
- Click the views/order_items.view.lkml link. The order_items.view file displays.
Task 4. Define measures and dimensions
In this task, you’ll define measures and dimensions for your LookML project. In LookML, dimensions are used to categorize your data, while measures are used to quantify it. This allows you to analyze your data from different perspectives and gain valuable insights.
-
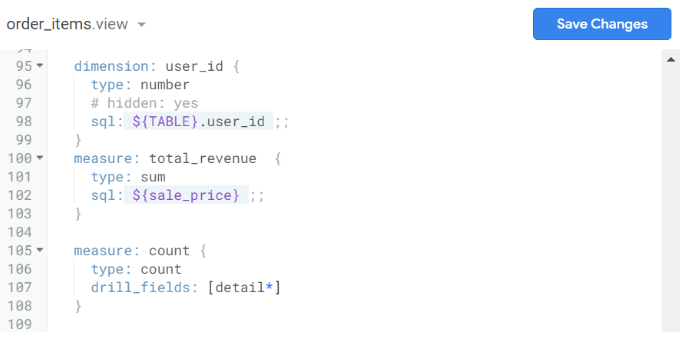
Click on line 100 in the order_items.view file. This line is currently blank.
-
Create a new measure called
total_revenue, which is a sum of the sale_price dimension, by adding the following snippet to the view on line 100:
The order_items.view file should now contain the following code:
-
Click Save Changes.
-
Scroll to the
dimension_group: createdsection, starting at line 12. -
Locate the
timeframearray on line 14, and theyearon line 21.
Note that items in arrays are comma-separated.
- Add a comma after year on line 21, then add the following new timeframes:
The file should now contain the following code:
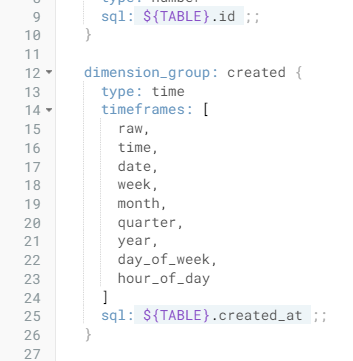
- Click Save Changes.
Task 5. Create an Explore
In Looker Enterprise, an Explore is your starting point for data analysis. It contains views, which are organized collections of dimensions (categories like product names) and measures (quantities like total revenue). By manipulating these elements, you can explore your data, track trends, uncover relationships, and answer your business questions.
In this task, you’ll create an Explore environment that joins the order_items and users views together, on order_items.user_id = users.id. In Looker Enterprise, an Explore is a starting point for data analysis. Explores contain views, which are organized collections of dimensions and measures. By manipulating these elements, you can explore your data, track trends, uncover relationships, and answer your business questions.
-
On the navigation panel, select dimensions_and_measures.model.
-
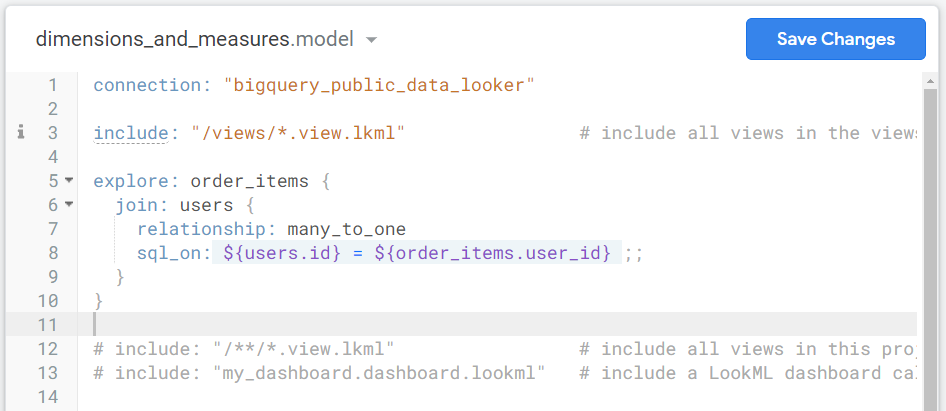
In the dimensions_and_measures.model file, add the following snippet to line 5:
The dimensions_and_measures.model file should now contain the following code:
- Click Save Changes.
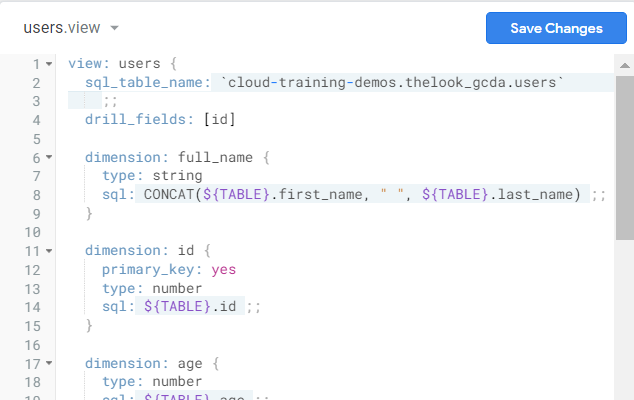
Next, create a new dimension called full_name, which joins the user first name and user last name fields
- On the navigation panel, expand views.
-
Select users.view.
-
Edit the users.view file by adding the following snippet after the line:
drill_fields: [id]:
The users.view file should now contain the following code:
- Add the following key-value pair under type: sum to add a description to the total_revenue measure.
Here is the revised code for reference:
Then, create a new measure called total_users which does a count_distinct of the id dimension.
- Add the following snippet above the
measure: count {:
The users.view file should now contain the following code:
- Click Save Changes.
Next, add a drill fields parameter to the total_revenue measure that includes the following dimensions: created_date, sale_price, and users.user_name.
-
On the navigation pane, in the views section, select order_items.view.
-
In the order_items.view file, replace
drill_fields: [id]on line 4 with the following snippet:
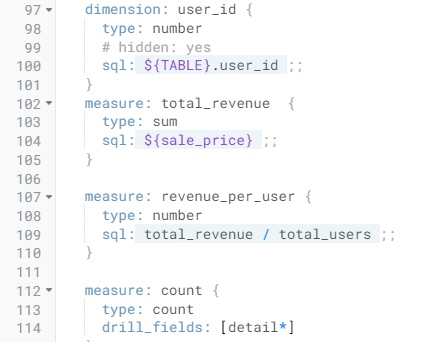
Then, create a measure called revenue_per_user which divides the total_revenue measure by the total_users measure.
- Scroll to the
measure: total_revenuesection and add the following snippet after it:
The order.items file should now contain the following code:
- Click Save Changes.
Finally, deploy changes to Production.
-
Click Commit Changes & Push.
-
In the Commit dialog, enter the following commit message: added model, views, new measures and dimensions.
-
Click Commit.
-
Click Deploy to Production.
Click Check my progress to verify that you have completed this task correctly.
Task 6. Build a Look
In this task, you’ll put your newly defined dimensions and measures into action by building a Look. In Looker, a Look is a saved report or visualization that can be shared with others. Your Look will display the total revenue and total user count by the day of the week.
-
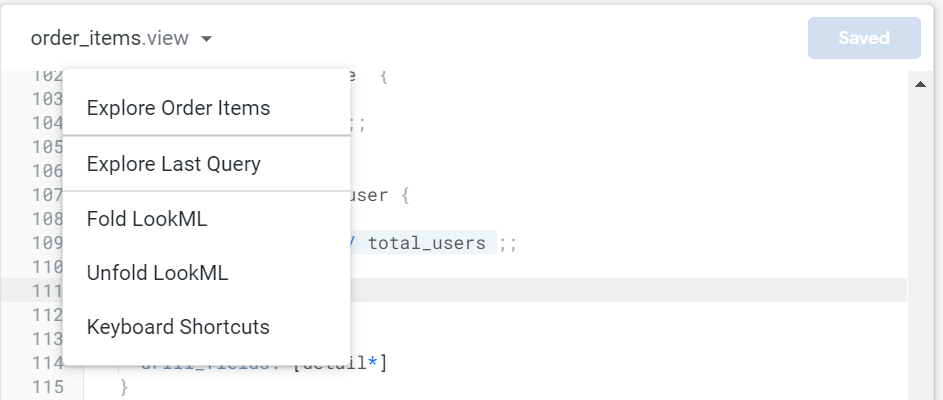
Click the drop-down icon next to the order_items file title to display the menu items.
-
Select Explore Order Items.
-
Navigate to All Fields tab > Order Items > Measures section, and select Total Revenue.
-
Navigate to All Fields tab > Order Items > Dimensions section, and expand the Created Date dropdown menu.
-
Select Day of Week.
-
Click on the Filter by field (
) icon next to Date to create a filter.
) icon next to Date.
-
Expand the Filters bar (if it’s not already expanded), then expand the Order Items Created Date dropdown and select the is in the year option.
-
Type 2022 to filter the results for the year 2022.
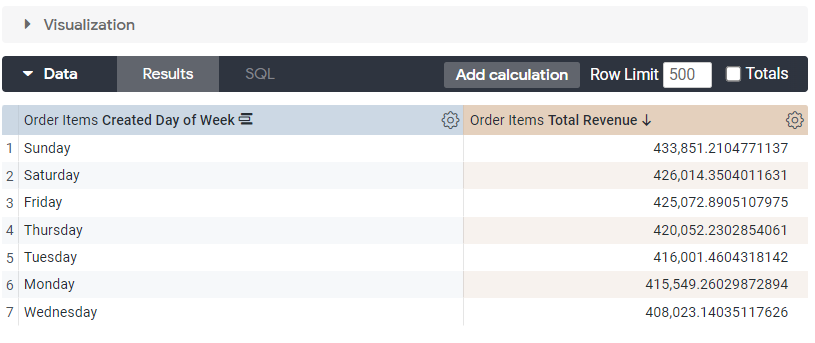
-
Click Run. Your visualization should resemble the following:
-
In the Explore action bar, click Settings (
).
-
From the Settings dropdown menu, select Save… > As a Look.
-
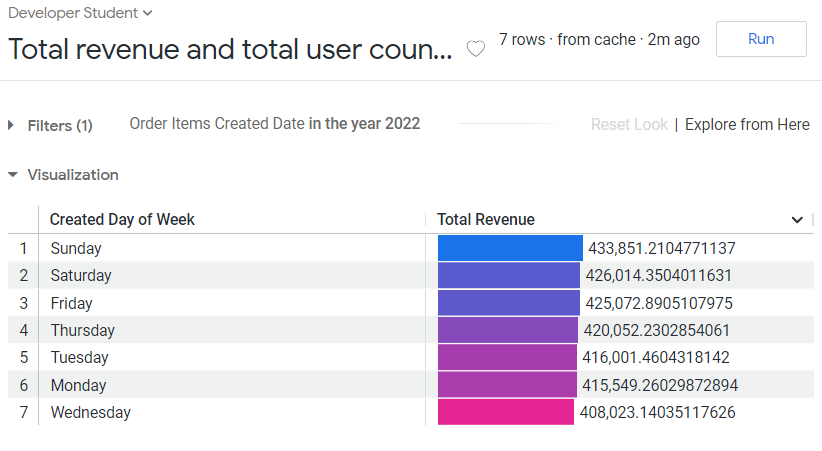
On the Save Look tab, in the Title field, enter the following title for the new Look: Total revenue and total user count by the day of the week.
-
Click Save & View Look.
Click Check my progress to verify that you have completed this task correctly.
Conclusion
Great work!
As a cloud data analyst at TheLook eCommerce, you have successfully created a new LookML project in Looker's development mode.
First, you created a manifest file and added a new model.
Then, you connected to a data source and created new views from tables.
Next, you defined measures and dimensions for your LookML project and created an Explore.
Finally, you built a Look that displays the total revenue and total user count by the day of the week.
You are well on your way to understanding how to create new measures and dimensions for use in Looker, enabling organizations’ stakeholders to derive value from their collected data.
End your lab
Before you end the lab, make sure you’re satisfied that you’ve completed all the tasks. When you're ready, click End Lab and then click Submit.
Ending the lab will remove your access to the lab environment, and you won’t be able to access the work you've completed in it again.
Copyright 2024 Google LLC All rights reserved. Google and the Google logo are trademarks of Google LLC. All other company and product names may be trademarks of the respective companies with which they are associated.

