Checkpoints
Use partitions to reduce the amount of data examined
/ 100
Manage a partitioned table in BigQuery
 IMPORTANT:
 Make sure to complete this hands-on lab on a desktop/laptop only.
 There are only 5 attempts permitted per lab.
 As a reminder – it is common to not get every question correct on your first try, and even to need to redo a task; this is part of the learning process.
 Once a lab is started, the timer cannot be paused. After 1 hour and 30 minutes, the lab will end and you’ll need to start again.
 For more information review the Lab technical tips reading.
Activity overview
Partitioned tables are a powerful tool that cloud data analysts can use to improve query performance and reduce costs.
A partitioned table is divided into segments, called partitions, that make it easier to manage and query your data. By dividing a large table into smaller partitions, you can improve query performance and control costs by reducing the number of bytes read by a query.
In this lab, you’ll partition tables by specifying a partition column which is used to segment the table, manage tables using default and customized settings, add and export data, and query tables.
Scenario
Meredith, the head merchandiser of The Look eCommerce, wants to better understand the behavior of customers at the company's brick-and-mortar stores. Meredith is responsible for overseeing the company's product selection. But, they are concerned about not having a complete understanding of how customers are using the stores and the products they want to buy.
So Meredith asks Huan, a data scientist who works with the merchandising team, for help. Huan's role is to study the number of people who are dropped off near brick-and-mortar stores after taking a taxi ride. Huan believes that this data can provide valuable insights into customer shopping patterns. This information can help the merchandising team make more informed decisions about each store's stock.
To visualize the data for the merchandising team, Huan built a dashboard that shows various stores and how many people are dropped off nearby. But, it looks like the dashboard is not working out as Huan hoped! When they open up their email, they find multiple complaints from users that the dashboard is too slow. Huan also notices that the costs of running the dashboard are too high.
As a cloud data analyst for TheLook eCommerce, you have been asked to help to make the dashboard more efficient and cost-effective so that the merchandising team can have the data they need.
You ask Artem, the data architect for help. They tell you the problem may be related to how the data is being partitioned. The more data that must be scanned for each query, the more resources the query will use. They suggest that you test if partitions can be used to scan less data for queries. This will reduce both time and costs.
You suspect that the problem may be related to how the data is being partitioned. So you decide to test if partitions can be used to scan less data for queries.
Here’s how you'll do this task: First, you’ll conduct an analysis of partitioned tables. Next, you’ll check the amount of data analyzed. Then, you’ll run several queries, clearing the cache after each query. Finally, you’ll use partitions as filters.
Setup
Before you click Start Lab
Read these instructions. Labs are timed and you cannot pause them. The timer, which starts when you click Start Lab, shows how long Google Cloud resources will be made available to you.
This practical lab lets you do the activities yourself in a real cloud environment, not in a simulation or demo environment. It does so by giving you new, temporary credentials that you use to sign in and access Google Cloud for the duration of the lab.
To complete this lab, you need:
- Access to a standard internet browser (Chrome browser recommended).
- Time to complete the lab---remember, once you start, you cannot pause a lab.
How to start your lab and sign in to the Google Cloud console
-
Click the Start Lab button. On the left is the Lab Details panel with the following:
- Time remaining
- The Open Google Cloud console button
- The temporary credentials that you must use for this lab
- Other information, if needed, to step through this lab
Note: If you need to pay for the lab, a pop-up opens for you to select your payment method. -
Click Open Google Cloud console (or right-click and select Open Link in Incognito Window) if you are running the Chrome browser. The Sign in page opens in a new browser tab.
Tip: You can arrange the tabs in separate, side-by-side windows to easily switch between them.
Note: If the Choose an account dialog displays, click Use Another Account. -
If necessary, copy the Google Cloud username below and paste it into the Sign in dialog. Click Next.
You can also find the Google Cloud username in the Lab Details panel.
- Copy the Google Cloud password below and paste it into the Welcome dialog. Click Next.
You can also find the Google Cloud password in the Lab Details panel.
- Click through the subsequent pages:
- Accept the terms and conditions
- Do not add recovery options or two-factor authentication (because this is a temporary account)
- Do not sign up for free trials
After a few moments, the Console opens in this tab.

Task 1. Analyze a partitioned table
In this task, you’ll analyze a partitioned table to identify the performance and cost issues that may be causing Huan's dashboard to be slow and expensive.
- In the Cloud console, from the Navigation menu (
), select BigQuery > BigQuery Studio.
- Expand the list of datasets by clicking the drop-down arrow next to the project ID.
- Expand the thelook_gcda dataset.
- Select the taxi_trips table.
Notice the icon indicating that the taxi_trips table is partitioned.

Task 2. Use partitions to reduce the amount of data examined
In this task, you'll discover how partitioning limits the amount of data that needs to be examined each time a query is executed. Partitions increase query performance and aid cost reduction.
- In BigQuery Studio, click + Compose new query. A new Untitled tab opens.
- Copy and paste the following query into the Untitled tab:
-
Click Run.
-
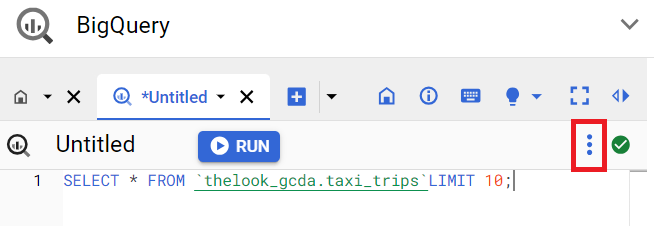
In the SQL Query editor action bar, click More > Query settings. The Query settings dialog opens.
Now, disable the query cache preference. In the Session management section, ensure that the Use session mode checkbox is cleared.

-
Click Save.
-
Replace the previous query in the Untitled tab with the following SQL query:
Notice the number of MB this query will process when run. For small browser windows, hover over the green check to view the number of MB this query will process when run.
- Click Run.
- Replace the previous query in the Untitled tab with the following SQL query:
Notice the number of MB this query will process when run. For small browser windows, hover over the green check to view the number of MB this query will process when run.
- Click Run.
- Replace the previous query in the Untitled tab with the following SQL query:
- Click Run.
WHERE statement goes way back to the 1900s, and all rows in the table will satisfy that criterion since the oldest pickup_datetime in this table is December 2008 as displayed in column pickup_datetime.
Click Check my progress to verify that you have completed this task correctly.
Conclusion
Great work! You have successfully conducted an analysis of partitioned tables in BigQuery and helped Huan make their dashboard more efficient and cost-effective.
By examining the amount of data analyzed and running queries, you have explored ways to address the reported slow performance of the dashboard.
Additionally, by utilizing partitions as filters, you have tested the effectiveness of reducing the data scanned for queries, potentially providing insights for optimizing query efficiency and reducing costs for the dashboard.
You’re well on your way to understanding how to utilize data sources in BigQuery.
End your lab
Before you end the lab, make sure you’re satisfied that you’ve completed all the tasks. When you're ready, click End Lab and then click Submit.
Ending the lab will remove your access to the lab environment, and you won’t be able to access the work you've completed in it again.
Copyright 2024 Google LLC All rights reserved. Google and the Google logo are trademarks of Google LLC. All other company and product names may be trademarks of the respective companies with which they are associated.