

Before you begin
- Labs create a Google Cloud project and resources for a fixed time
- Labs have a time limit and no pause feature. If you end the lab, you'll have to restart from the beginning.
- On the top left of your screen, click Start lab to begin
Check pizza query
/ 10
Check dogecoin query
/ 10
Transaction hash query
/ 40
Calculate balance query
/ 40
This lab lets you explore the six cryptocurrency blockchain datasets released publically in BigQuery. This was introduced in the blog post Introducing six new cryptocurrencies in BigQuery Public Datasets—and how to analyze them.
The following is from the blog post, please read to understand the background of the lab:
Since they emerged in 2009, cryptocurrencies have experienced their share of volatility—and are a continual source of fascination. In the past year, as part of the BigQuery Public Datasets program, Google Cloud released datasets consisting of the blockchain transaction history for Bitcoin and Ethereum, to help you better understand cryptocurrency. Today, we're releasing an additional six cryptocurrency blockchains.
We are also including a set of queries and views that map all blockchain datasets to a double-entry book data structure that enables multi-chain meta-analyses, as well as integration with conventional financial record processing systems.
The six cryptocurrency blockchain datasets we’re releasing today are Bitcoin Cash, Dash, Dogecoin, Ethereum Classic, Litecoin, and Zcash.
Five of these datasets, along with the previously published Bitcoin dataset now follow a common schema that enables comparative analyses. We are releasing this group of Bitcoin-like datasets (Bitcoin, Bitcoin Cash, Dash, Dogecoin, Litecoin and Zcash) together because they all have similar implementations, i.e., their source code is derived from Bitcoin’s. Similarly, we’re also releasing the Ethereum Classic dataset alongside the previously published Ethereum dataset, and Ethereum Classic is also using the same common schema.
All datasets update every 24 hours via a common codebase, the Blockchain ETL ingestion framework (built with Cloud Composer, previously described here), to accommodate a variety of Bitcoin-like cryptocurrencies. While this means higher latency for loading Bitcoin blocks into BigQuery, it also means that:
We are able to ingest additional BigQuery datasets with less effort, meaning additional datasets can be onboarded more quickly in the future. We can implement a low-latency loading solution once that can be used to enable real-time streaming transactions for all blockchains.
Since we provided the original Bitcoin dataset last year, we’ve learned how users want to access data, and restructured the dataset accordingly. Some of these changes address performance and convenience concerns, yielding faster and lower cost queries (commonly accessed nested data are denormalized; each table is partitioned by time).
We’ve also included more data, such as script op-codes. Most Bitcoin transactions describe transfers of value not simply as a debit/credit pair, but rather as a series of functions that describe both simple transfers and more complex transactions.
Having these scripts available for Bitcoin-like datasets enables more advanced analyses similar to this smart contract analyzer that Tomasz Kolinko recently built on top of the BigQuery Ethereum dataset. For example, we can now identify and report on patterns of activity involving multi-signature wallets. This is particularly important for analyzing privacy-oriented cryptocurrencies like Zcash.
For analytics interoperability, we designed an unified schema that allows all Bitcoin-like datasets to share queries. To further interoperate with Ethereum and ERC-20 token transactions, we also created some views that abstract the blockchain ledger to be presented as a double-entry accounting ledger.
To get the best out of this lab you should have some:
Read these instructions. Labs are timed and you cannot pause them. The timer, which starts when you click Start Lab, shows how long Google Cloud resources are made available to you.
This hands-on lab lets you do the lab activities in a real cloud environment, not in a simulation or demo environment. It does so by giving you new, temporary credentials you use to sign in and access Google Cloud for the duration of the lab.
To complete this lab, you need:
Click the Start Lab button. If you need to pay for the lab, a dialog opens for you to select your payment method. On the left is the Lab Details pane with the following:
Click Open Google Cloud console (or right-click and select Open Link in Incognito Window if you are running the Chrome browser).
The lab spins up resources, and then opens another tab that shows the Sign in page.
Tip: Arrange the tabs in separate windows, side-by-side.
If necessary, copy the Username below and paste it into the Sign in dialog.
You can also find the Username in the Lab Details pane.
Click Next.
Copy the Password below and paste it into the Welcome dialog.
You can also find the Password in the Lab Details pane.
Click Next.
Click through the subsequent pages:
After a few moments, the Google Cloud console opens in this tab.

Open Navigation Menu > BigQuery.
The Welcome to BigQuery in the Cloud Console dialog box opens and click DONE.
Click + ADD DATA > Public Datasets.
In Search Marketplace, type bitcoin and press Enter.
Click Bitcoin Cash Cryptocurrency Dataset.
Click VIEW DATASET.
A new tab will open with BigQuery, and you should be on the bigquery-public-data:crypto_bitcoin_cash dataset.
All the public datasets are visible.
bigquery-public-data doesn't appear to the Explorer panel, then click on + ADD DATA > Star a project by name > Project name (bigquery-public-data) and Star.
crypto in the search field.Only the public datasets starting with crypto will be displayed.
In this task, you will view the famous 10,000 bitcoin pizza purchase transaction. You can learn more by reading the Bitcoin Pizza Day 2018 article.
You can see the raw data returned.
Points to note:
Click Check my progress to verify the objective.
In this task, you will check that you can access the cryptocurrency datasets by performing simple validation queries on two cryptocurrencies.
To motivate an initial exploration of these new datasets, let’s start with a simple example, comparing the way to query both payments and receipts across multiple cryptocurrencies. This comparison is the simplest way to verify that a cryptocurrency is operating as intended, and at least operationally, is a mathematically correct store of value.
In a new browser tab open the website https://www.blockchain.com/explorer/search?search=
It will say: What can we help you find?.
Return to the BigQuery window and copy (Ctrl+C) the top address value returned in BigQuery results.
Paste (Ctrl+V) the address value into the search box and click Search.
Check the final balance returned (in BTC) - it should be the same as the balance listed in BigQuery results for that address.
Click Check my progress to verify the objective.
In a new browser tab open the website https://dogechain.info/.
Return to the BigQuery window and copy the top address returned in BigQuery results.
Paste (Ctrl+V) the address value into the search box and click Search.
Note the balance returned, it should be the same as the balance listed in BigQuery results for that address.
Notice that the only difference between them is the name of the data location. You can swap in Bitcoin Cash, Dash, Litecoin, and Zcash in a similar fashion.
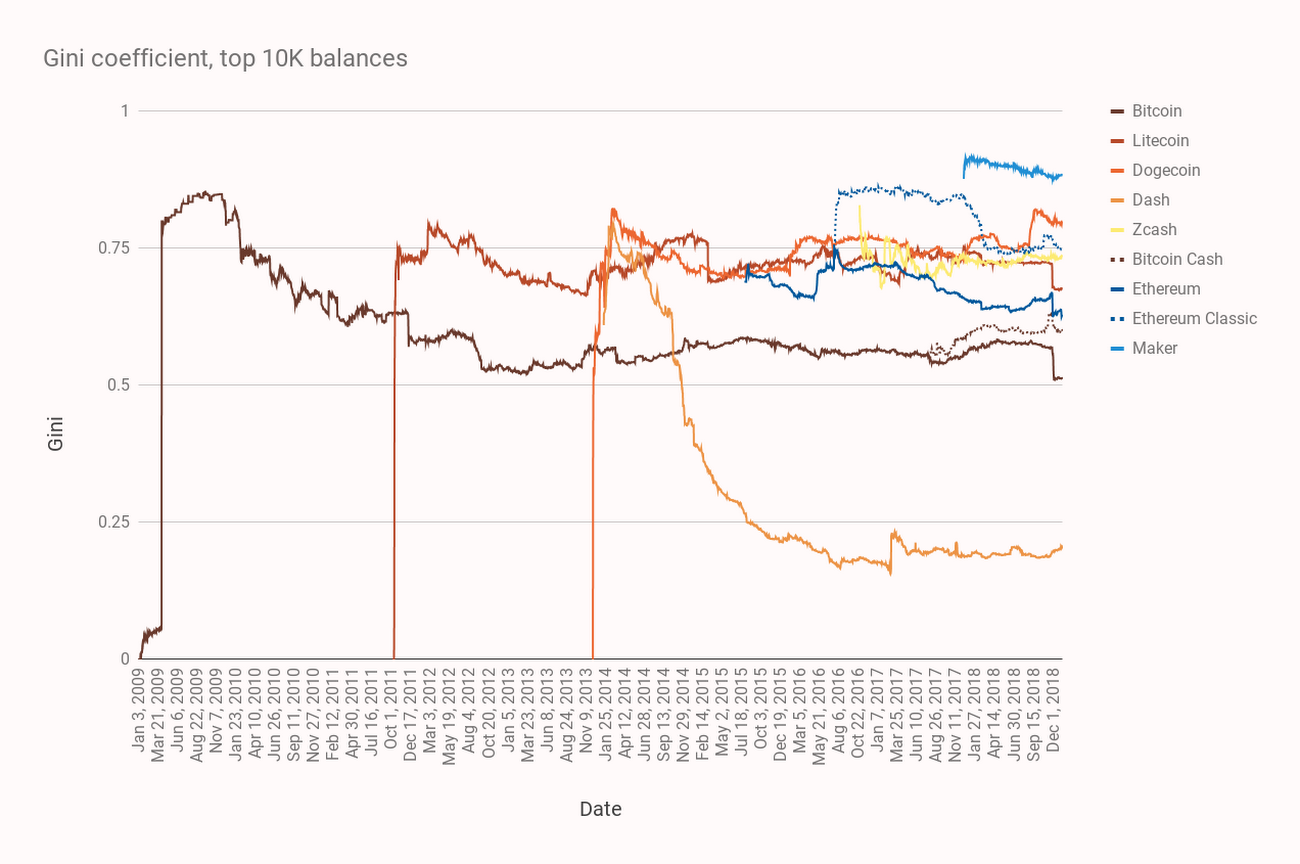
Beyond quality control and auditing applications, presenting cryptocurrency in a traditional format enables integration with other financial data management systems. As an example, let’s consider a common economic measure, the Gini Coefficient. In the field of macroeconomics, the Gini Coefficient is a member of a family of econometric measures of wealth inequality. Values range between 0.0 and 1.0, with completely distributed wealth (all members have the same amount) mapping to a value of 0.0 and completely accumulated wealth (one member has everything) mapping to 1.0.
Typically, the Gini Coefficient is estimated for a specific country’s economy based on data sampling or imputation. For crypto-economies, we have complete transparency of the data at the highest possible resolution.
In addition to data transparency, one of the purported benefits of cryptocurrencies is that they allow the implementation of money to more closely resemble the implementation of digital information. It follows that a fully digitized money network will come to resemble the internet, with reduced transactional friction and fewer barriers that impede capital flow. Frequently, implicit in this narrative is that capital will distribute more equally. But we don’t always observe that particular outcome, and the crypto-assets presented here display a broad spectrum of distribution patterns over time. You can read more about using the Gini coefficient to reason about crypto-economic network performance in Quantifying Decentralization.
To set a baseline to interpret our findings, consider how resources are distributed in traditional, non-crypto economies. According to a World Bank analysis in 2013, recent Gini coefficients for world economies have a mean value of 39.6 (with a standard deviation of 9.6).
In this next query you will calculate the gini coefficient of dash, on a week-by-week basis. This query will take about 3 minutes to execute. Once you have the data you can easily visualize the graph and compare it with the one generated for the source article.
In the Query Results ribbon, click Save Results and select BigQuery table
In the Save to BigQuery Table, leave the project as it is, select the lab Dataset and name the Table, such as dash_gini and then press Save. After it finishes, click Go To Table.
In the Table view, click Open in and select Looker Studio. Then click Authorize in the Requesting Authorization prompt.
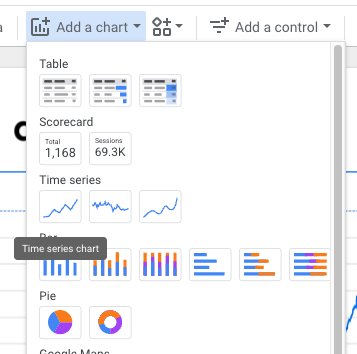
When Looker Studio comes up, delete the automatically generated charts (select them and press the Delete key). Click Add a chart on the top menu bar. Under Time Series, select Time series chart.
Change the metric to gini.
Compare the graph with the original source article graph (reproduced below). In the chart below you are looking for the brown line. Starting in December 2019, see how it's changed since then.
There is a blog post on the Blockchain site that describes a number of memorable events in bitcoin. You will perform two queries on the bitcoin public dataset to retrieve the data in a couple of those events.
In the fall of 2013, a 194,993 bitcoin transaction hit the network, which caused many to wonder who was behind this very large transaction. The value at the time of the transaction in USD was over $149 million. CoinDesk wrote "unsurprisingly, a transaction of that size has prompted the bitcoin community to do some analysis and detective work. The transaction involved a large number of sending addresses, with some of them from blocks mined in February 2010 or even earlier, prompting excited speculation they might be from Satoshi Nakamoto, bitcoin’s absent (and likely pseudonymous) founder."
transaction_hash for transfer of 194993 bitcoins (BTC) and write that data to a table called 51 in the dataset lab. Below is SQL to help you get started:This will require you to understand the structure of the transactions table, or you can use the outputs view. Your query must return the transaction hash, other fields are not important.
Click Check my progress to verify the objective.
The output must have the balance for the address.
Here is some SQL to start you off:
Click Check my progress to verify the objective.
...helps you make the most of Google Cloud technologies. Our classes include technical skills and best practices to help you get up to speed quickly and continue your learning journey. We offer fundamental to advanced level training, with on-demand, live, and virtual options to suit your busy schedule. Certifications help you validate and prove your skill and expertise in Google Cloud technologies.
Manual last updated July 01, 2025
Lab last tested July 01, 2025
Copyright 2025 Google LLC. All rights reserved. Google and the Google logo are trademarks of Google LLC. All other company and product names may be trademarks of the respective companies with which they are associated.


This content is not currently available
We will notify you via email when it becomes available

Great!
We will contact you via email if it becomes available

One lab at a time
Confirm to end all existing labs and start this one