In this lab you learn the process of analyzing a dataset stored in BigQuery using Colab Enterprise to perform queries and present the data using various statistical plotting techniques. The analysis will help you discover patterns in the data.
Learning objectives
Create a Colab Enterprise Notebook
Connect to BigQuery datasets
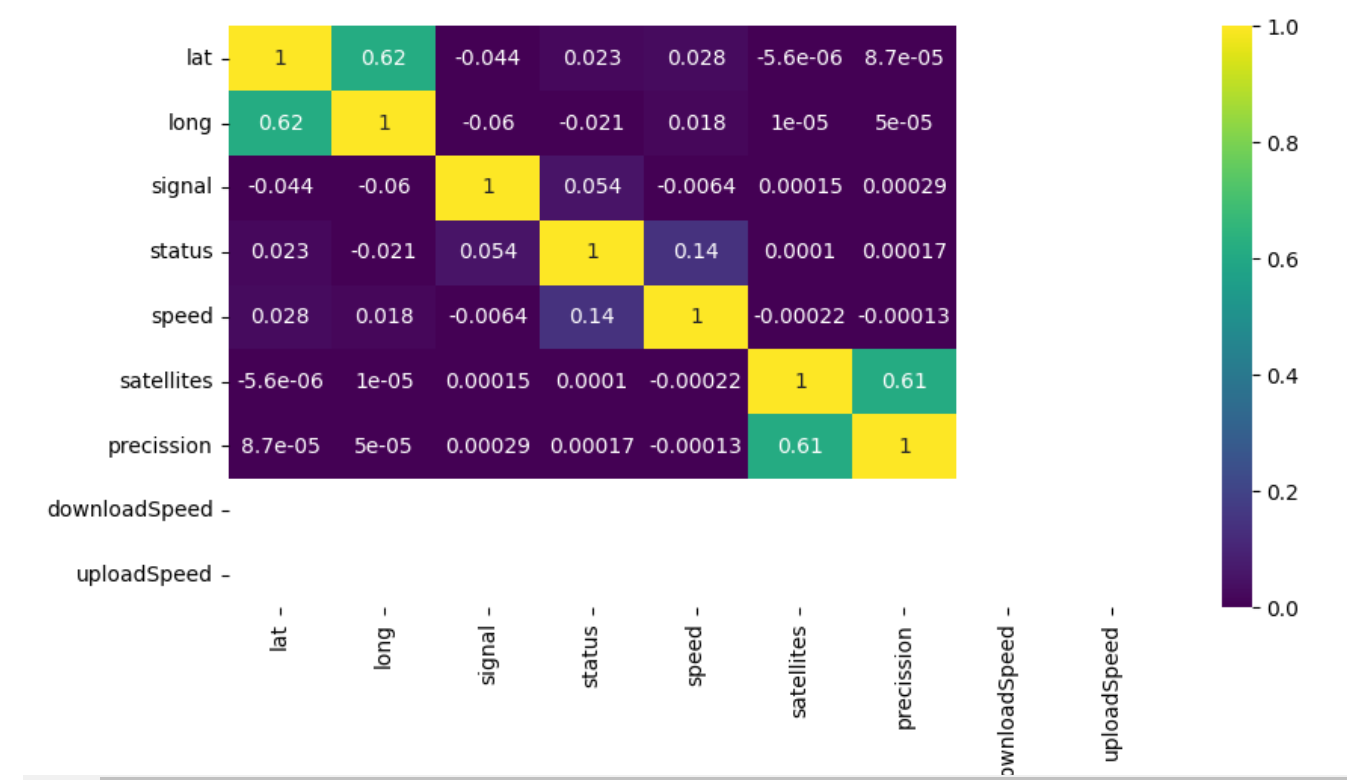
Perform statistical analyis on a Pandas Dataframe
Create Seaborn plots for Exploratory Data Analysis in Python
Write a SQL query to pick up specific fields from a BigQuery dataset
Use version history to see code changes
Share a Colab Enterprise notebook
Vertex AI is a unified platform for building, deploying, and managing machine learning (ML) applications.
Vertex AI Colab Enterprise is a powerful collaborative interactive tool created to explore, analyze, transform and visualize data and build machine learning models on Google Cloud. It offers the security and compliance features needed for enterprise organizations and integrates with other Google Cloud services like Vertex AI and BigQuery for an enhanced data science and machine learning workflow.
BigQuery is a powerful, fully managed, serverless data warehouse that allows you to analyze and manage large datasets with ease. BigQuery uses a familiar standard SQL dialect, making it easy for analysts and data scientists to use without needing to learn a new language.
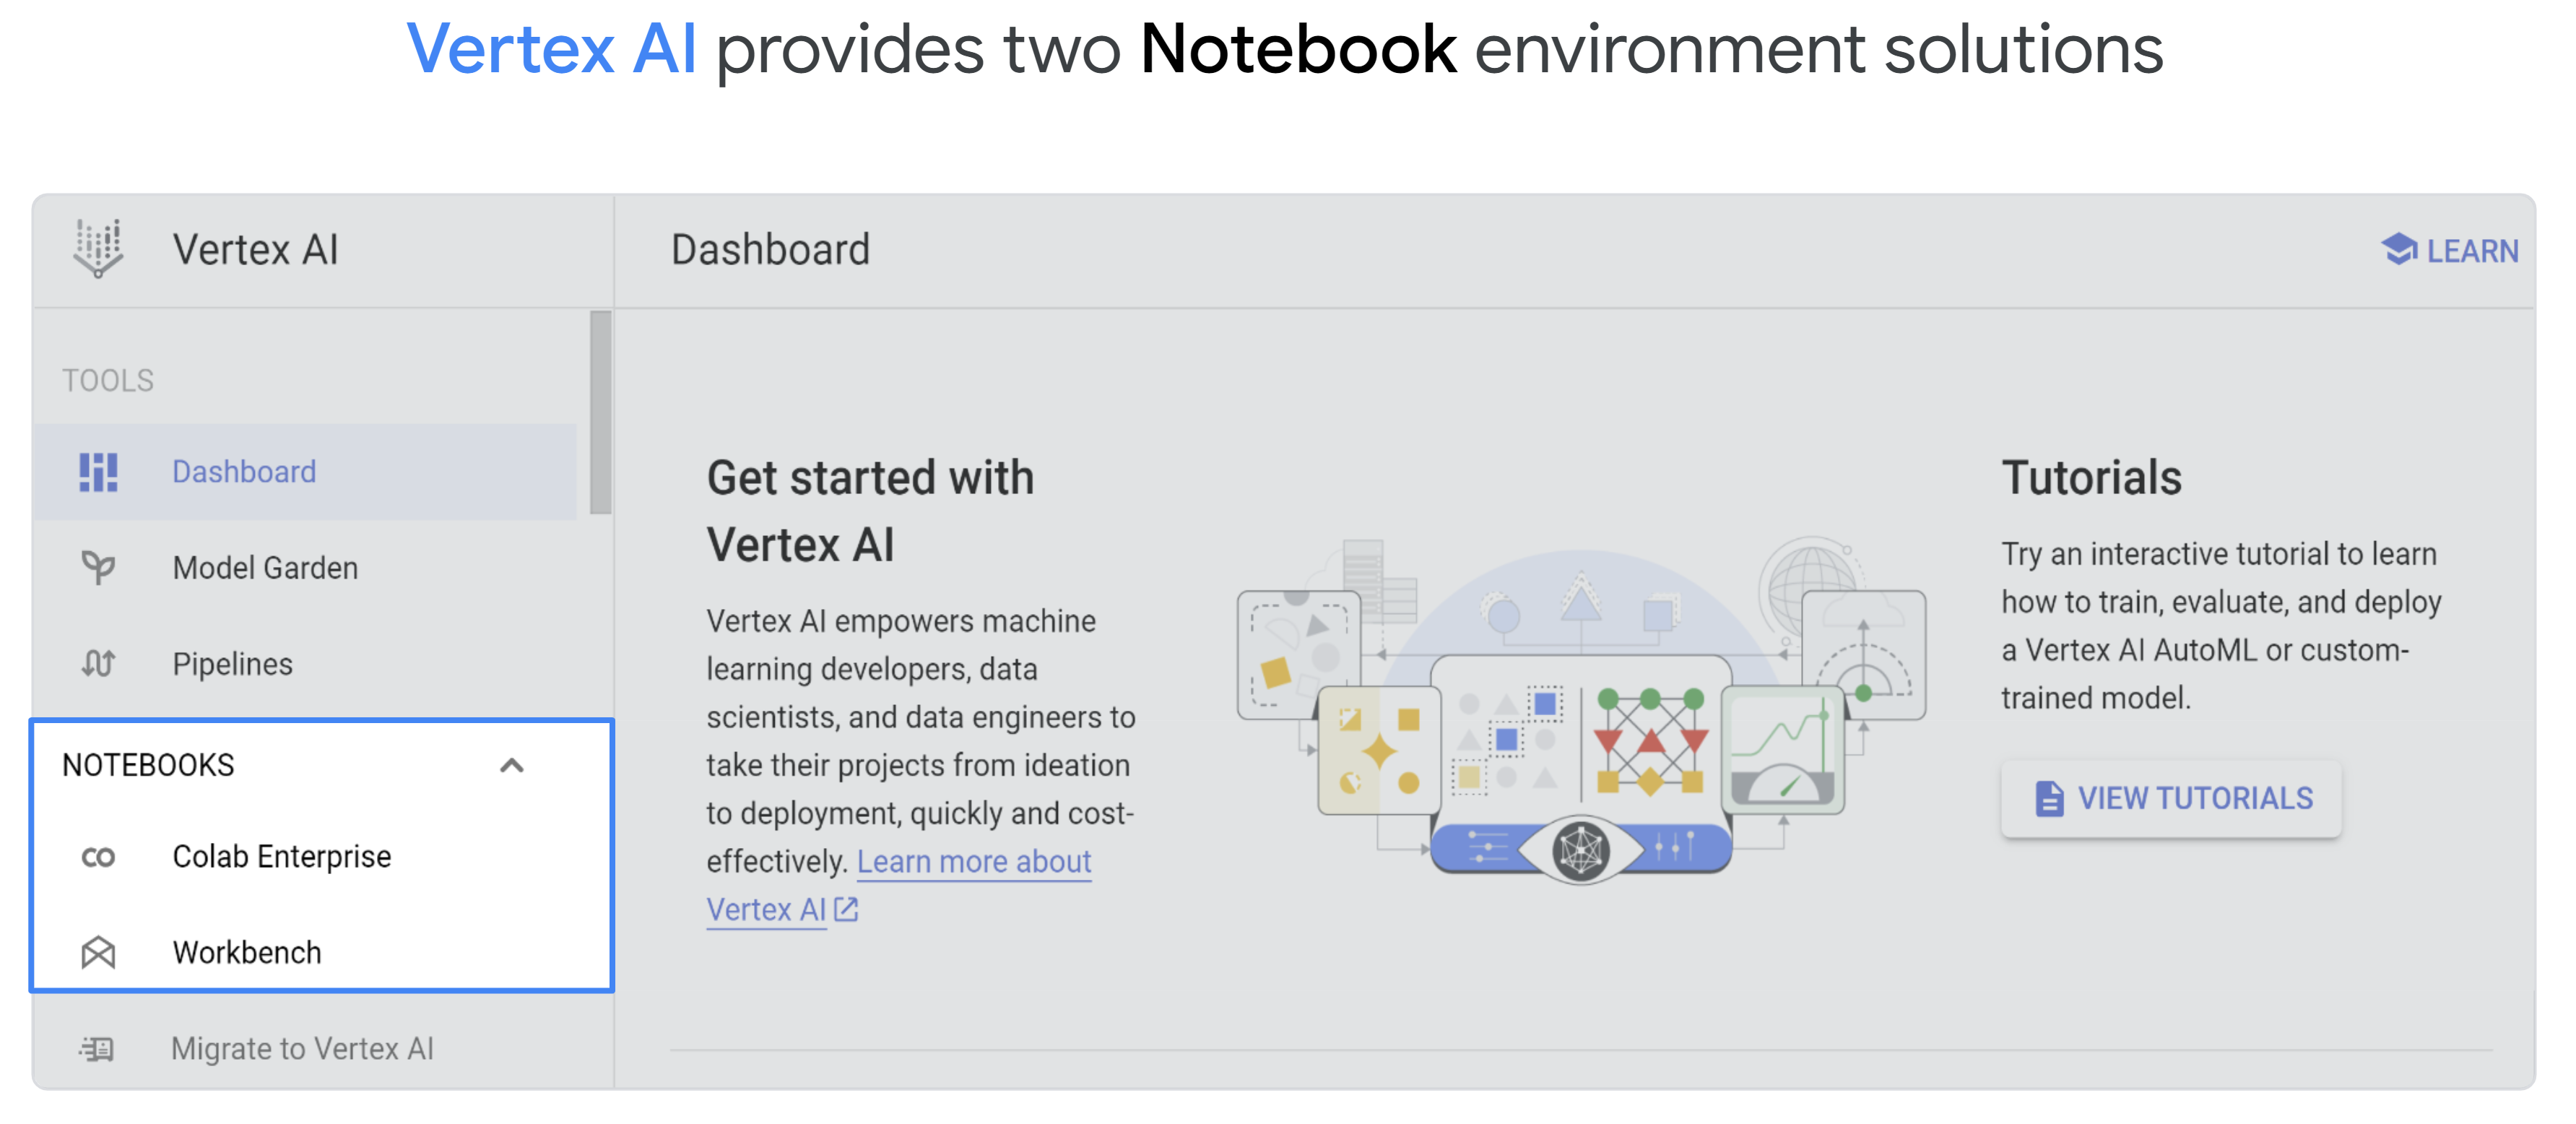
Vertex AI offers two Notebook Solutions, Workbench and Colab Enterprise.
Colab Enterprise
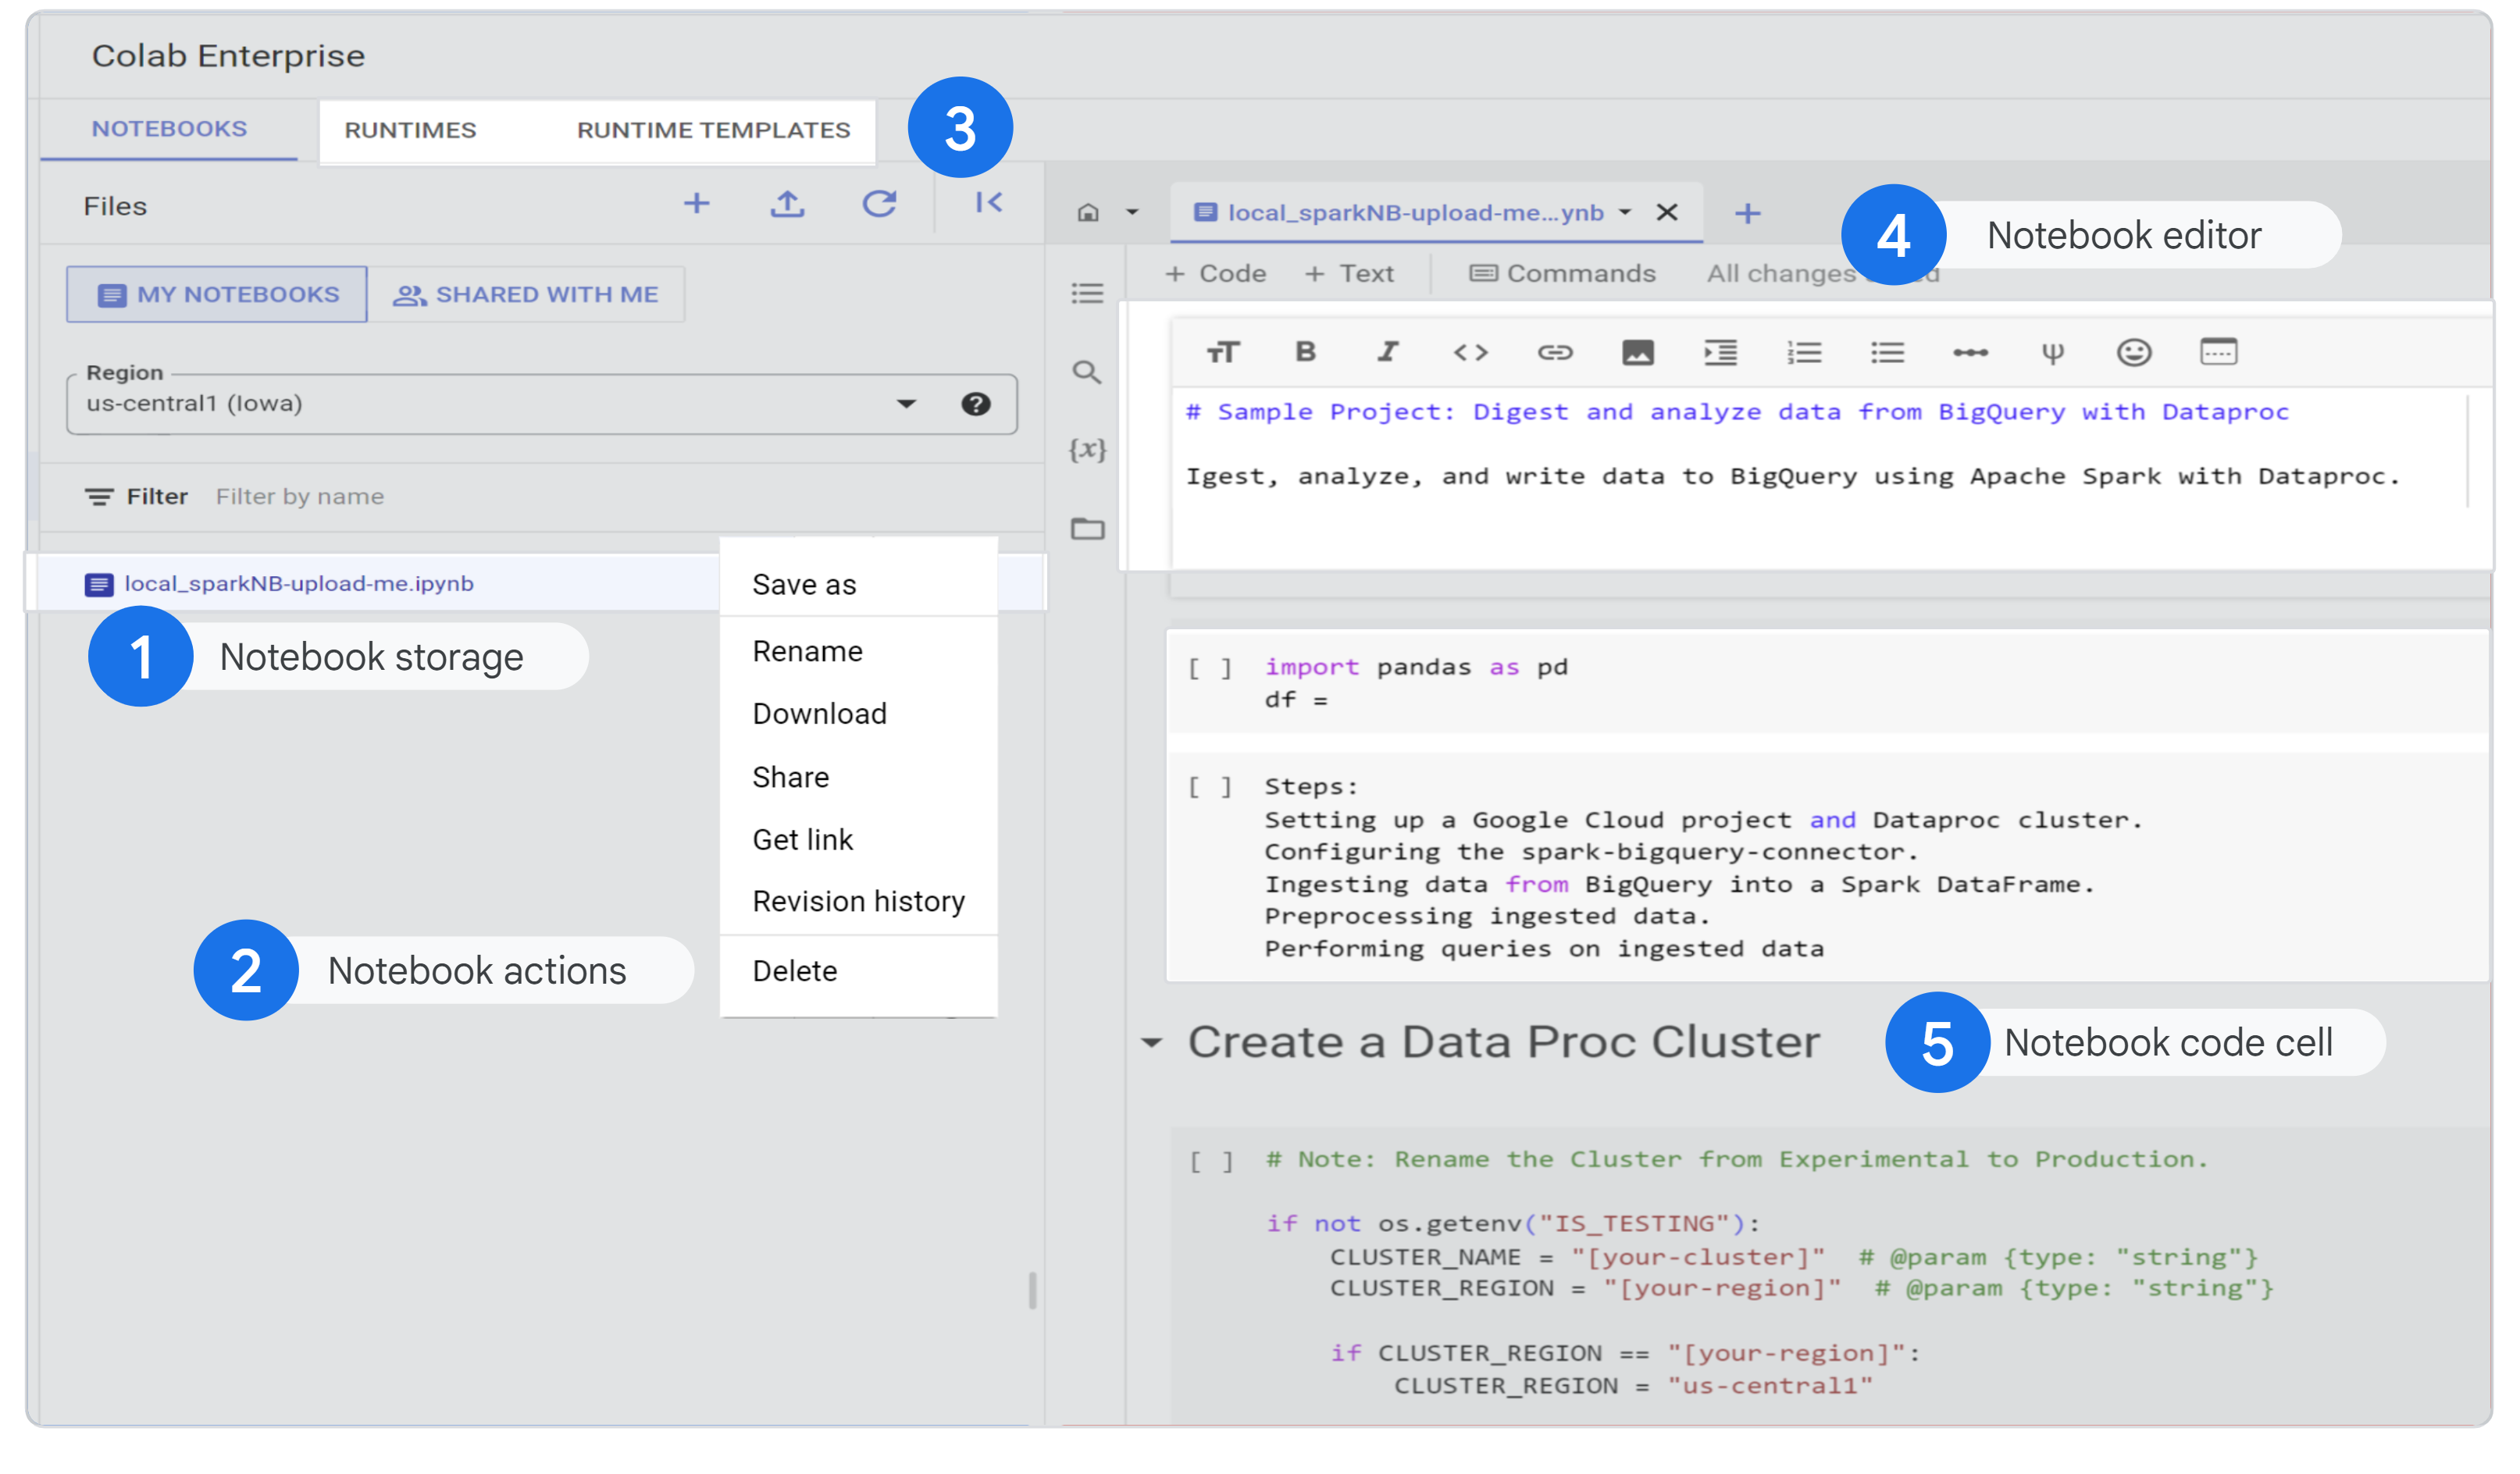
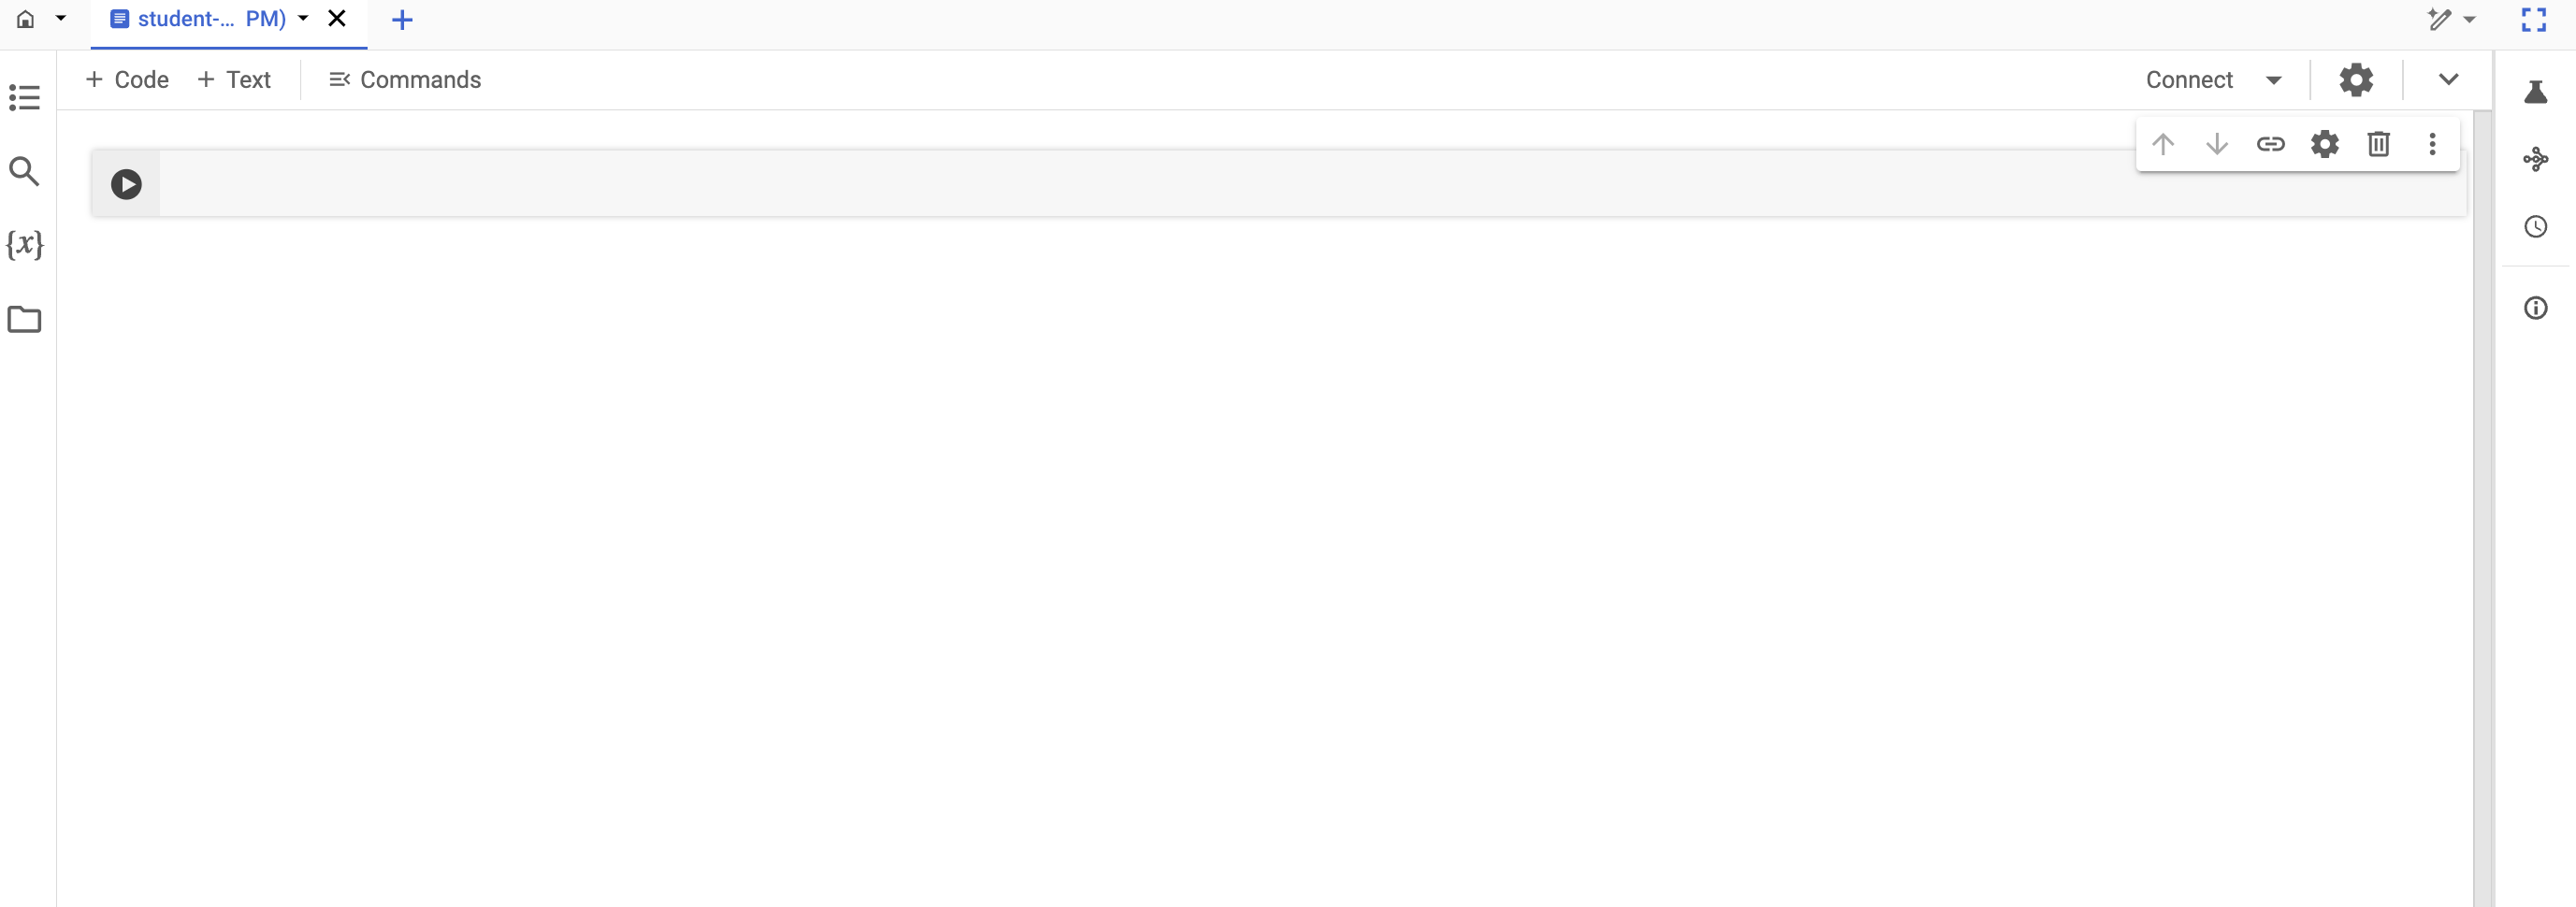
The Colab Enterprise worksspace consists of five major sections (as shown in the image below), (1) Notebook storage; (2) Notebook actions; (3) Runtimes and Runtimes templates, (4) Notebook editor and (4) Notebook code cells. Notebook storage is the location of the notebooks, notebook actions are actions that can be performed on a notebook, runtimes let you "run" the notebook, notebook editor is for making edits to the notebook, and code cells let's you enter code.
Set up your Qwiklabs environments
Qwiklabs setup
For each lab, you get a new Google Cloud project and set of resources for a fixed time at no cost.
Sign in to Qwiklabs using an incognito window.
Note the lab's access time (for example, 1:15:00), and make sure you can finish within that time.
There is no pause feature. You can restart if needed, but you have to start at the beginning.
When ready, click Start lab.
Note your lab credentials (Username and Password). You will use them to sign in to the Google Cloud Console.
Click Open Google Console.
Click Use another account and copy/paste credentials for this lab into the prompts.
If you use other credentials, you'll receive errors or incur charges.
Accept the terms and skip the recovery resource page.
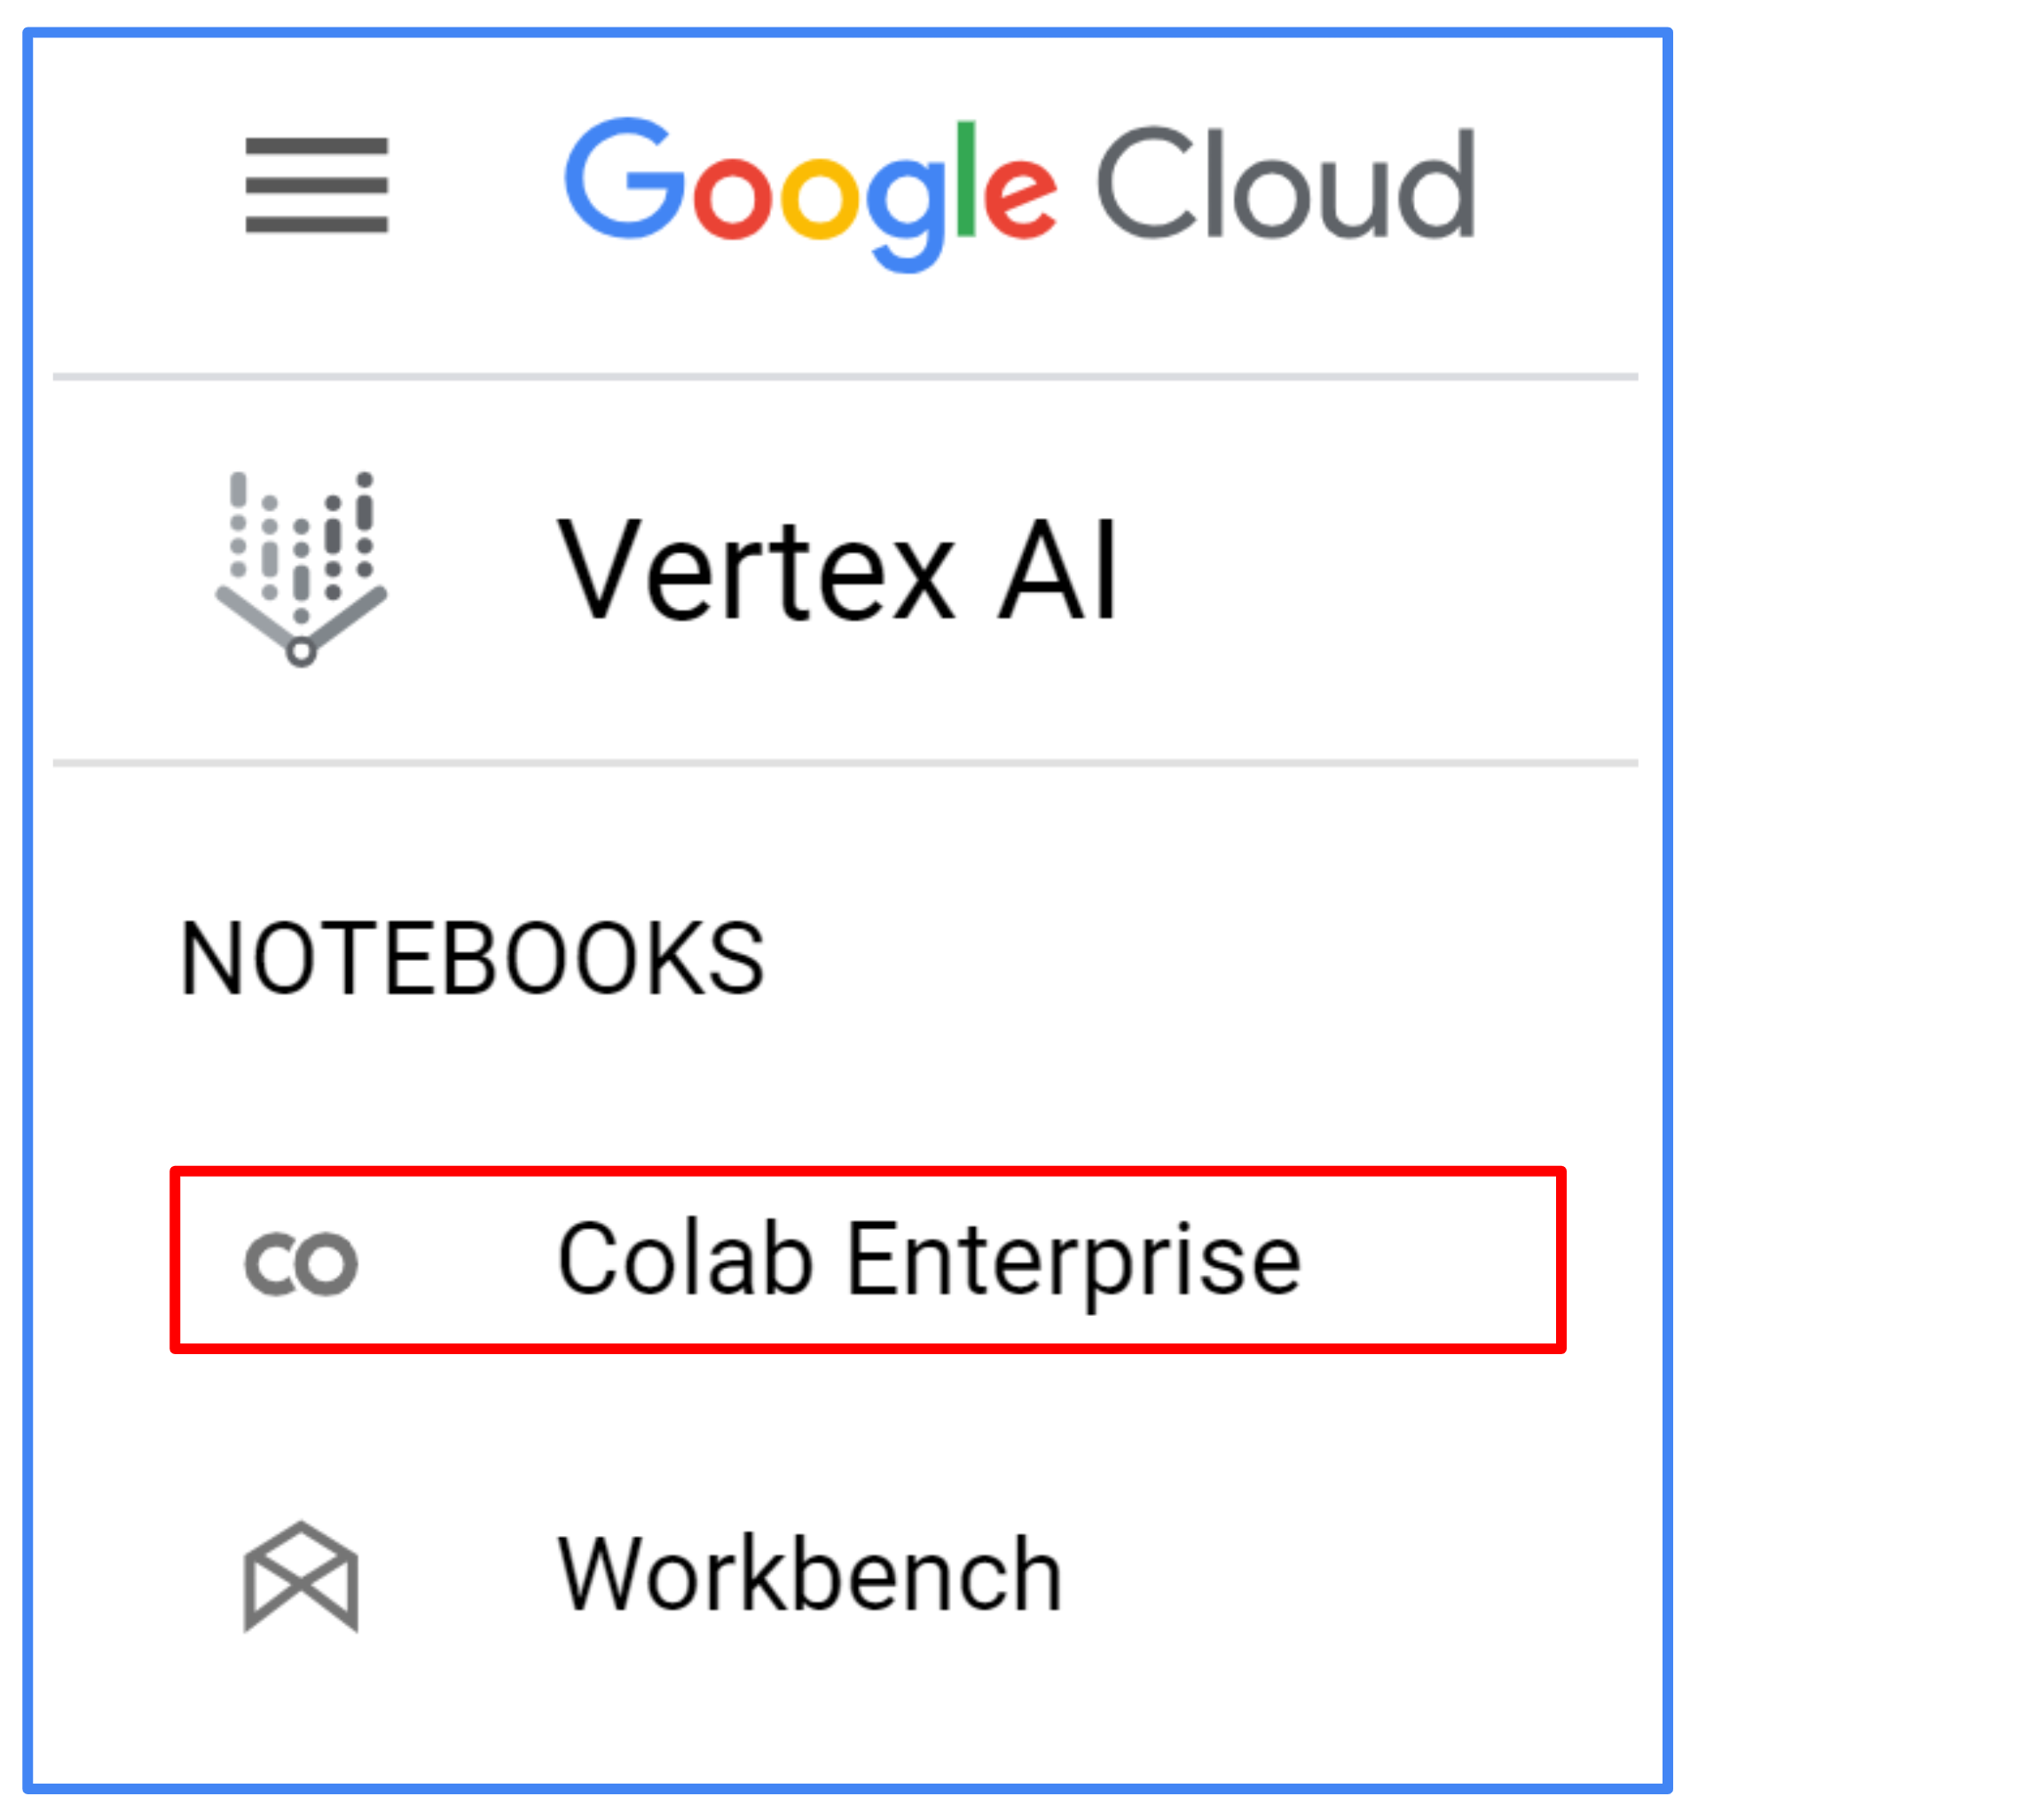
In the Vertex AI section, scroll down to Notebooks. Click Colab Enterprise.
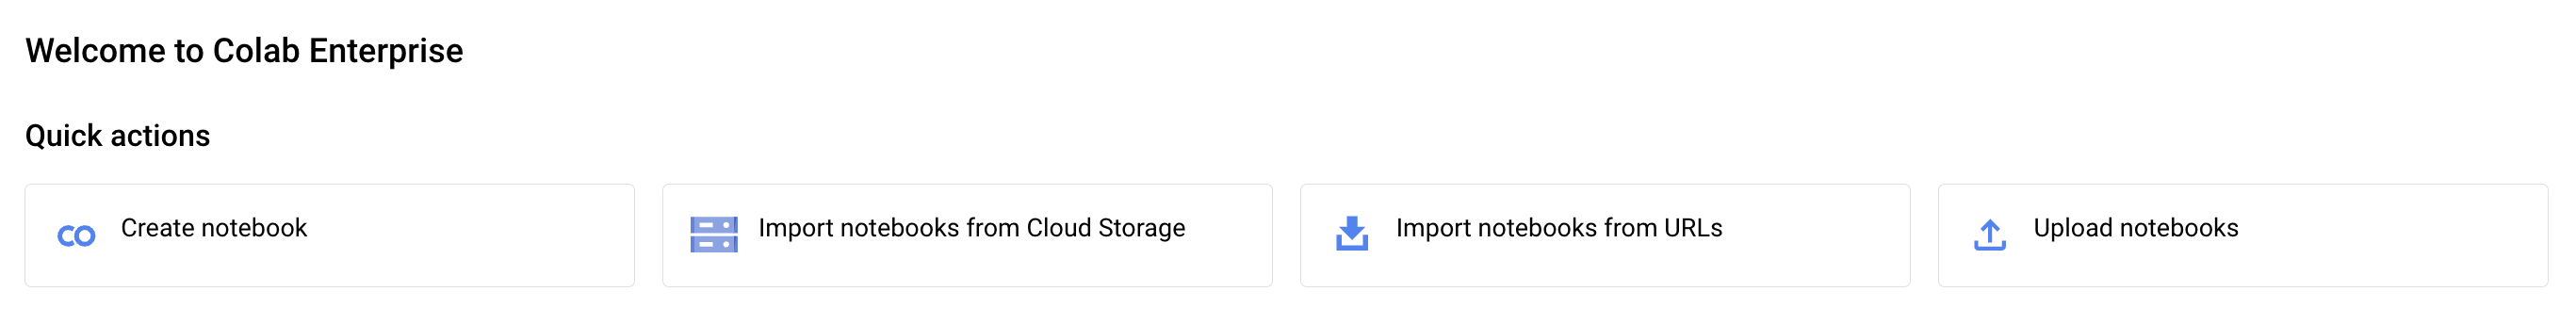
A "Welcome to Colab Enterprise" page then appears.
In the Region menu, select the region , where you create the notebook.
Click + CREATE NOTEBOOK in Quick actions section.
A new notebook will opened.
In order to execute the cells you need to create a runtime. Recall that runtimes are instances derived from runtime templates that allow users to run Colab notebooks. To create a runtime, you need to first create a runtime template.
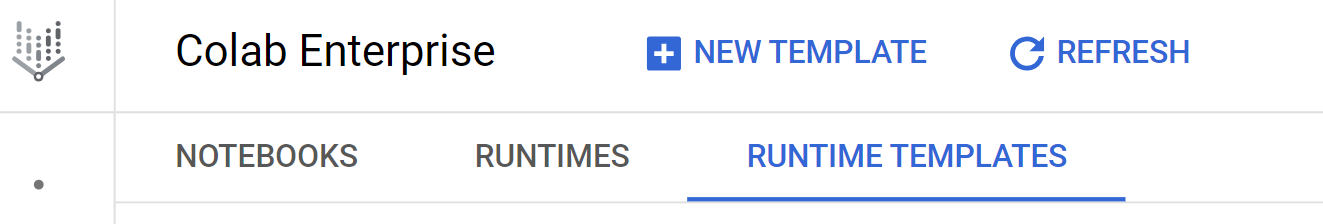
Click RUNTIME TEMPLATES. On the Runtime Templates page, click + NEW TEMPLATE.
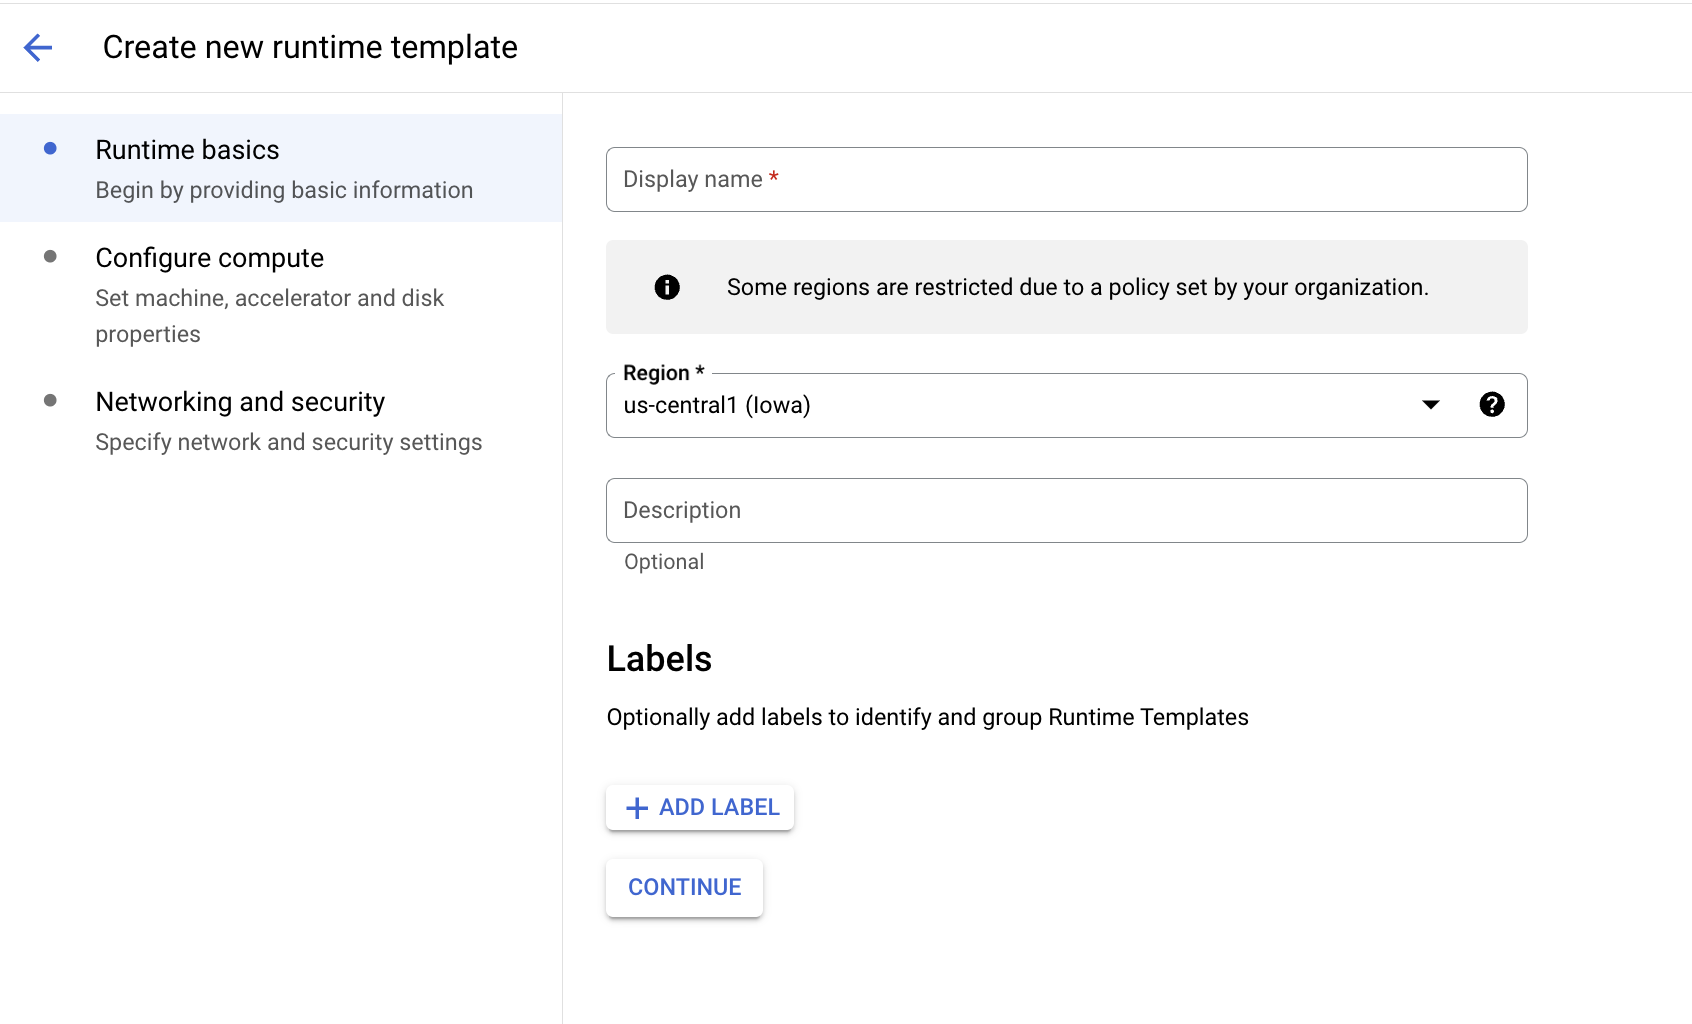
Runtime Basics
There are three steps. Step 2 and Step 3 are optional.
Step 1: Provide runtime basic information and select region as
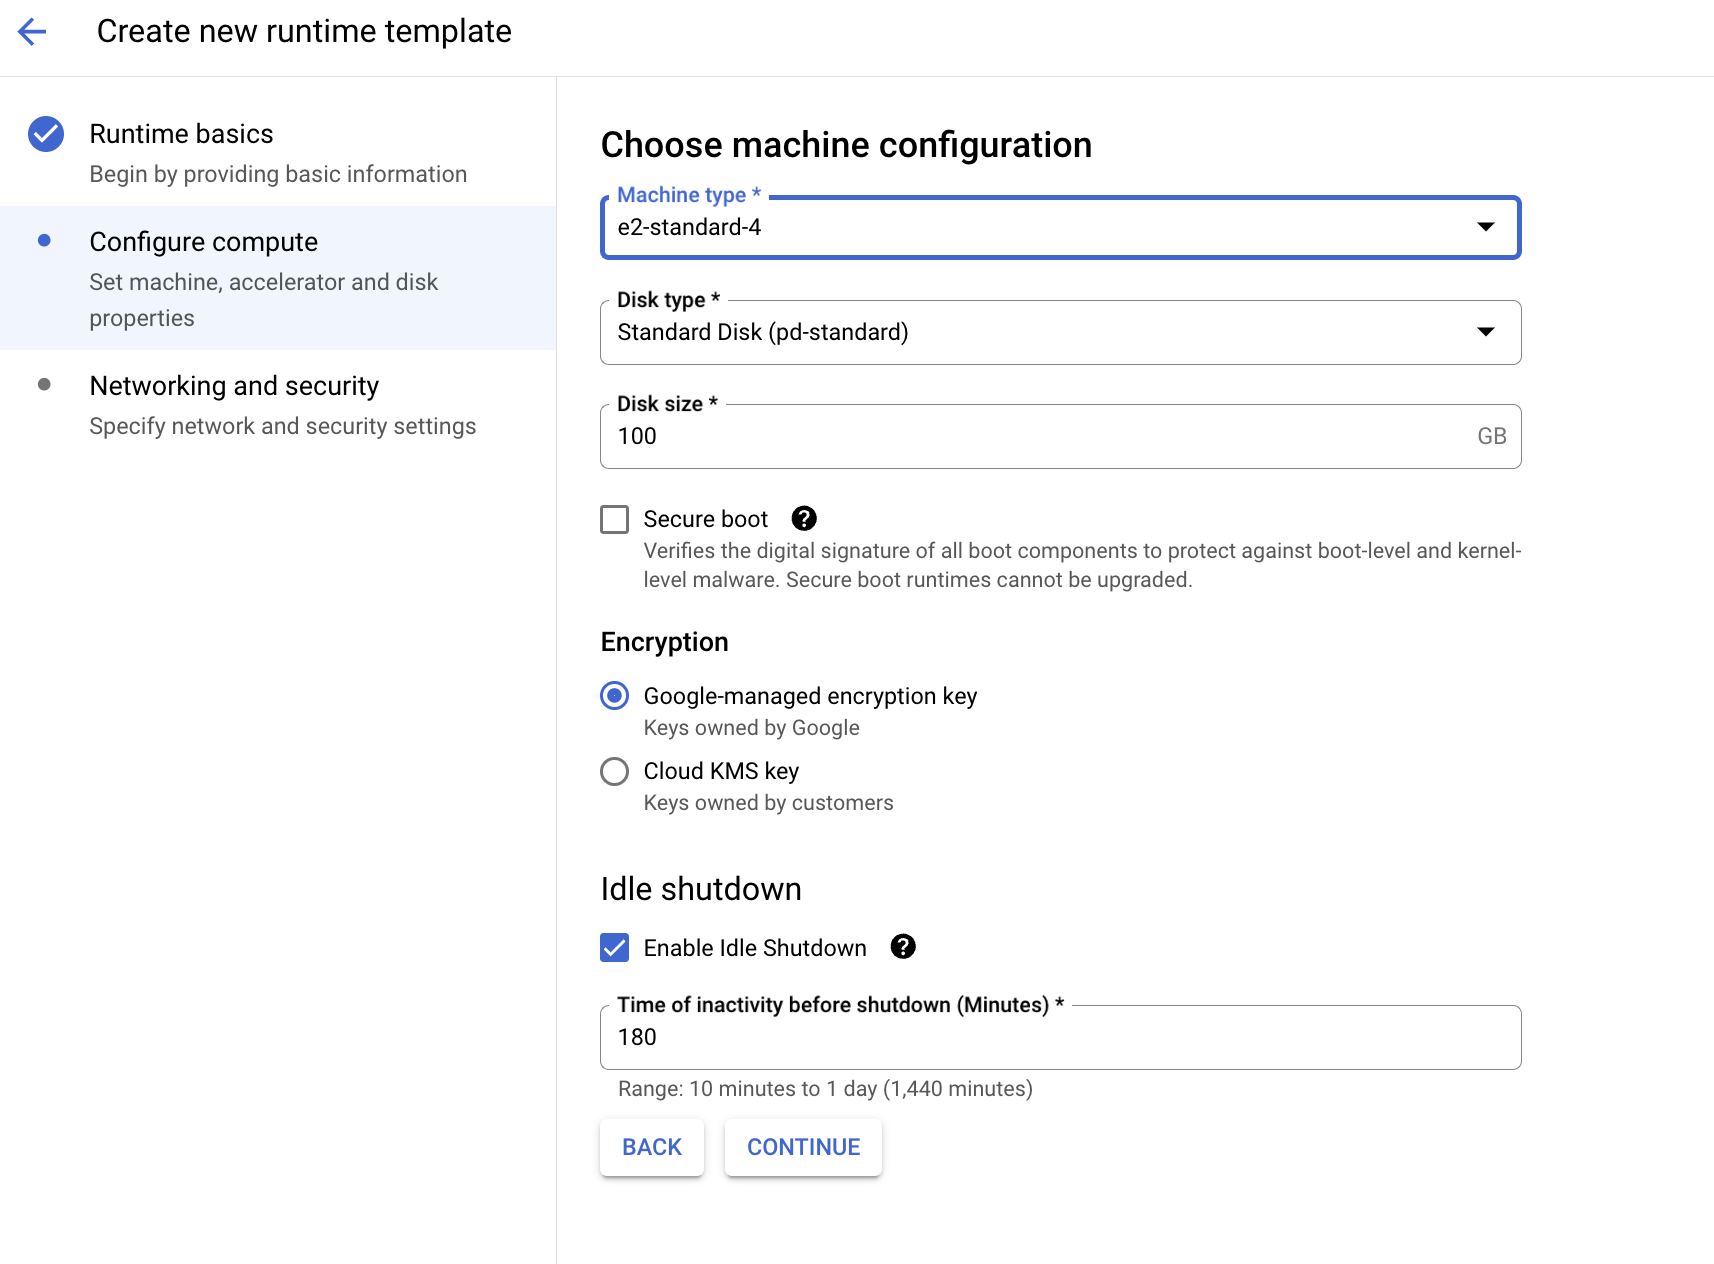
Compute Configure
Step 2: Configure Compute (Optional)
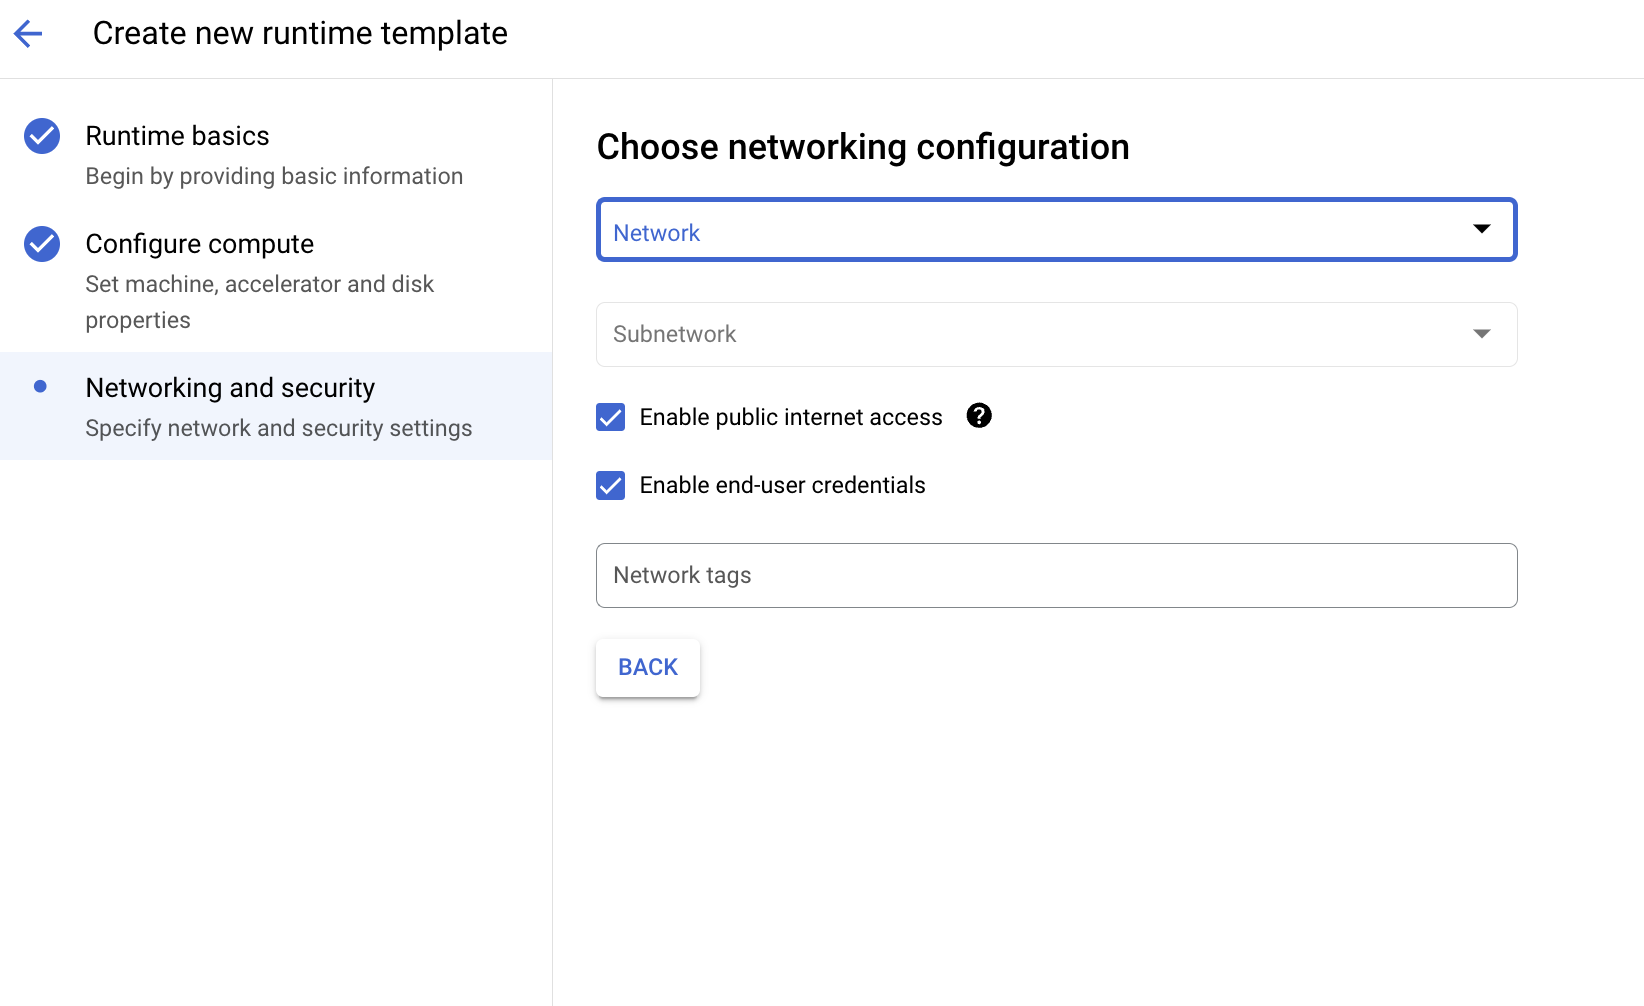
Networking and Security
Step 3: Networking and Security (Optional)
Click Create.
Task 3. Run Code in a Colab Enterprise Notebook
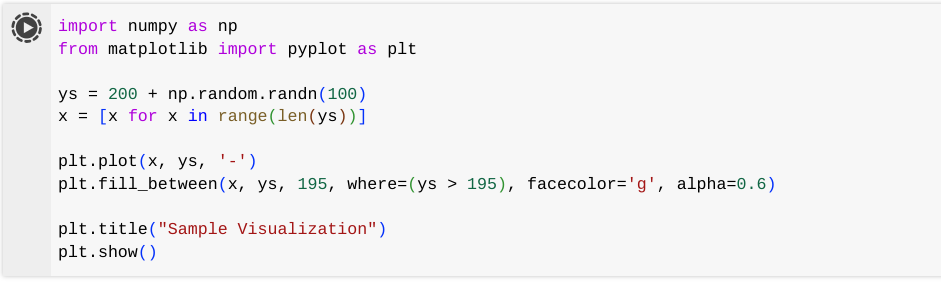
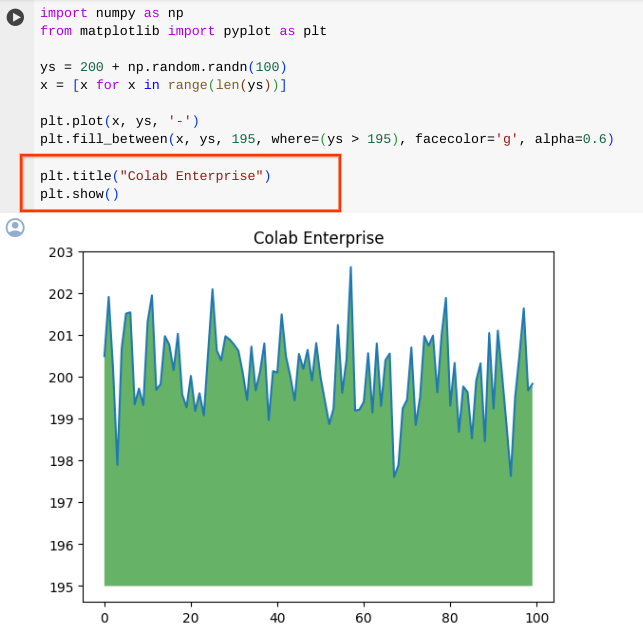
In this example, the code cell below “Getting Started” uses numpy to generate some random data and uses matplotlib to visualize it.
Click Colab Enterprise then click on your created Notebook.
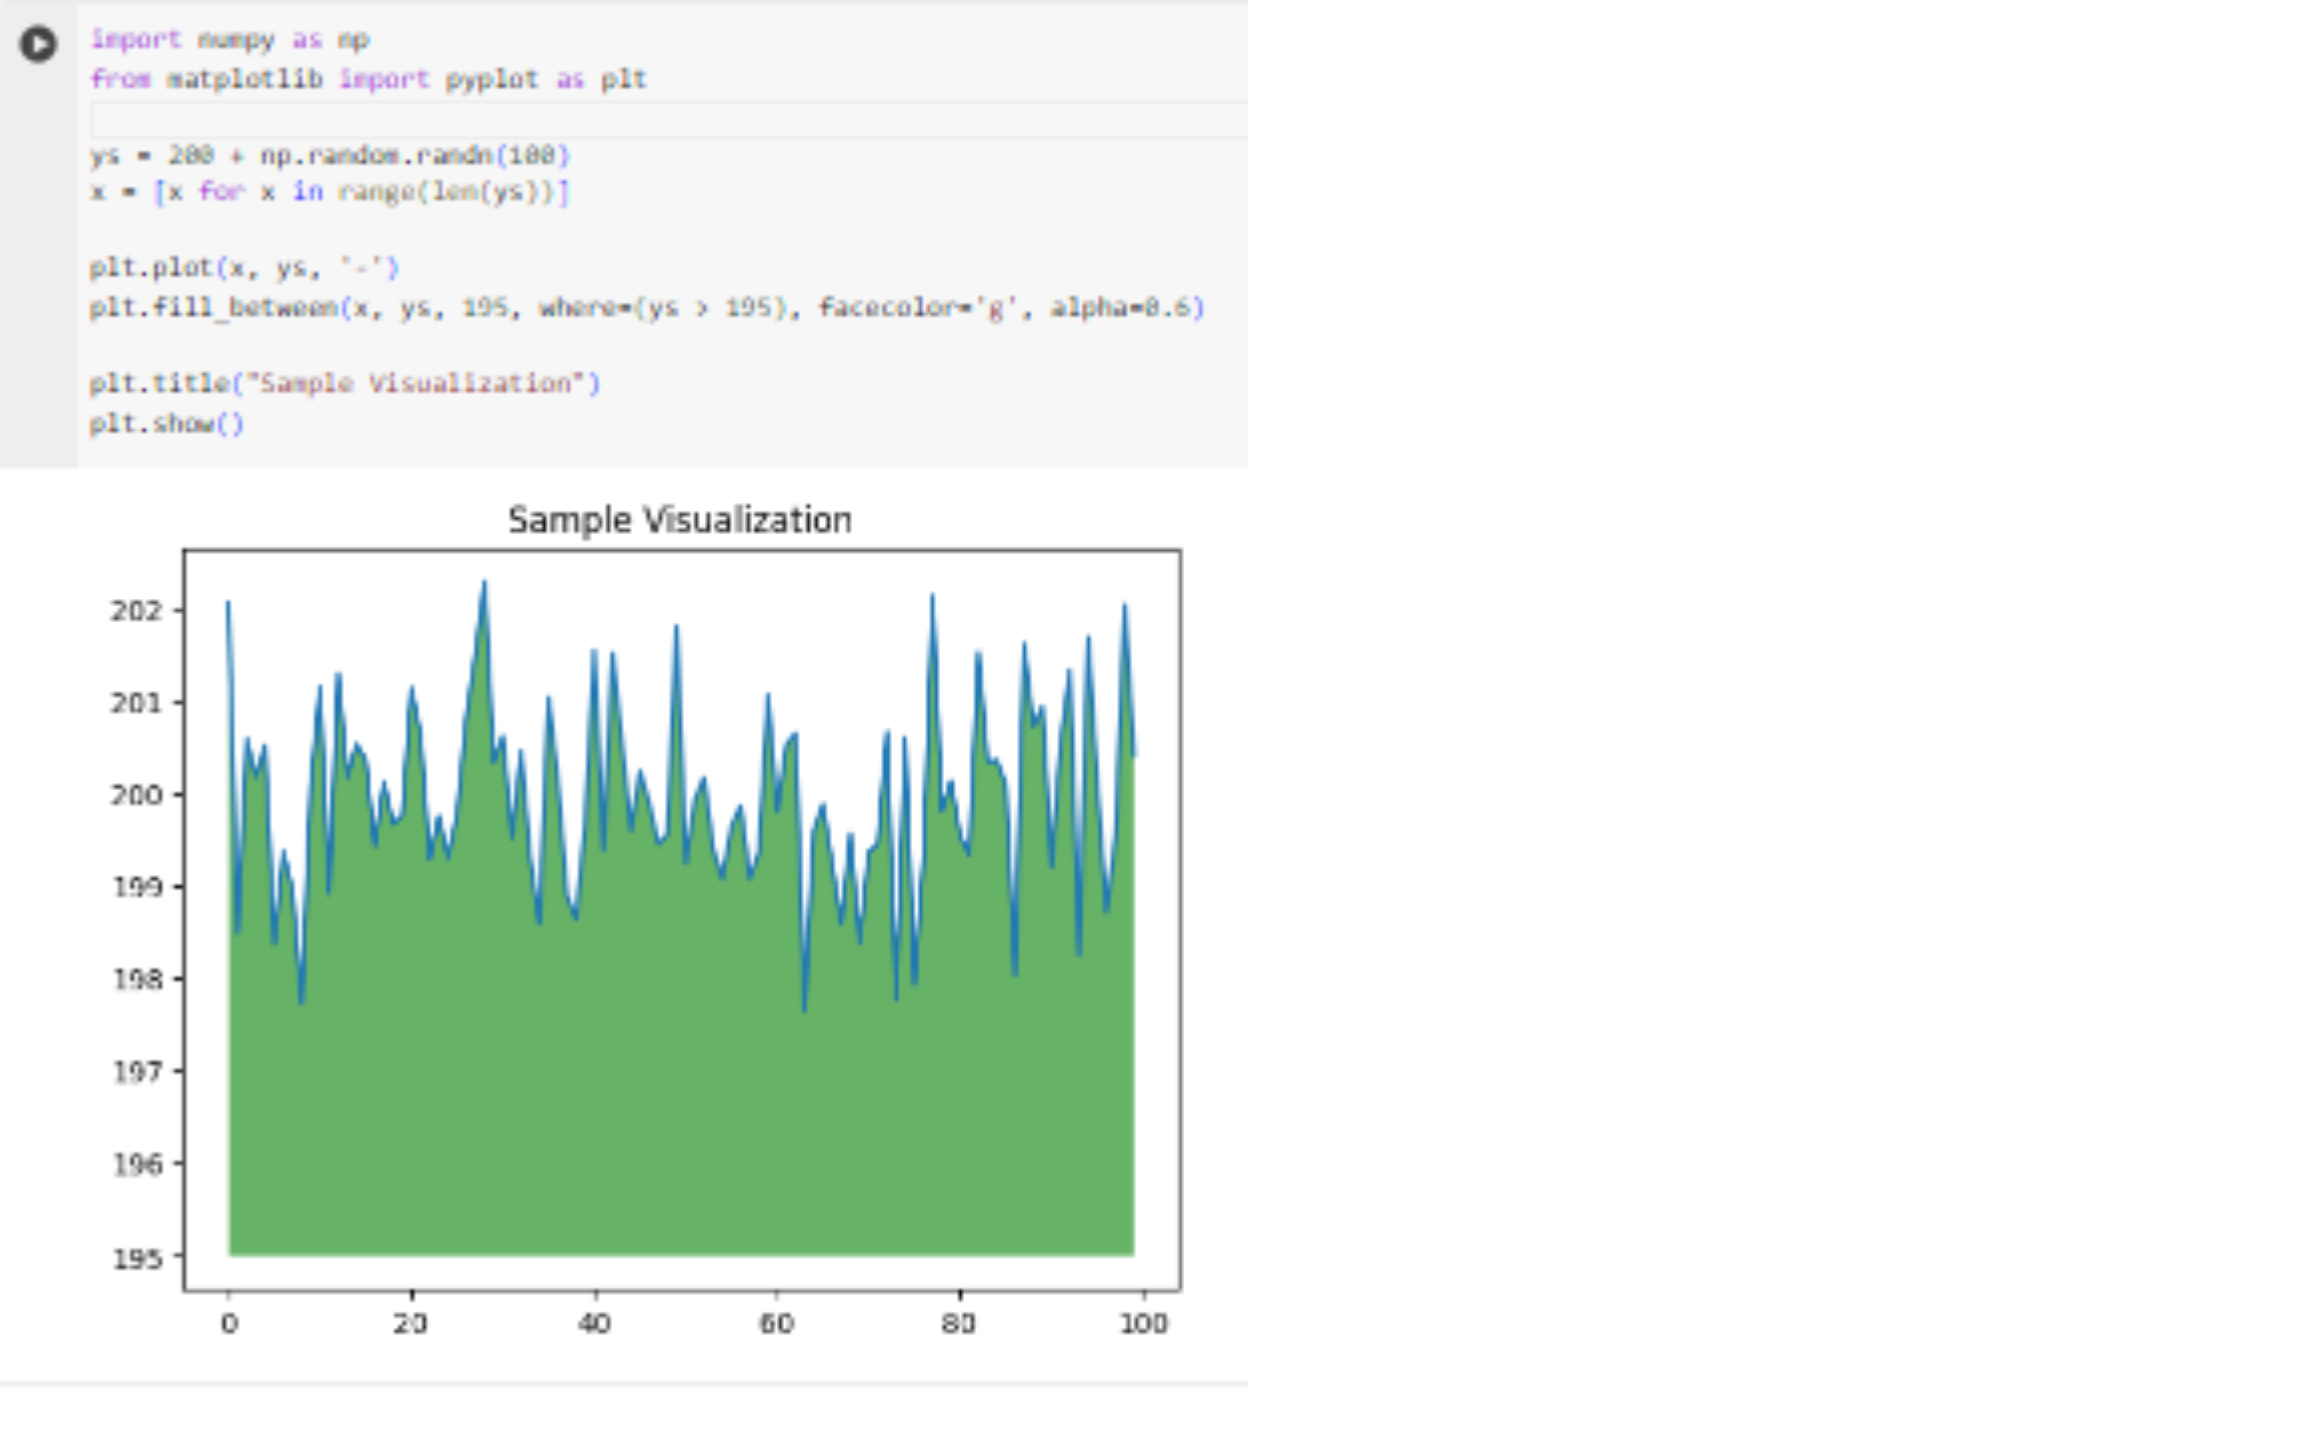
Copy the code below and click Run icon to run the cell.
import numpy as np
from matplotlib import pyplot as plt
ys = 200 + np.random.randn(100)
x = [x for x in range(len(ys))]
plt.plot(x, ys, '-')
plt.fill_between(x, ys, 195, where=(ys > 195), facecolor='g', alpha=0.6)
plt.title("Sample Visualization")
plt.show()
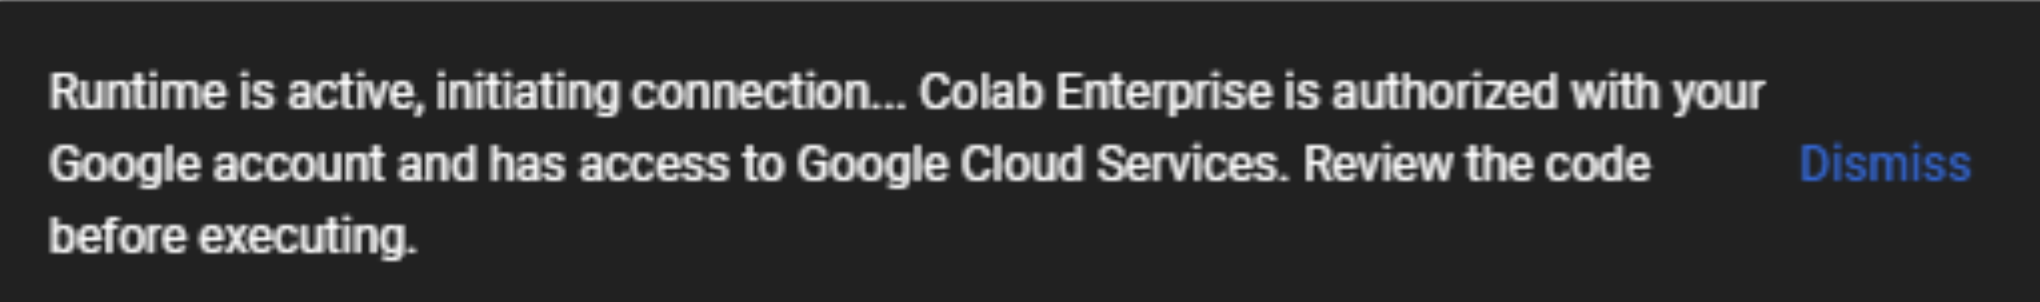
As you execute the cell, a massage pops up indicating that the runtime is active and initiating a connection - as shown in the image below.
Click Open for Open OAuth popup then select your User Name then click Allow.
Now check the cell you executed, there should be a green check mark next to, this indicates that the cell executed properly.
Now, make a change to the code - for example, change the title of the plot from "Sample Visualization" to "Colab Enterprise". Then, execute the cell.
Task 4. Show revision history
One of the most important features of software development is the ability to track version history.
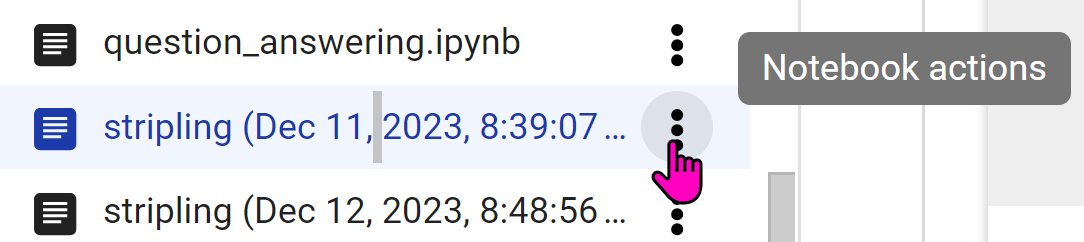
Go to the Notebook Storage section. Click on the three dots beside the notebook you created.
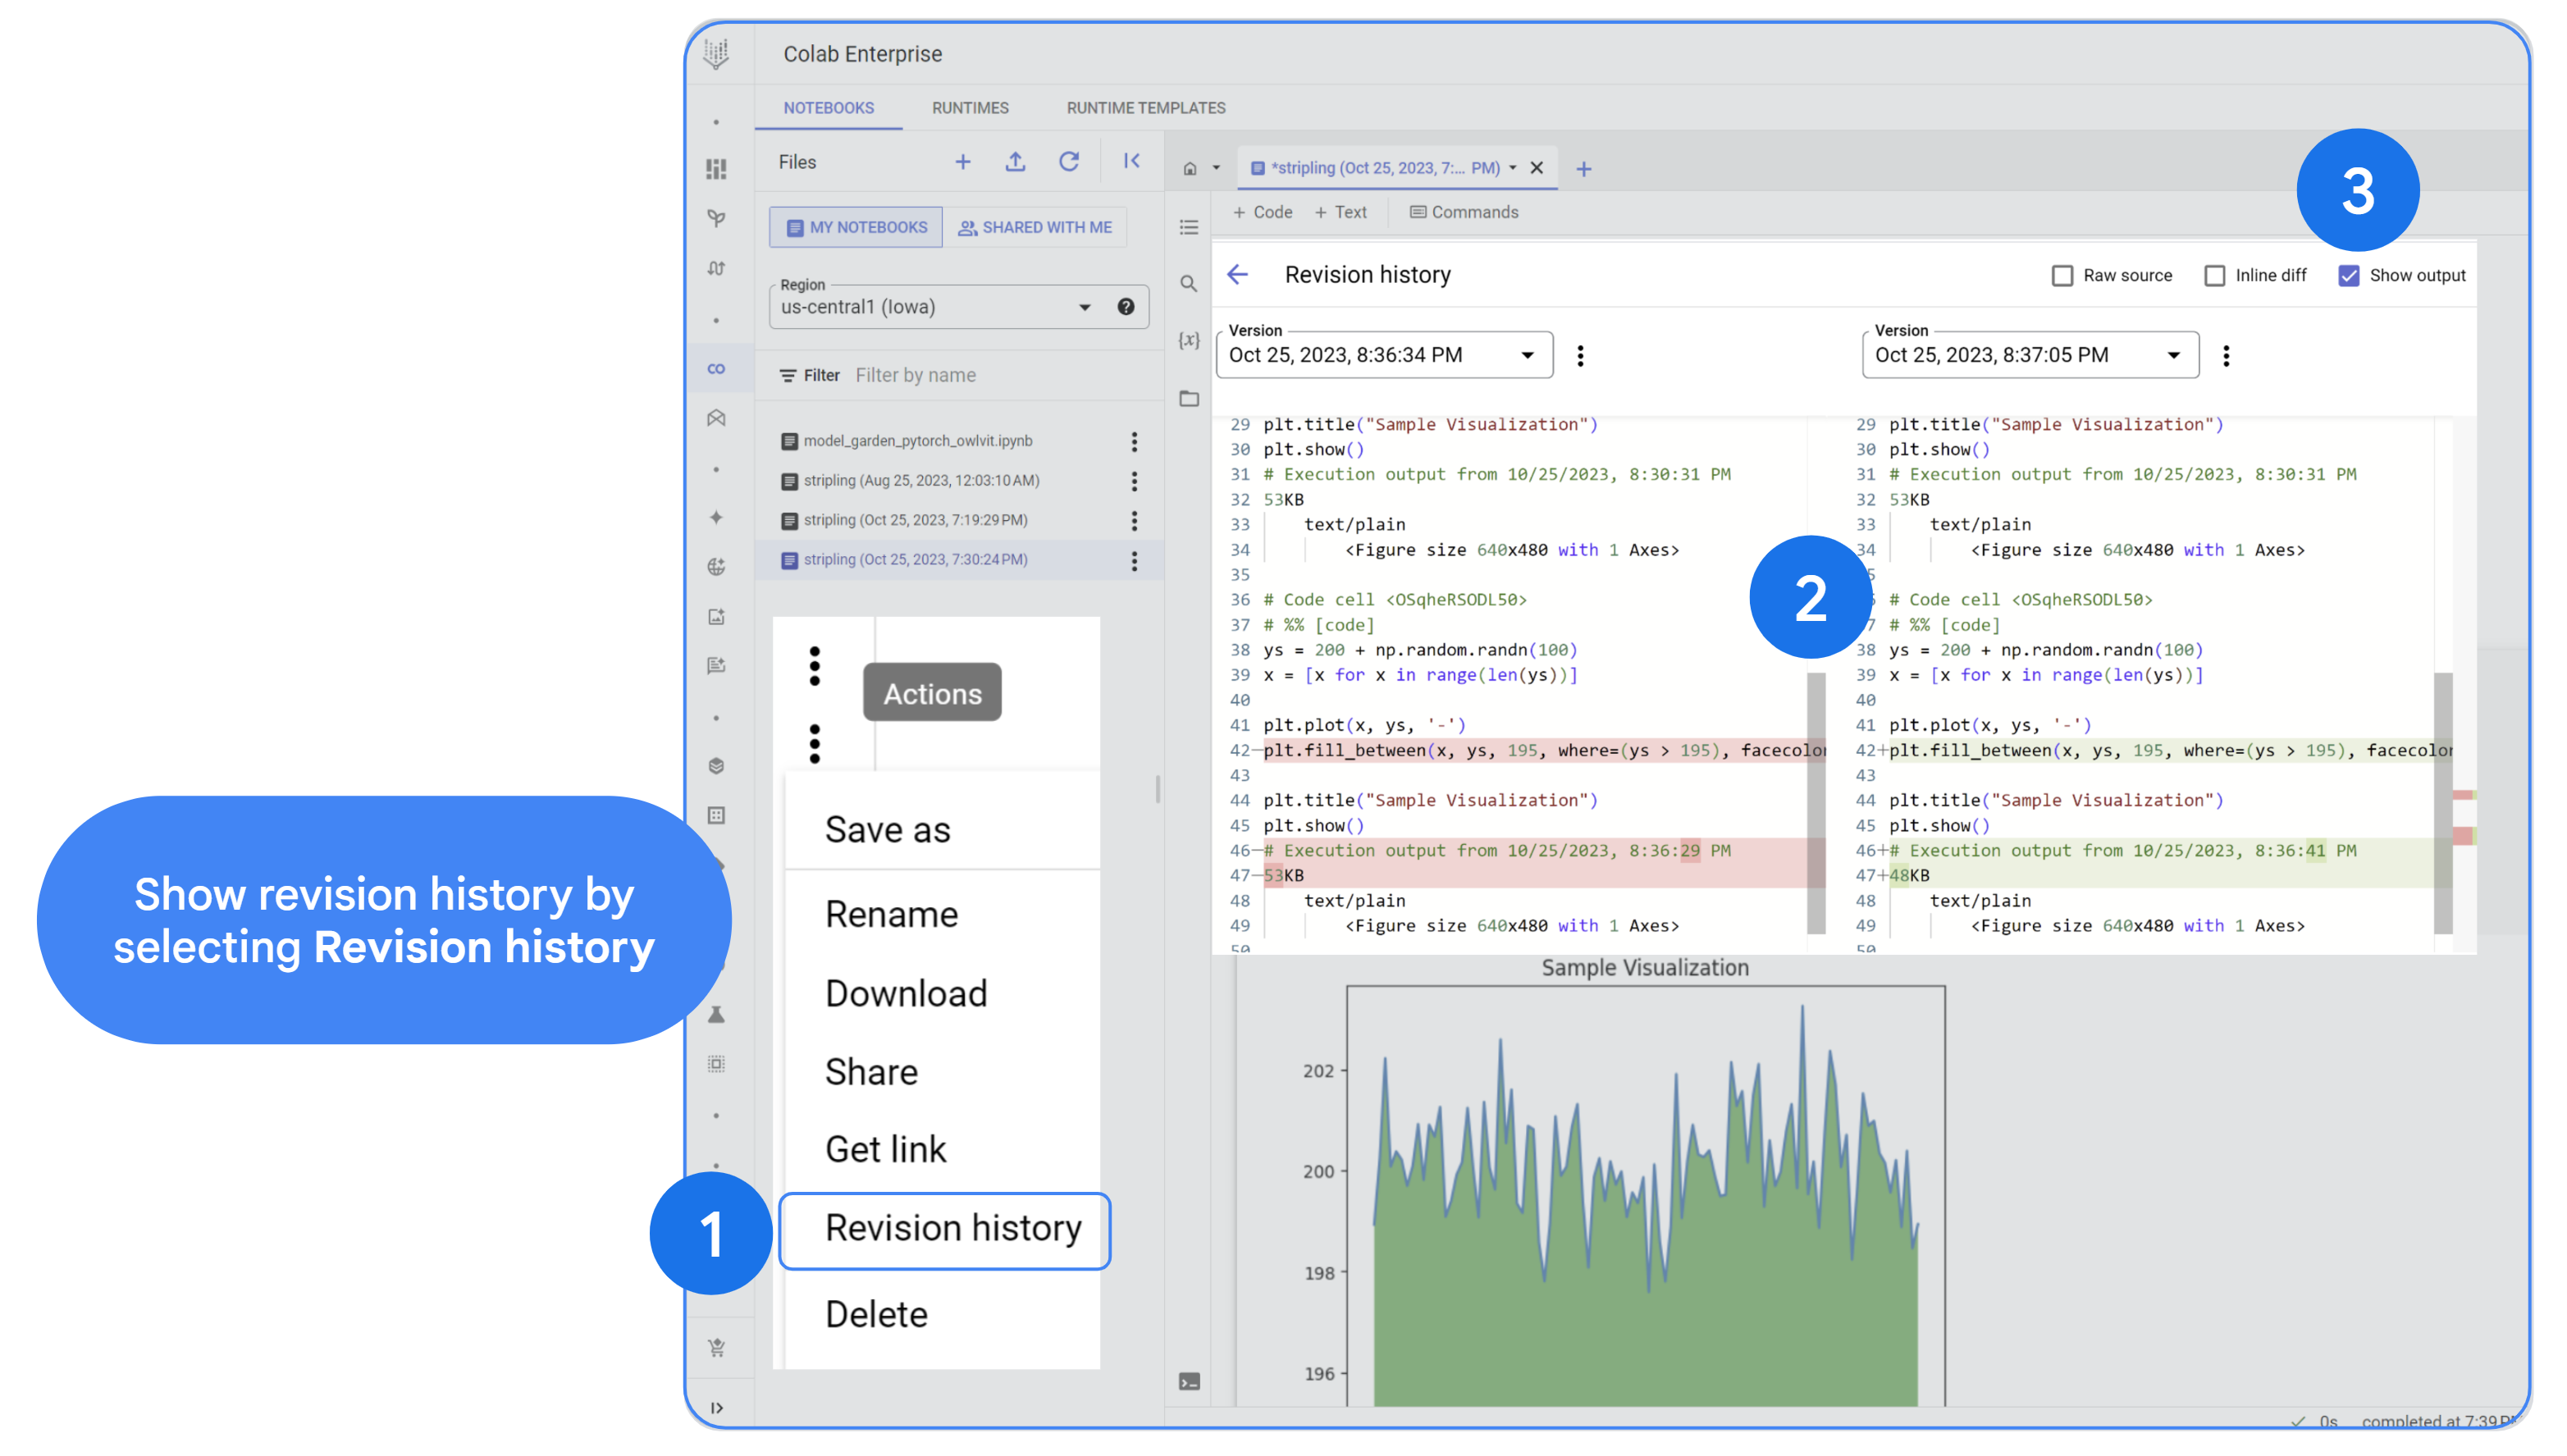
Select Revision History (as shown in bubble #1 in the image below).
When revision history is selected, you see the changes side by side with a date stamp and color-coding to see the “old” in red and the “new” in green (as shown in bubble #2).
There are three options to view revision history: the raw source, the inline differences, or the source output (as shown in bubble #3).
Task 5. Add code to cells
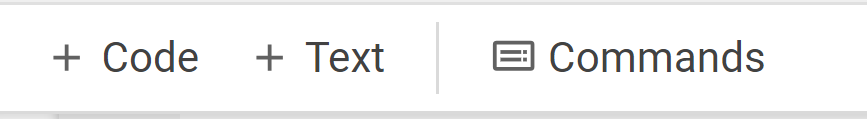
To add code or text to a Notebook, simply click on either code or text in the menu bar above the Notebook Editor.
Now, you will add several blocks of code to the notebook. After you copy a block of code, run the code to see the output. Note - Some cells will have not output (such as when you import the libraries). When you are done, share the notebook.
Go back to the Notebook storage section then click on your Notebook.
Re-run the first code again.
Add a code cell.
Copy the code below into the new cell.
Import libraries
import seaborn as sns
import pandas as pd
import numpy as np
from google.cloud import bigquery
bq = bigquery.Client()
Click the Run icon to run the cell.
There should be no output shown.
Insert the following code as cells to import the necessary modules and initialize a BigQuery client. The BigQuery client will be used to send and receive messages from the BigQuery API.
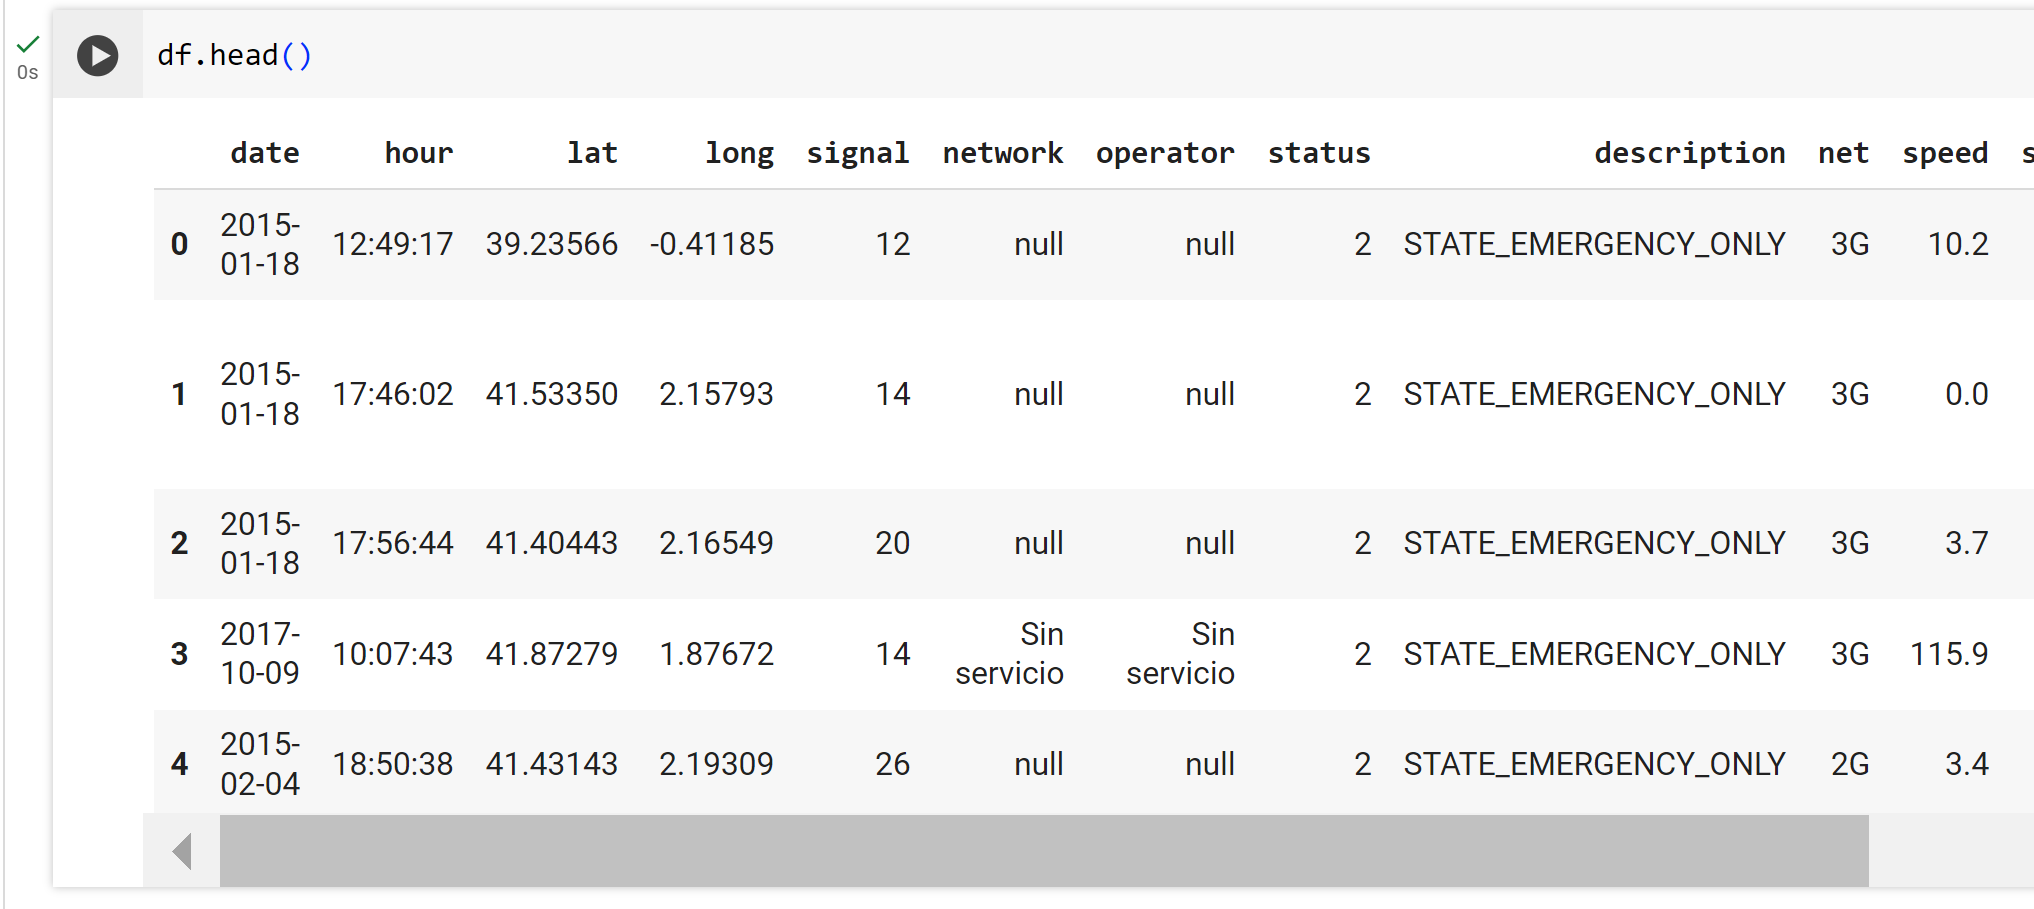
In Google, %%bigquery is a magic command used within Jupyter notebooks and other interactive environments to interact with BigQuery. Therefore, %%bigquery essentially tells your environment to wwitch to BigQuery mode: It prepares the environment to accept and execute BigQuery queries. BigQuery will execute the query, retrieve the data, and present it to you within the notebook environment, often as a pandas DataFrame (e.g. the "df" as shown in the code)
%%bigquery df
SELECT *
FROM `bigquery-public-data.catalonian_mobile_coverage_eu.mobile_data_2015_2017`
Write a SQL query to pick up specific fields from a BigQuery dataset
%%bigquery df2
SELECT signal, status
FROM `bigquery-public-data.catalonian_mobile_coverage_eu.mobile_data_2015_2017`
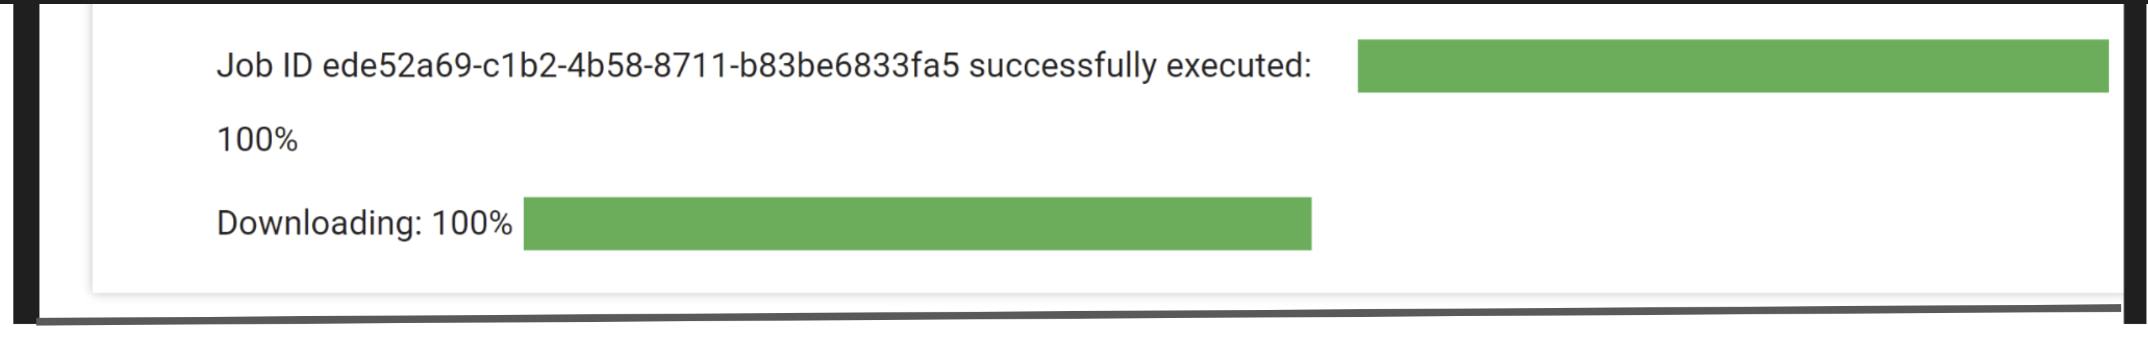
Output shown:
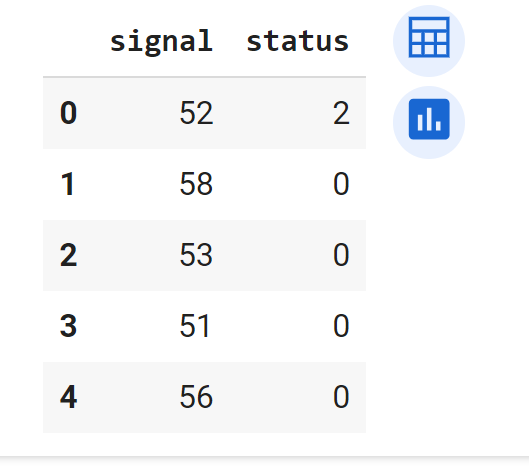
Get the first five rows of the new fields.
df2.head()
Output shown:
Task 6. Share the Notebook
Next, share your notebook.
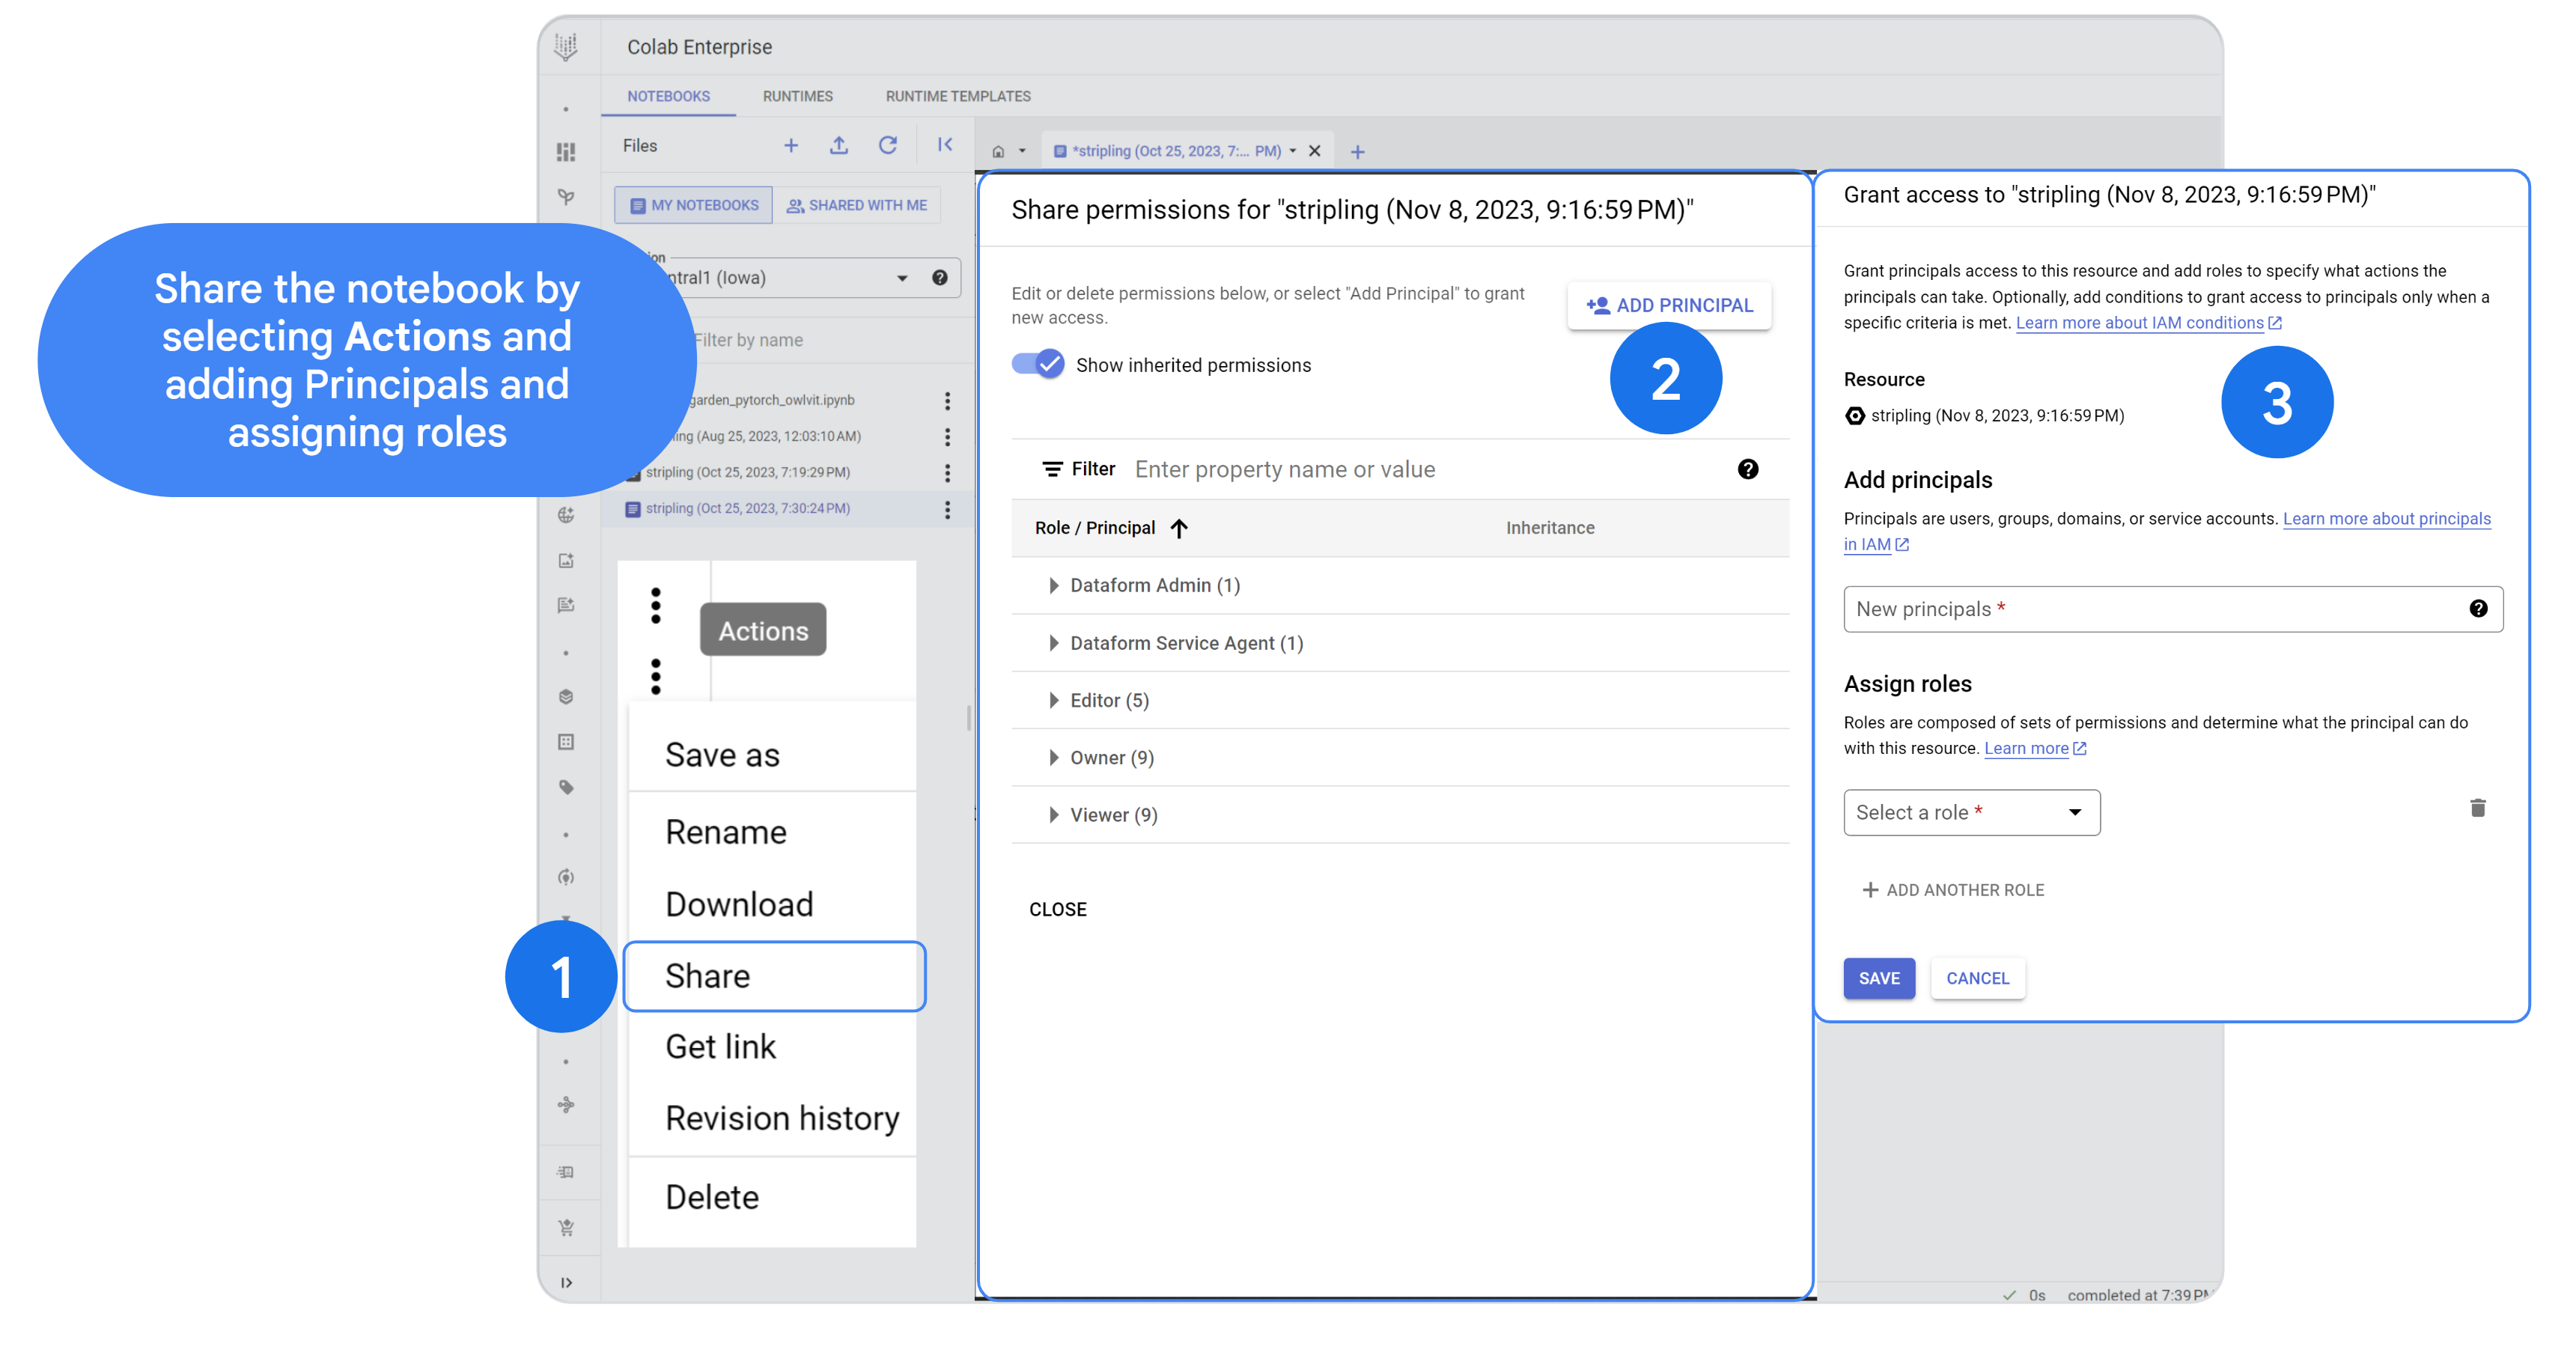
When you select “Share” by right-clicking on the notebook, a share permissions window appears, which allows you to edit or delete permissions, or select "Add Principal" to grant new access.
When you grant principals access to a resource, you also add roles to specify what actions the principals can take. Optionally, you can add conditions to grant access to principals only when a specific criteria is met.
Principals are users, groups, domains, or service accounts Roles are composed of sets of permissions and determine what the principal can do with this resource.
Congratulations!
In this lab you learned how to:
Create a Colab Enterprise Notebook
Connect to BigQuery datasets
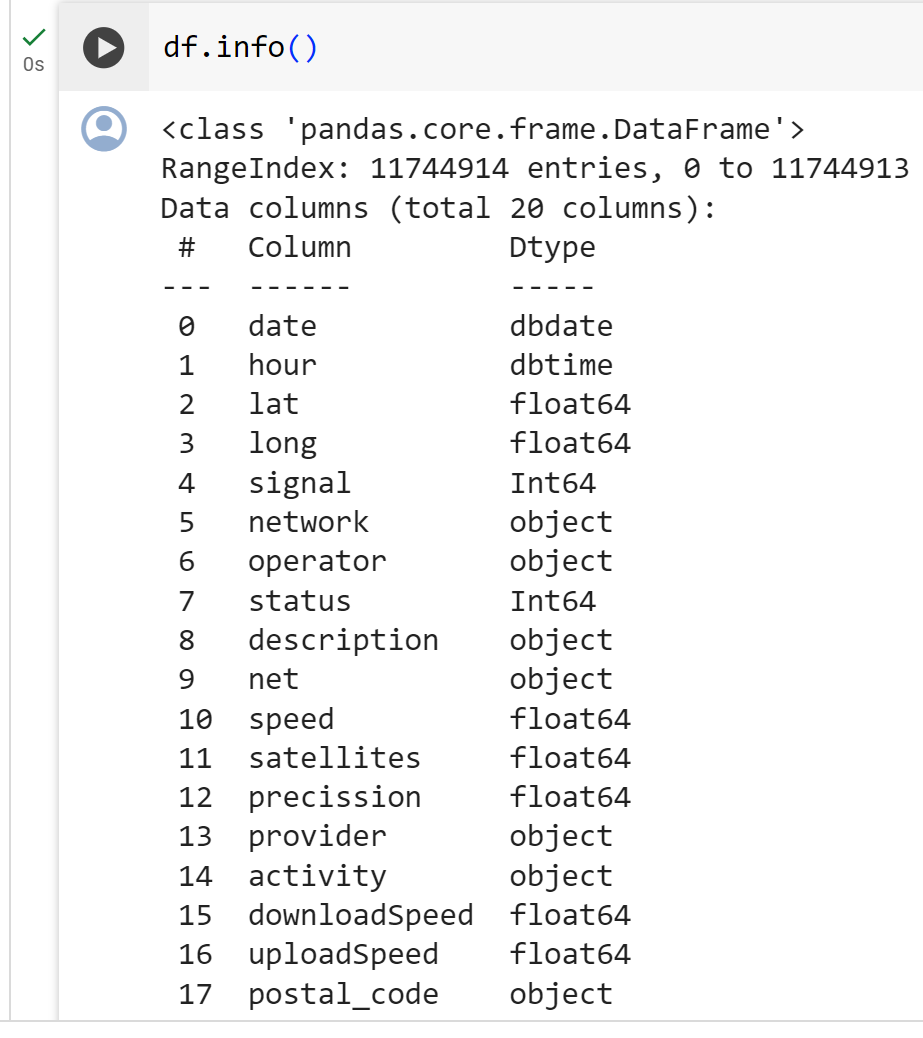
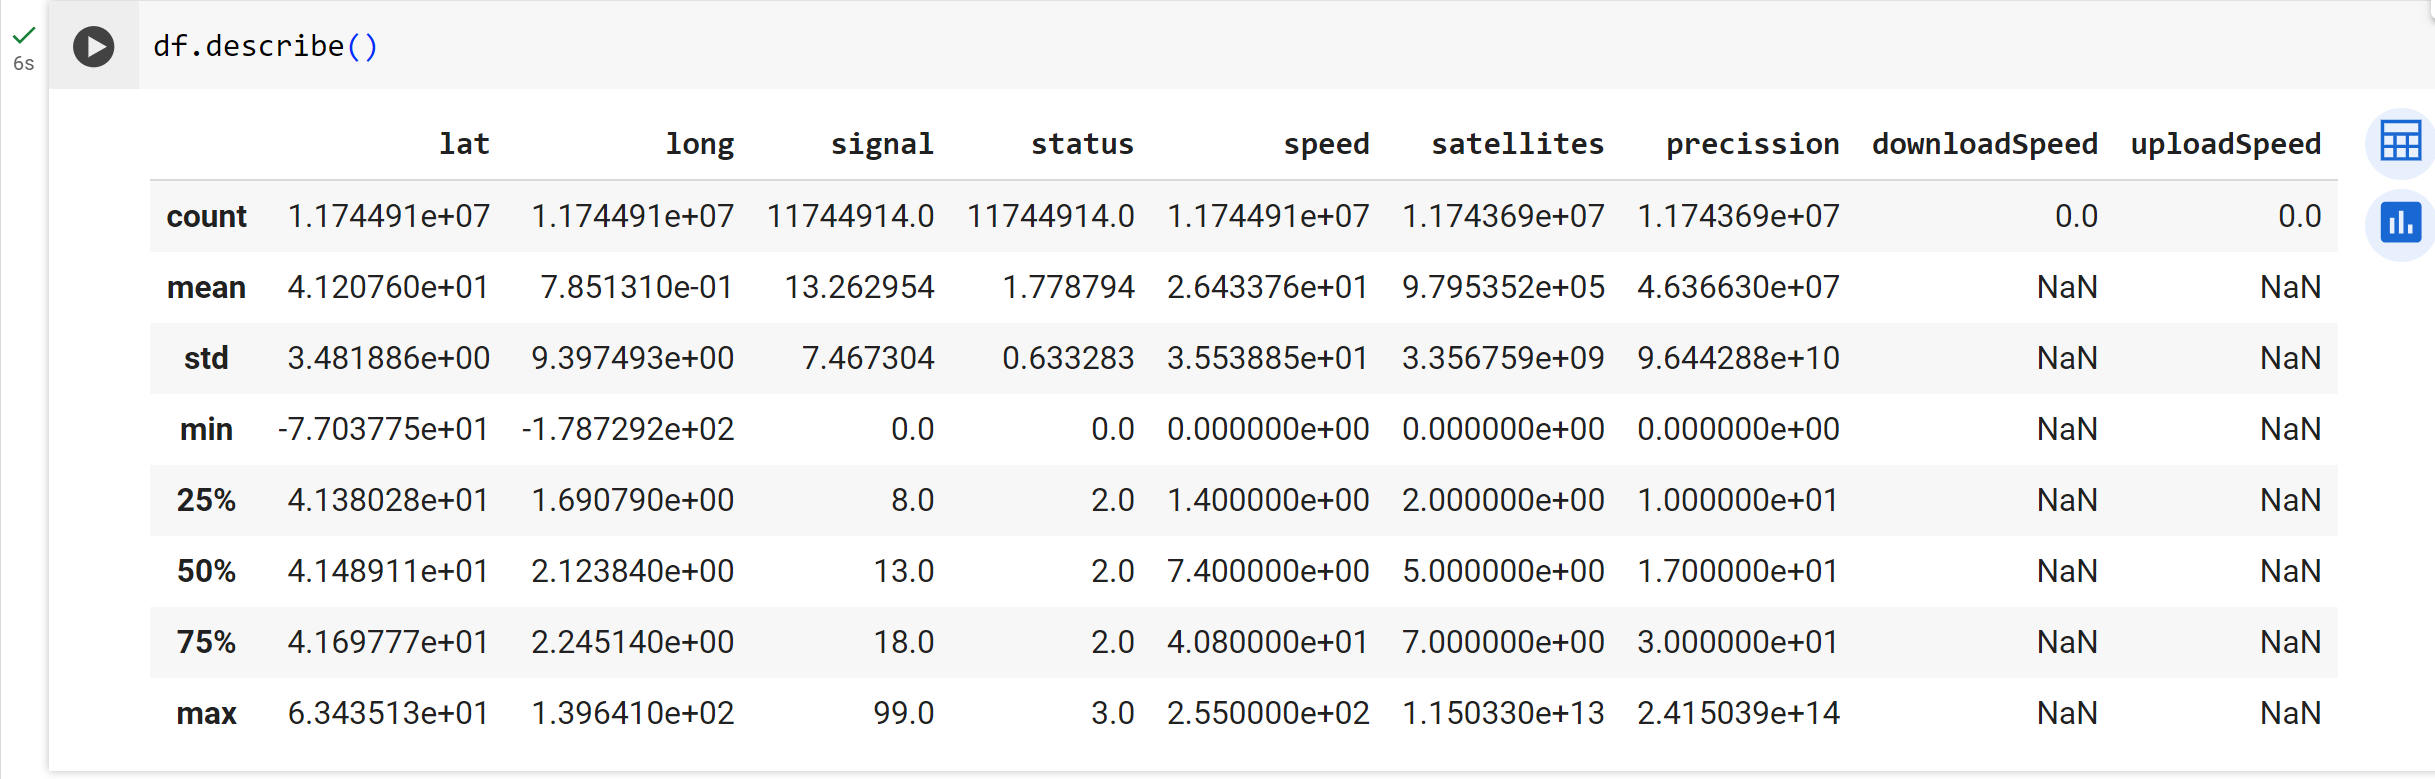
Perform statistical analyis on a Pandas Dataframe
Create Seaborn plots for Exploratory Data Analysis in Python
Write a SQL query to pick up specific fields from a BigQuery dataset
Use version history to see code changes
Share a Colab Enterprise notebook
End your lab
When you have completed your lab, click End Lab. Qwiklabs removes the resources you’ve used and cleans the account for you.
You will be given an opportunity to rate the lab experience. Select the applicable number of stars, type a comment, and then click Submit.
The number of stars indicates the following:
1 star = Very dissatisfied
2 stars = Dissatisfied
3 stars = Neutral
4 stars = Satisfied
5 stars = Very satisfied
You can close the dialog box if you don't want to provide feedback.
For feedback, suggestions, or corrections, please use the Support tab.
Manual Last Updated December 11, 2024
Lab Last Tested December 11, 2024
Copyright 2024 Google LLC All rights reserved. Google and the Google logo are trademarks of Google LLC. All other company and product names may be trademarks of the respective companies with which they are associated.
Labs erstellen ein Google Cloud-Projekt und Ressourcen für einen bestimmten Zeitraum
Labs haben ein Zeitlimit und keine Pausenfunktion. Wenn Sie das Lab beenden, müssen Sie von vorne beginnen.
Klicken Sie links oben auf dem Bildschirm auf Lab starten, um zu beginnen
Privates Surfen verwenden
Kopieren Sie den bereitgestellten Nutzernamen und das Passwort für das Lab
Klicken Sie im privaten Modus auf Konsole öffnen
In der Konsole anmelden
Melden Sie sich mit Ihren Lab-Anmeldedaten an. Wenn Sie andere Anmeldedaten verwenden, kann dies zu Fehlern führen oder es fallen Kosten an.
Akzeptieren Sie die Nutzungsbedingungen und überspringen Sie die Seite zur Wiederherstellung der Ressourcen
Klicken Sie erst auf Lab beenden, wenn Sie das Lab abgeschlossen haben oder es neu starten möchten. Andernfalls werden Ihre bisherige Arbeit und das Projekt gelöscht.
Diese Inhalte sind derzeit nicht verfügbar
Bei Verfügbarkeit des Labs benachrichtigen wir Sie per E-Mail
Sehr gut!
Bei Verfügbarkeit kontaktieren wir Sie per E-Mail
Es ist immer nur ein Lab möglich
Bestätigen Sie, dass Sie alle vorhandenen Labs beenden und dieses Lab starten möchten
Privates Surfen für das Lab verwenden
Nutzen Sie den privaten oder Inkognitomodus, um dieses Lab durchzuführen. So wird verhindert, dass es zu Konflikten zwischen Ihrem persönlichen Konto und dem Teilnehmerkonto kommt und zusätzliche Gebühren für Ihr persönliches Konto erhoben werden.
Exploratory Data Analysis using Bigquery and Colab Enterprise