概览
在本实验中,您将担任 Cymbal Superstore 的数据科学家,帮助营销团队识别新客户、对其进行分类,以及开发新客户。领导团队要求您根据客户的订单行为将他们分成 5 个不同的组,并生成有关每个组的描述性统计信息。另外,您还想要针对每个组为营销团队提供一些切实可行的后续行动建议。
为了识别这些新客户,您将使用 Gemini、Vertex AI 和 BigQuery,基于电子商务数据创建 K-means 聚类模型、为聚类生成可视化图表以及进行汇总,从而为营销活动生成实用的后续行动建议。本实验面向数据科学家,不限经验水平。
我们已经为您完成了环境配置。这包括为 Gemini 启用 Cloud AI Companion,并授予使用 Gemini 所需的 IAM 角色。如需了解详情,请参阅 Gemini for Google Cloud 概览。
注意:Duet AI 已更名为 Gemini,这是我们的新一代模型。此实验已更新,以反映此变化。在按照实验说明操作时,界面或文档中任何提到 Duet AI 的地方都应视为指的是 Gemini。
注意:作为一项尚处于早期发展阶段的技术,Gemini 可能会生成看似合理但实际上不正确的输出。我们建议您先验证 Gemini 的所有输出,然后再使用。如需了解详情,请参阅适用于 Google Cloud 的 Gemini 和 Responsible AI。
目标
在本实验中,您将学习如何执行以下任务:
- 在 BigQuery Studio 中使用 Colab Enterprise Python 笔记本。
- 在 BigQuery Studio 中使用 BigQuery DataFrames。
- 使用 Gemini 根据自然语言提示生成代码。
- 构建 K-means 聚类模型。
- 为聚类生成可视化图表。
- 使用 Gemini Pro 模型为营销活动制定后续行动建议。
- 清理项目资源。
设置和要求
点击“开始实验”按钮前的注意事项
请阅读以下说明。实验是计时的,并且您无法暂停实验。计时器在您点击开始实验后即开始计时,显示 Google Cloud 资源可供您使用多长时间。
此实操实验可让您在真实的云环境中开展实验活动,免受模拟或演示环境的局限。我们会为您提供新的临时凭证,让您可以在实验规定的时间内用来登录和访问 Google Cloud。
为完成此实验,您需要:
- 能够使用标准的互联网浏览器(建议使用 Chrome 浏览器)。
注意:请使用无痕模式或无痕浏览器窗口运行此实验。这可以避免您的个人账号与学生账号之间发生冲突,这种冲突可能导致您的个人账号产生额外费用。
注意:如果您已有自己的个人 Google Cloud 账号或项目,请不要在此实验中使用,以避免您的账号产生额外的费用。
如何开始实验并登录 Google Cloud 控制台
-
点击开始实验按钮。如果该实验需要付费,系统会打开一个弹出式窗口供您选择付款方式。左侧是实验详细信息面板,其中包含以下各项:
-
打开 Google Cloud 控制台按钮
- 剩余时间
- 进行该实验时必须使用的临时凭证
- 帮助您逐步完成本实验所需的其他信息(如果需要)
-
点击打开 Google Cloud 控制台(如果您使用的是 Chrome 浏览器,请右键点击并选择在无痕式窗口中打开链接)。
该实验会启动资源并打开另一个标签页,显示登录页面。
提示:将这些标签页安排在不同的窗口中,并排显示。
注意:如果您看见选择账号对话框,请点击使用其他账号。
-
如有必要,请复制下方的用户名,然后将其粘贴到登录对话框中。
{{{user_0.username | "<用户名>"}}}
您也可以在实验详细信息面板中找到用户名。
-
点击下一步。
-
复制下面的密码,然后将其粘贴到欢迎对话框中。
{{{user_0.password | "<密码>"}}}
您也可以在实验详细信息面板中找到密码。
-
点击下一步。
重要提示:您必须使用实验提供的凭证。请勿使用您的 Google Cloud 账号凭证。
注意:在本实验中使用您自己的 Google Cloud 账号可能会产生额外费用。
-
继续在后续页面中点击以完成相应操作:
- 接受条款及条件。
- 由于这是临时账号,请勿添加账号恢复选项或双重验证。
- 请勿注册免费试用。
片刻之后,系统会在此标签页中打开 Google Cloud 控制台。
注意:如需查看列有 Google Cloud 产品和服务的菜单,请点击左上角的导航菜单。

任务 1. 为您的项目创建 BigQuery 数据集
在此任务中,您将在 BigQuery 中创建电子商务数据集。该数据集将用于存储稍后将进行分类的电子商务数据。
-
在 Google Cloud 控制台中,依次选择导航菜单 ( ) 和 BigQuery。
您会看到“欢迎在 Cloud 控制台中使用 BigQuery”弹出式窗口。
-
点击完成。
-
在探索器面板中,针对 选择查看操作 ( ),然后选择创建数据集。
您可以创建数据集来存储数据库对象,包括表和模型。
-
在创建数据集窗格中,输入以下信息:
| 字段 |
值 |
| 数据集 ID |
ecommerce |
| 位置类型 |
选择多区域
|
| 多区域 |
选择 US(美国的多个区域)
|
对于其他字段,保留默认值。
-
点击创建数据集。
如需验证是否已完成以下目标,请点击检查我的进度:
为您的项目创建 BigQuery 数据集。
任务 2. 创建新的 Python 笔记本
在此任务中,您将在 BigQuery 中创建新的 Python 笔记本,以便使用 Gemini in BigQuery。BigQuery 中需要用到 Python 笔记本,以便您可以使用 Python 机器学习库来识别客户,并根据电子商务数据集中的购物数据将客户分为不同的组。
-
在 Google Cloud 控制台中,依次选择导航菜单 () 和 BigQuery。
-
在页面顶部,点击加号旁边的向下箭头。
-
依次选择笔记本 > 空白笔记本。
-
从下拉菜单中选择用于存储代码资产的区域 ,然后点击选择。
-
在从模板开始窗格中,点击关闭。
任务 3. 在 BigQuery 中连接到 Colab Enterprise 运行时
下一步是在 BigQuery 中连接到 Colab Enterprise 运行时。将此运行时视为 BigQuery 中的托管式环境,可供您访问机器学习库,从而帮助您识别客户并将其分类为不同的组。
-
仍然是在 BigQuery Studio 控制台中,点击笔记本右上角“连接”旁边的下拉箭头。
-
在下拉菜单中,选择连接到运行时。
-
选择创建新的运行时。
-
选择创建默认运行时。
-
点击 Qwiklabs 学员 ID。
注意:该运行时需要几分钟时间才能分配完成。然后,您会看到浏览器窗口底部的连接状态更新为“已连接”。您还会发现,该 Python 笔记本已添加到您的项目下探索器的笔记本部分中。如需验证是否已完成以下目标,请点击检查我的进度:
在 BigQuery 中连接到 Colab Enterprise 运行时。
任务 4. 构建 Python 笔记本
在此任务中,您将执行以下步骤来开始构建 Python 笔记本:
- 导入 Python 库
- 定义变量
- 基于公共数据集创建基表并将其导入为 BigQuery DataFrame
- 生成 K-means 聚类模型和可视化图表
导入 Python 库并定义变量
构建 Python 笔记本的第一步是导入 Python 库并定义变量。
如需将库导入您的笔记本,请按以下步骤操作:
-
在笔记本中添加一个代码单元,点击笔记本窗口顶部的 +代码按钮。
-
将以下代码段粘贴到单元中:
from google.cloud import bigquery
from google.cloud import aiplatform
import bigframes.pandas as bpd
import pandas as pd
from vertexai.language_models._language_models import TextGenerationModel
from vertexai.generative_models import GenerativeModel
from bigframes.ml.cluster import KMeans
from bigframes.ml.model_selection import train_test_split
-
运行  该单元。
该单元。
运行时将加载 Python 库,此过程大约需要 1 分钟时间。您可以查看浏览器窗口底部的运行时状态来跟踪进度。
运行完毕后,您会看到单元上的“运行”按钮旁边有一个绿色对勾标记  。
。
下表提供了您刚导入到笔记本中的 Python 库的详细信息,包括每个库的简要说明。
注意:如需详细了解每个库,请点击所提供的链接。
定义变量并启动 BigQuery 和 Vertex AI 连接
接下来,您将定义变量并启动 BigQuery 和 Vertex AI 连接。
-
在笔记本末尾新增一个代码单元。
-
将以下代码段粘贴到该单元中。
project_id = '<project_id>'
dataset_name = "ecommerce"
model_name = "customer_segmentation_model"
table_name = "customer_stats"
location = "<location>"
client = bigquery.Client(project=project_id)
aiplatform.init(project=project_id, location=location)
-
将 <project_id> 替换为 。
-
将 <location> 替换为 。
-
运行 该单元。
创建并导入 ecommerce.customer_stats 表
接下来,您需要将 thelook_ecommerce BigQuery 公共数据集中的数据存储到电子商务数据集中名为 customer_status 的新表中。
-
在笔记本末尾新增一个代码单元。
-
将以下代码段粘贴到该单元中。
%%bigquery
CREATE OR REPLACE TABLE ecommerce.customer_stats AS
SELECT
user_id,
DATE_DIFF(CURRENT_DATE(), CAST(MAX(order_created_date) AS DATE), day) AS days_since_last_order, ---RECENCY
COUNT(order_id) AS count_orders, --FREQUENCY
AVG(sale_price) AS average_spend --MONETARY
FROM (
SELECT
user_id,
order_id,
sale_price,
created_at AS order_created_date
FROM `bigquery-public-data.thelook_ecommerce.order_items`
WHERE
created_at
BETWEEN '2022-01-01' AND '2023-01-01'
)
GROUP BY user_id;
-
运行 该单元。
使用 Gemini 提示创建 BigQuery DataFrame 并加载数据
在此步骤中,您将使用 Gemini 提示创建 BigQuery DataFrame,并将客户统计数据加载到其中,以便之后使用 K-means 聚类模型处理该数据。
注意:如实验开始时所述,在使用前,您需要对 Gemini 输出的所有内容进行验证。请使用提供的代码示例来辅助完成此任务,但请勿照搬照贴代码,因为在某些情况下,这样做可能无法奏效。您还可以通过 Gemini 重新生成代码,以获得更理想的输出。
-
在笔记本末尾新增一个代码单元。
-
在单元中,点击生成。这样您便可使用 Gemini 生成代码,而且您会看到可添加文本的提示。
-
将以下文本粘贴到提示中。
Convert the table ecommerce.customer_stats to a bigframes dataframe and show the top 10 records
-
点击生成。Gemini 将生成以下代码。
bqdf = client.read_gbq(f"{project_id}.{dataset_name}.{table_name}")
df.head(10)
注意:在先前的步骤中,您在笔记本的单元 2 中添加了代码,该笔记本已将项目 ID、数据集名称和表名称保存为变量。如果完成了当前步骤,在下一步运行单元时就不会出现任何问题,系统将会创建 DataFrame 并显示前 10 行。
-
重新生成代码,使输出类似于以下代码:
bqdf = bpd.read_gbq(f"{project_id}.{dataset_name}.{table_name}")
bqdf.head(10)
-
运行 该单元。
您将看到 BigQuery DataFrame 的输出,其中会显示数据集前 10 行。
生成 K-means 聚类模型
现在,BigQuery DataFrame 中已经有了客户数据。下面,您需要创建一个 K-means 聚类模型,以根据最近一次订单的时间、订单数量和支出等字段将客户数据分成多个聚类,然后直接在笔记本中对这些数据进行可视化处理,以便将其按组呈现在图表中。
-
在笔记本末尾新增一个代码单元。
-
点击单元中的生成。这样您便可通过 Gemini 提示生成代码。
-
将以下提示添加到单元:
1. Split df (using random state and test size 0.2) into test and training data for a K-means clustering algorithm store these as df_test and df_train. 2. Create a K-means cluster model using bigframes.ml.cluster KMeans with 5 clusters. 3. Save the model using the to_gbq method where the model name is project_id.dataset_name.model_name.
-
点击生成。您将会看到类似于以下内容的输出:
#prompt: 1. Split df (using random state and test size 0.2) into test and training data for a K-means clustering algorithm store these as df_test and df_train. 2. Create a K-means cluster model using bigframes.ml.cluster KMeans with 5 clusters. 3. Save the model using the to_gbq method where the model name is project_id.dataset_name.model_name.
df_train, df_test = train_test_split(bq_df, test_size=0.2, random_state = 42)
kmeans = KMeans(n_clusters=5)
kmeans.fit(df_train)
kmeans.to_gbq(f"{project_id}.{dataset_name}.{model_name}")
-
运行 该单元。
注意:完成此步骤大约需要 2 分钟。
您的模型现已创建完毕!
-
点击项目名称旁边的三点状图标,选择刷新内容,以刷新探索器面板的内容。您的电子商务数据集下方应该会弹出相应窗口。
接下来,定义一个新的 BigQuery DataFrame,将 K-means 模型生成的细分/聚类重新联接到原始数据。
-
在笔记本末尾新增一个代码单元。
-
点击单元中的生成。
这样您便可通过 Gemini 提示生成代码。
-
将以下提示添加到单元:
1. Call the K-means prediction model on the df dataframe, and store the results as predictions_df and show the first 10 records.
-
点击生成。您将会看到类似于以下内容的输出:
# prompt: 1. Call the K-means prediction model on the df dataframe, and store the results as predictions_df and show the first 10 records.
predictions_df = kmeans.predict(df_test)
predictions_df.head(10)
-
运行 该单元。
您会看到前 10 条记录以及 CENTROID_ID。CENTROID_ID 是实验中稍后会对客户进行分类的聚类。您还会看到 user_id、days_since_last_order、count_orders 和 average_spend 字段。
如需验证是否已完成以下目标,请点击检查我的进度:
生成 K-means 聚类模型。
根据 K-means 聚类模型结果创建可视化图表
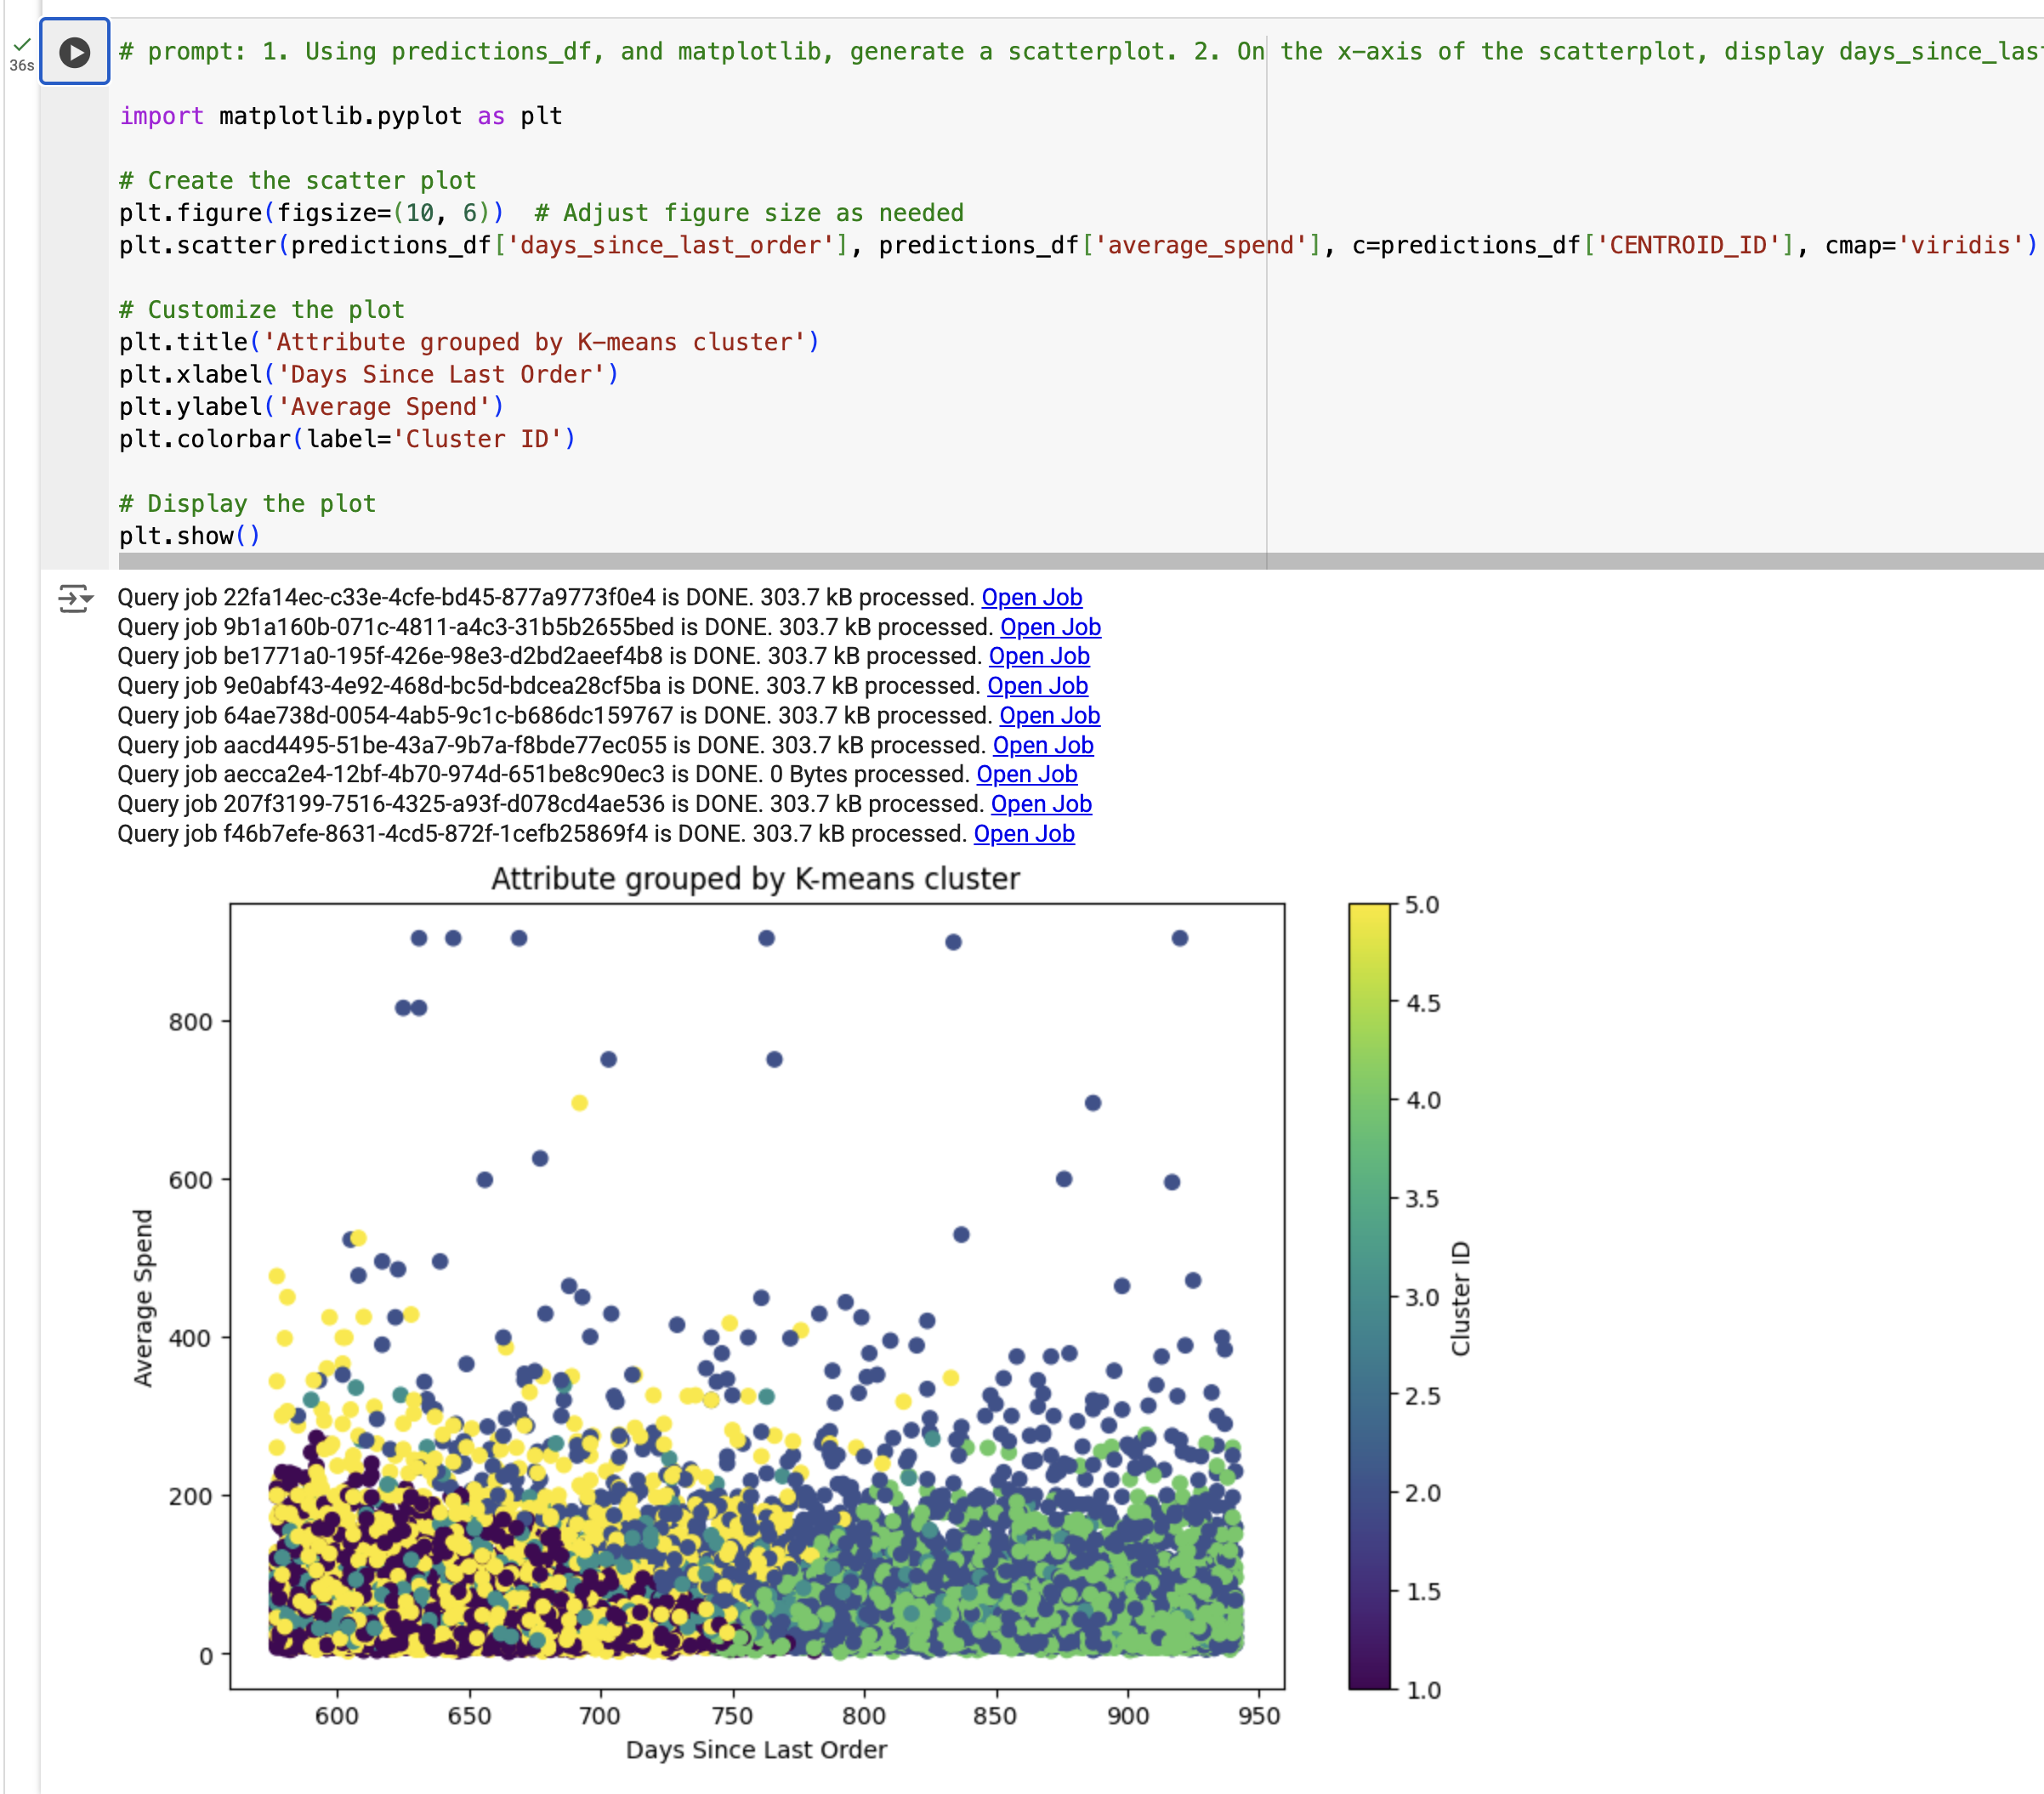
下一步,您将根据 K-means 聚类模型结果创建可视化图表。具体来说,您将使用 predictions_df 生成一个散点图,以查看距离上一次订单的天数与平均支出之间的关系,并依据使用 K-means 模型生成的 segment_id 着色!
-
在笔记本末尾新增一个代码单元。
-
点击单元中的生成。
这样您便可通过 Gemini 提示生成代码。
-
将以下提示添加到单元:
1. Using predictions_df, and matplotlib, generate a scatterplot. 2. On the x-axis of the scatterplot, display days_since_last_order and on the y-axis, display average_spend from predictions_df. 3. Color by cluster. 4. The chart should be titled "Attribute grouped by K-means cluster."
-
点击生成。
您将会看到类似于以下内容的输出:
#prompt: 1. Using predictions_df, and matplotlib, generate a scatterplot. 2. On the x-axis of the scatterplot, display days_since_last_order and on the y-axis, display average_spend from predictions_df. 3. Color by cluster. 4. The chart should be titled "Attribute grouped by K-means cluster."
import matplotlib.pyplot as plt
# Create the scatter plot
plt.figure(figsize=(10, 6)) # Adjust figure size as needed
plt.scatter(predictions_df['days_since_last_order'], predictions_df['average_spend'], c=predictions_df['cluster'], cmap='viridis')
# Customize the plot
plt.title('Attribute grouped by K-means cluster')
plt.xlabel('Days Since Last Order')
plt.ylabel('Average Spend')
plt.colorbar(label='Cluster ID')
# Display the plot
plt.show()
-
Replace 'cluster' or 'cluster_id' with 'CENTROID_ID' in the c=predictions_df field only.
-
运行 该单元。
您将看到可视化图表。
注意:如果出现 TypeError,请将代码替换为示例输出,然后运行该单元。
如需验证是否已完成以下目标,请点击检查我的进度:
根据 K-means 聚类模型结果生成可视化图表。
任务 5. 根据模型结果生成数据洞见
在此任务中,您将执行以下步骤以根据模型结果生成数据洞见:
- 汇总 K-means 模型生成的每个聚类
- 针对营销活动定义提示
- 使用 Gemini 生成营销活动
汇总 K-means 模型生成的每个聚类
在此步骤中,您将汇总 K-means 模型生成的每个聚类。
-
在笔记本末尾新增一个代码单元。
-
将以下代码段粘贴到单元中:
query = """
SELECT
CONCAT('cluster ', CAST(centroid_id as STRING)) as centroid,
average_spend,
count_orders,
days_since_last_order
FROM (
SELECT centroid_id, feature, ROUND(numerical_value, 2) as value
FROM ML.CENTROIDS(MODEL `{0}.{1}`)
)
PIVOT (
SUM(value)
FOR feature IN ('average_spend', 'count_orders', 'days_since_last_order')
)
ORDER BY centroid_id
""".format(dataset_name, model_name)
df_centroid = client.query(query).to_dataframe()
df_centroid.head()
-
运行 该单元。
您应该会看到聚类汇总在一张表中。从该表可以看出,有些聚类的平均支出较高,而有些聚类的订单数量较多。
接下来,将 DataFrame 转换成字符串,以便将其传递给您的大语言模型调用。
-
在笔记本末尾新增一个代码单元。
-
将以下代码段粘贴到单元中:
df_query = client.query(query).to_dataframe()
df_query.to_string(header=False, index=False)
cluster_info = []
for i, row in df_query.iterrows():
cluster_info.append("{0}, average spend ${2}, count of orders per person {1}, days since last order {3}"
.format(row["centroid"], row["count_orders"], row["average_spend"], row["days_since_last_order"]) )
cluster_info = (str.join("\n", cluster_info))
print(cluster_info)
-
运行 该单元。
输出应类似于以下内容:
cluster 1, average spend $48.32, count of orders per person 1.36, days since last order 384.37
cluster 2, average spend $202.34, count of orders per person 1.3, days since last order 482.62
cluster 3, average spend $45.68, count of orders per person 1.36, days since last order 585.4
cluster 4, average spend $44.71, count of orders per person 1.36, days since last order 466.26
cluster 5, average spend $58.08, count of orders per person 3.92, days since last order 427.36
使用 Gemini 模型生成营销活动
您创建了一个 K-means 模型,将每个客户分配到了该模型的一个聚类中,并生成了每个聚类的汇总统计信息。在此步骤中,您将使用 Gemini 根据提示生成代码,以创建营销活动,并为我们的营销团队提供客户数据洞见和后续行动建议。
对于 K-means 模型定义的每个聚类/细分,我们将生成三个可供营销团队使用的条目:
- Title(名称)
- Persona(画像)
- Next marketing step(后续营销行动建议)
-
在笔记本末尾新增一个代码单元。
-
将以下代码段粘贴到单元中:
model = GenerativeModel("gemini-2.5-pro")
prompt = f"""
You're a creative brand strategist, given the following clusters, come up with \
creative brand persona, a catchy title, and next marketing action, \
explained step by step. Identify the cluster number, the title of the person, a persona for them and the next marketing step.
Clusters:
{cluster_info}
For each Cluster:
* Title:
* Persona:
* Next marketing step:
"""
responses = model.generate_content(
prompt,
generation_config={
"temperature": 0.1,
"max_output_tokens": 4000,
"top_p": 1.0,
"top_k": 40,
}
)
print(responses.text)
-
运行 该单元。
您应该会看到每个聚类及其标题、角色和后续行动。
**Cluster 1:**
* **Title:** The Lapsed Loyalists
* **Persona:** These customers have made a purchase in the past but haven't returned for an extended period. They likely had a positive experience but haven't been engaged recently.
* **Next Marketing Step:**
1. **Re-engagement campaign:** Send personalized emails or targeted ads reminding them of their previous purchase and highlighting new products or promotions that might interest them.
2. **Offer exclusive discounts or incentives:** Motivate them to return with special offers or loyalty rewards.
3. **Personalized product recommendations:** Leverage purchase history and browsing behavior to suggest relevant products they might be interested in.
**Cluster 2:**
* **Title:** The Occasional Treaters
* **Persona:** These customers make infrequent purchases but spend more when they do. They likely view the brand as a premium option for special occasions.
* **Next Marketing Step:**
1. **Highlight exclusivity and premium value:** Emphasize the unique features and benefits of your products to justify the higher price point.
2. **Offer limited-time promotions or bundles:** Encourage larger purchases with special deals on high-value items or curated product sets.
3. **Create a sense of urgency and scarcity:** Promote limited-edition products or flash sales to encourage immediate action.
**Cluster 3:**
* **Title:** The One-and-Done Buyers
* **Persona:** These customers have only made a single purchase and haven't returned. They might have had a neutral experience or haven't found a reason to come back.
* **Next Marketing Step:**
1. **Gather feedback:** Send post-purchase surveys to understand their experience and identify areas for improvement.
2. **Offer personalized recommendations:** Based on their initial purchase, suggest complementary products or accessories to encourage further engagement.
3. **Showcase customer testimonials and social proof:** Highlight positive reviews and user-generated content to build trust and encourage repeat purchases.
**Cluster 4:**
* **Title:** The Big Spenders
* **Persona:** These customers spend significantly more than others and are likely your most loyal and valuable segment. They appreciate high-quality products and personalized experiences.
* **Next Marketing Step:**
1. **Develop a VIP program:** Offer exclusive benefits, early access to new products, and personalized customer service to show appreciation and encourage continued loyalty.
2. **Personalized communication and offers:** Tailor your marketing messages and promotions to their specific interests and purchase history.
3. **Host exclusive events or experiences:** Create opportunities for them to connect with the brand and other high-value customers.
**Cluster 5:**
* **Title:** The Price-Conscious Shoppers
* **Persona:** These customers are primarily driven by price and make infrequent, low-value purchases. They are likely to compare prices and seek the best deals.
* **Next Marketing Step:**
1. **Promote competitive pricing and value-driven offers:** Highlight your competitive prices and bundle deals to attract price-sensitive customers.
2. **Offer free shipping or other incentives:** Reduce purchase barriers by offering free shipping or other attractive incentives.
3. **Focus on product benefits and value for money:** Emphasize the quality and functionality of your products to justify the price point.
如需验证是否已完成以下目标,请点击检查我的进度:
使用 Gemini 生成营销活动。
任务 6. 清理项目资源(可选)
在本实验中,您在 Google Cloud 控制台中创建了资源。在生产环境中,您需要从账号中移除这些资源,因为从模型中收集到数据洞见后就不再需要这些资源了。如需从账号中移除这些资源,以免因使用这些资源产生更多费用,您有两个选择:
通过移除项目清理资源
为避免系统因本教程中使用的资源而向您的 Google Cloud 账号收取费用,您可以删除为本教程创建的 Google Cloud 项目。
注意:删除项目会产生以下影响:
- 项目中的所有内容都会被删除。如果您是使用某个现有项目来执行本文档中的任务的,则删除该项目会一并删除您已在该项目中完成的所有其他工作。
- 自定义项目 ID 丢失。创建此项目时,您可能创建了要在将来使用的自定义项目 ID。如需保留使用该项目 ID 的网址(例如 appspot.com 网址),请删除项目内的选定资源,而不是删除整个项目。
如果您打算浏览多个架构、教程或快速入门,则重复使用项目可以帮助您避免超出项目配额上限。
-
在 Google Cloud 控制台中,转到 IAM 和管理 > 管理资源页面。
-
在项目列表中,选择要删除的项目,然后点击删除。
-
在对话框中输入该项目的 ID,然后点击仍要关停以删除该项目。
通过删除相应资源来清理资源
为避免产生费用,您可以在笔记本的新代码单元中运行以下代码,以删除本实验中使用的表和模型:
# Delete customer_stats table
client.delete_table(f"{project_id}.{dataset_name}.{table_name}", not_found_ok=True)
print(f"Deleted table: {project_id}.{dataset_name}.{table_name}")
# Delete K-means model
client.delete_model(f"{project_id}.{dataset_name}.{model_name}", not_found_ok=True)
print(f"Deleted model: {project_id}.{dataset_name}.{model_name}")
运行该单元后,您可以在 BigQuery Studio 中刷新项目内容,查看表和模型是否已删除。
恭喜!
在本实验中,您学习了如何执行以下任务:
- 在 BigQuery Studio 中使用 Colab Enterprise Python 笔记本。
- 在 BigQuery Studio 中使用 BigQuery DataFrames。
- 使用 Gemini 根据自然语言提示生成代码。
- 构建 K-means 聚类模型。
- 生成聚类的可视化图表。
- 使用 Gemini 为营销活动制定后续行动建议。
可选阅读资源
现在,您已使用 Gemini、Vertex AI 和 BigQuery 帮助 Cymbal Superstore 识别客户、对其进行分类以及开发客户。如需了解有关 Gemini 的更多信息,请访问以下链接:
结束实验
完成实验后,请点击结束实验。Qwiklabs 会移除您使用过的资源并为您清理帐号。
系统会提示您为实验体验评分。请选择相应的评分星级,输入评论,然后点击提交。
星级的含义如下:
- 1 颗星 = 非常不满意
- 2 颗星 = 不满意
- 3 颗星 = 一般
- 4 颗星 = 满意
- 5 颗星 = 非常满意
如果您不想提供反馈,可以关闭该对话框。
如果要留言反馈、提出建议或做出更正,请使用支持标签页。
上次更新手册的时间:2025 年 9 月 3 日
上次测试实验的时间:2025 年 9 月 3 日
版权所有 2024 Google LLC 保留所有权利。Google 和 Google 徽标是 Google LLC 的商标。其他所有公司名称和产品名称可能是其各自相关公司的商标。


