Checkpoints
Enable the Google Earth Engine API
/ 25
Create a BigQuery dataset to store exported data
/ 25
Export vector data from Google Earth Engine to BigQuery
/ 25
Run a spatial query in BigQuery to identify flooded road segments
/ 25
Export Data from Google Earth Engine to BigQuery
- GSP1180
- Overview
- Setup and requirements
- Task 1. Enable the Google Earth Engine API
- Task 2. Create a BigQuery dataset to store exported data
- Task 3. Identify flooded areas in Google Earth Engine
- Task 4. Export vector data from Google Earth Engine to BigQuery
- Task 5. Run a spatial query in BigQuery to identify flooded road segments
- Task 6. Create a quick visualization of the spatial query results in Looker Studio
- Congratulations!
GSP1180

Overview
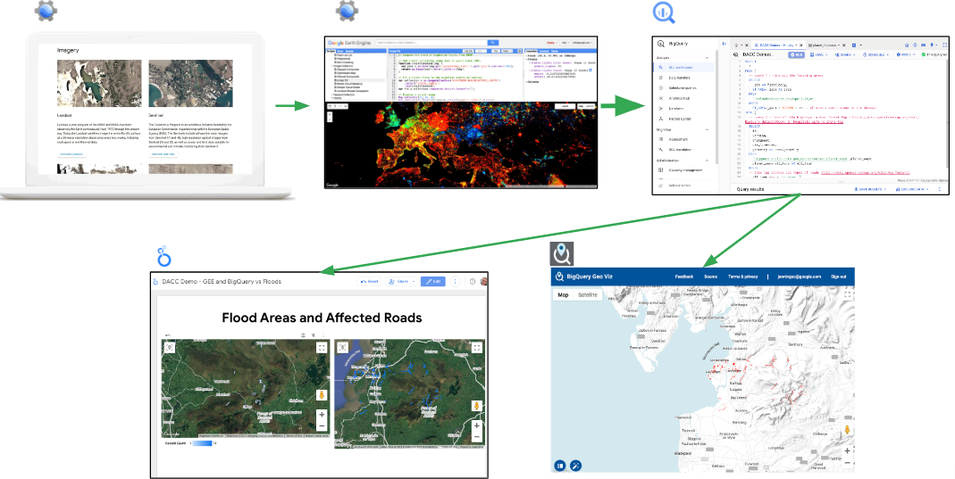
Google Earth Engine and BigQuery share the goal of making large-scale data processing accessible and usable by a wider range of people and applications. Google Earth Engine is a planetary-scale platform for Earth science data and analysis that is powered by Google's cloud infrastructure. BigQuery is a serverless and cost-effective enterprise data warehouse that works across clouds and scales with your data. Google Earth Engine workflows often focus on image (raster) processing, whereas BigQuery is optimized for processing large tabular datasets (including vector data). By combining Google Earth Engine data with BigQuery data sources, you get a more complete picture of a particular phenomenon across time and space.
Exporting data from Google Earth Engine to BigQuery allows you to leverage BigQuery's powerful analysis tools to extract insights from Google Earth Engine data and share Google Earth Engine data with SQL-friendly users in a way that's accessible for them. This lab focuses on how to export data from Google Earth Engine to BigQuery, while providing a real-world example of using Google's geospatial tools to identify flooded roads in Lancaster, England after a heavy rain event in November 2017.
In this lab, you learn how to export data extracted from satellite data in Google Earth Engine to BigQuery, combine exported data with public datasets in BigQuery using spatial queries, and create a quick visualization of the results in Looker Studio.
What you'll do
- Create a BigQuery dataset to store exported data.
- Analyze and convert pixel-based data to vector data in Google Earth Engine.
- Export data from Google Earth Engine to BigQuery.
- Run a spatial query in BigQuery that combines the exported data with public datasets.
- Create a quick visualization of the spatial query results in Looker Studio.
Setup and requirements
Before you click the Start Lab button
Read these instructions. Labs are timed and you cannot pause them. The timer, which starts when you click Start Lab, shows how long Google Cloud resources will be made available to you.
This hands-on lab lets you do the lab activities yourself in a real cloud environment, not in a simulation or demo environment. It does so by giving you new, temporary credentials that you use to sign in and access Google Cloud for the duration of the lab.
To complete this lab, you need:
- Access to a standard internet browser (Chrome browser recommended).
- Time to complete the lab---remember, once you start, you cannot pause a lab.
How to start your lab and sign in to the Google Cloud console
-
Click the Start Lab button. If you need to pay for the lab, a pop-up opens for you to select your payment method. On the left is the Lab Details panel with the following:
- The Open Google Cloud console button
- Time remaining
- The temporary credentials that you must use for this lab
- Other information, if needed, to step through this lab
-
Click Open Google Cloud console (or right-click and select Open Link in Incognito Window if you are running the Chrome browser).
The lab spins up resources, and then opens another tab that shows the Sign in page.
Tip: Arrange the tabs in separate windows, side-by-side.
Note: If you see the Choose an account dialog, click Use Another Account. -
If necessary, copy the Username below and paste it into the Sign in dialog.
{{{user_0.username | "Username"}}} You can also find the Username in the Lab Details panel.
-
Click Next.
-
Copy the Password below and paste it into the Welcome dialog.
{{{user_0.password | "Password"}}} You can also find the Password in the Lab Details panel.
-
Click Next.
Important: You must use the credentials the lab provides you. Do not use your Google Cloud account credentials. Note: Using your own Google Cloud account for this lab may incur extra charges. -
Click through the subsequent pages:
- Accept the terms and conditions.
- Do not add recovery options or two-factor authentication (because this is a temporary account).
- Do not sign up for free trials.
After a few moments, the Google Cloud console opens in this tab.

Task 1. Enable the Google Earth Engine API
-
In the Google Cloud console, enter Google Earth Engine API in the top search bar.
-
Click on the result for Google Earth Engine API under Marketplace.
-
Click Enable.
Click Check my progress to verify the objective.
Task 2. Create a BigQuery dataset to store exported data
In BigQuery, tables must belong to a dataset, so you need to create at least one dataset to load data into BigQuery.
In this task, you create a new BigQuery dataset to store the data to be exported from Google Earth Engine in a later task.
Open the BigQuery console
- In the Google Cloud Console, select Navigation menu > BigQuery.
The Welcome to BigQuery in the Cloud Console message box opens. This message box provides a link to the quickstart guide and the release notes.
- Click Done.
The BigQuery console opens.
Create the dataset
- In the Explorer pane, next to your project id, click on View actions (
), then select Create dataset.
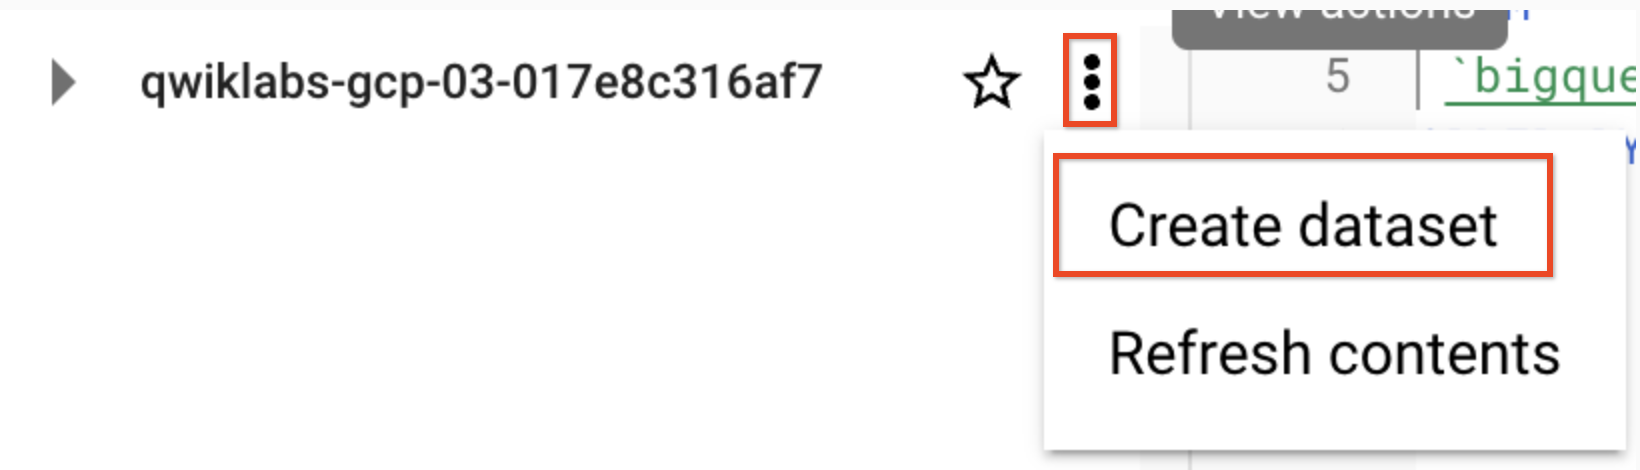
- Set Dataset ID to ee_to_bq.
Leave all other fields at the default settings.
- Click Create dataset.
Click Check my progress to verify the objective.
Task 3. Identify flooded areas in Google Earth Engine
The Google Earth Engine Data Catalog contains the Copernicus Sentinel Synthetic Aperture Radar collection. This public dataset is composed of radar images that measure how surfaces scatter light waves back to a satellite's sensor. Standing bodies of water act like mirrors for radio signals, reflecting the satellite's radar light away rather than scattering it back to the imaging sensor. Since most natural surfaces do not have this property, you can differentiate standing bodies of water from their surroundings by looking for "dark" patches in the images (that is, areas with low backscatter values).
In this task, you write and execute a script incrementally in the Google Earth Engine Code Editor to identify flooded pixels around Lancaster, England after a heavy rain event in November 2017. After you identify flooded pixels, you convert the pixel data to vector polygons, in preparation for exporting the data to BigQuery.
Open the Google Earth Engine Code Editor
In this section, you open the Google Earth Engine Code Editor and connect your active session to the Google Cloud project created for this lab.
-
In a new Incognito browser tab, navigate to https://code.earthengine.google.com/.
-
Select the lab username:
-
Click I'm authorized for an existing cloud project.
-
For Project, select the current project:
- Click Select.
Select the image collection using a defined AOI
In this section, you add code in the Google Earth Engine Code Editor to select a portion of the Sentinel dataset by defining an area of interest (AOI) around Lancaster, England and using it to filter for Sentinel-1 images that include that AOI.
- To select from the image collection using a defined AOI, paste the following code into the Code Editor.
- To execute the code, click Run in the middle menu bar.
Calculate the difference between images (before and after rain)
To identify the areas which decreased in their backscatter values after heavy rain, you can calculate the difference between two images: one image from before the rain event and one image from after the rain event.
In this section, you expand on the existing code in the Code Editor to filter the image collection by date to identify before and after flood images. You also add code to smooth the data to remove noise and to calculate the difference between the two images.
In this section and subsequent sections, you paste new code after the existing code from the previous section, so that you can build the full script incrementally.
-
In the Code Editor, leave the existing code from the previous section, and start a new line (after the existing code) to add new code.
-
To filter the image collection by date and calculate the difference between images, paste the following code into the Code Editor, and click Run.
Remove persistent surface water to highlight flooded pixels
In this section, you use the Global Surface Water dataset to remove persistent surface water (such as lakes and rivers) from the final image.
-
In the Code Editor, leave the existing code from the previous section, and start a new line (after the existing code) to add new code.
-
To remove persistent surface water from the results, paste the following code into the Code Editor, and click Run.
Convert flooded pixel data to vector
In this section, you convert the flooded pixels to vector polygons, in preparation for exporting the results to BigQuery.
-
In the Code Editor, leave the existing code from the previous section, and start a new line (after the existing code) to add new code.
-
To convert the pixels to vector polygons, paste the following code into the Code Editor, and click Run.
Task 4. Export vector data from Google Earth Engine to BigQuery
To export vector data from Google Earth Engine to BigQuery, you can use the Export.table.toBigQuery function by specifying the full path to the BigQuery table including project ID, BigQuery dataset name, and BigQuery table name.
In this task, you export the flood areas (the converted vector polygons) to a new table named flooded_areas in the BigQuery dataset that you created in Task 2.
-
In the Code Editor, leave the existing code from Task 3, and start a new line (after the existing code) to add new code.
-
To create the export job, paste the following code into the Code Editor, and click Run.
-
In the tab named Tasks, click Run next to the unsubmitted task named ee2bq_export-polygons to open the export job.
-
Click Run to execute the export job.
-
After the task has executed successfully, click on the ee2bq_export-polygons job under Submitted tasks to see the job details.
-
Click Open in BigQuery to explore the exported table in BigQuery.
Click Check my progress to verify the objective.
Task 5. Run a spatial query in BigQuery to identify flooded road segments
Through the Google Cloud Public Dataset Program, you can query many publicly available datasets in BigQuery such as OpenStreetMap (OSM).
In this task, you execute SQL in BigQuery to combine the exported flooded areas and the OSM planet_ways dataset containing roads to identify the highways that were flooded during the rain event.
-
In BigQuery, click on the Query tab (magnifying glass icon) to open a new query window.
-
To select all of the highways that intersect the flooded areas, paste the following query, and click Run.
Click Check my progress to verify the objective.
Task 6. Create a quick visualization of the spatial query results in Looker Studio
- In the Query results window, click Explore data, and select Explore with Looker Studio.
The Welcome to Google Looker Studio message box opens.
- Click Get Started.
Notice that default visualizations are created for the data.
-
To remove the default visualizations, right-click on each, and select Delete.
-
Click Add a chart on the top menu bar.
-
Under Google Maps, select Line map.
-
To add the line map to the canvas space, click in the center of the canvas space.
If desired, you can click on each corner to move and stretch the visualization to fill the canvas.
Notice the message stating "Chart configuration incomplete". You address this issue in the next step.
- For Setup > Geospatial field, click on flood_poly, and select road_geometry.
If you do not see the Setup panel, click on the line map to activate the panel.
-
For Setup > Fields > Location, click on Invalid dimension, and select id.
-
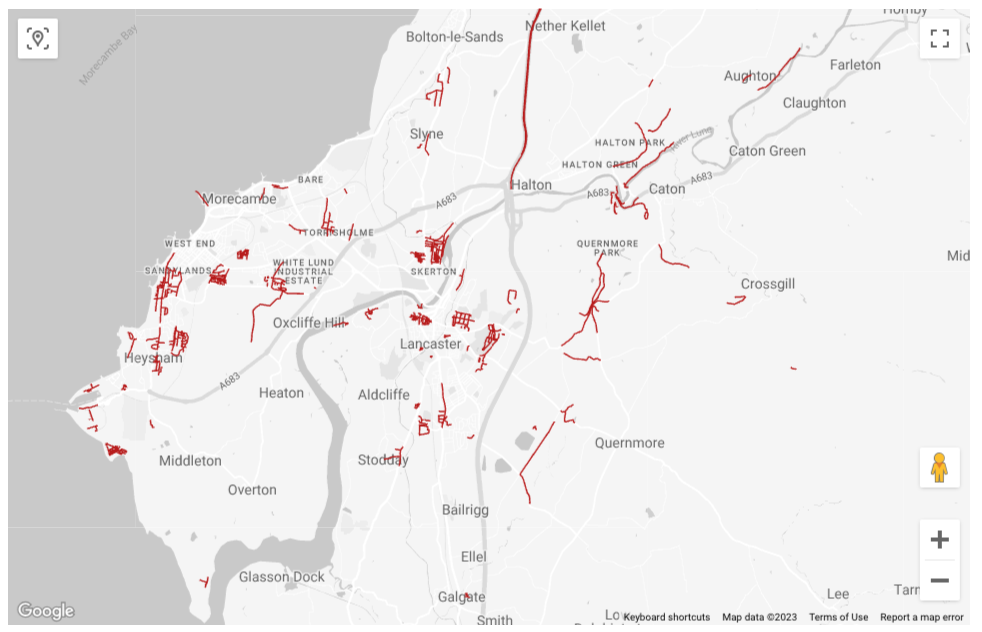
For Style > Line Map Layer, click on the Line color icon (pencil), and select any color such as red.
The flooded road segments are visible in red on the background street map.
You can finalize your visualization by exploring other style options, export to PDF by navigating to File > Download > PDF, or click Save and share to create a shareable link.
To learn more about these options to finalize and share visualizations, review examples and tutorials on Looker Studio Help or complete other hands-on labs for Looker Studio on Cloud Skills Boost.
Congratulations!
You learned how to export data from Google Earth Engine to BigQuery, combine exported data with public datasets in BigQuery using spatial queries, and create a quick visualization of the results in Looker Studio.
Google Cloud training and certification
...helps you make the most of Google Cloud technologies. Our classes include technical skills and best practices to help you get up to speed quickly and continue your learning journey. We offer fundamental to advanced level training, with on-demand, live, and virtual options to suit your busy schedule. Certifications help you validate and prove your skill and expertise in Google Cloud technologies.
Manual Last Updated November 21, 2023
Lab Last Tested November 21, 2023
Copyright 2023 Google LLC All rights reserved. Google and the Google logo are trademarks of Google LLC. All other company and product names may be trademarks of the respective companies with which they are associated.