GSP1160

Overview
Looker is a modern data platform in Google Cloud that lets you analyze and visualize your data interactively. You can use Looker to do in-depth data analysis, integrate insights across different data sources, build actionable data-driven workflows, and create custom data applications.
In this lab, you will learn how to use Looker to create alerts from a dashboard. With alerts, you can specify conditions in your data that, when met or exceeded, trigger a notification to be sent to specific recipients at a desired frequency.
Objectives
In this lab, you will learn how to create a tile-based dashboard alert in Looker.
- Use the Explore interface to create a visualization.
- Save a visualization to a new dashboard.
- Create a tile-based dashboard alert.
- Modify a time-based dashboard alert.
Setup and requirements
Before you click the Start Lab button
Read these instructions. Labs are timed and you cannot pause them. The timer, which starts when you click Start Lab, shows how long Google Cloud resources will be made available to you.
This hands-on lab lets you do the lab activities yourself in a real cloud environment, not in a simulation or demo environment. It does so by giving you new, temporary credentials that you use to sign in and access Google Cloud for the duration of the lab.
To complete this lab, you need:
- Access to a standard internet browser (Chrome browser recommended).
Note: Use an Incognito or private browser window to run this lab. This prevents any conflicts between your personal account and the Student account, which may cause extra charges incurred to your personal account.
- Time to complete the lab---remember, once you start, you cannot pause a lab.
Note: If you already have your own personal Google Cloud account or project, do not use it for this lab to avoid extra charges to your account.
How to start your lab and sign in to Looker
-
When ready, click  .
.
A new panel will appear with the temporary credentials that you must use for this lab.
If you need to pay for the lab, a pop-up will open for you to select your payment method.
-
Note your lab credentials in the left pane. You will use them to sign in to the Looker instance for this lab.
Note: If you use other credentials, you will get errors or incur charges.
-
Click Open Looker.
-
Enter the provided Username and Password in the Email and Password fields.
Important: You must use the credentials from the Connection Details panel on this page. Do not use your Google Cloud Skills Boost credentials. If you have your own Looker account, do not use it for this lab.
-
Click Log In.
After a successful login, you will see the Looker instance for this lab.
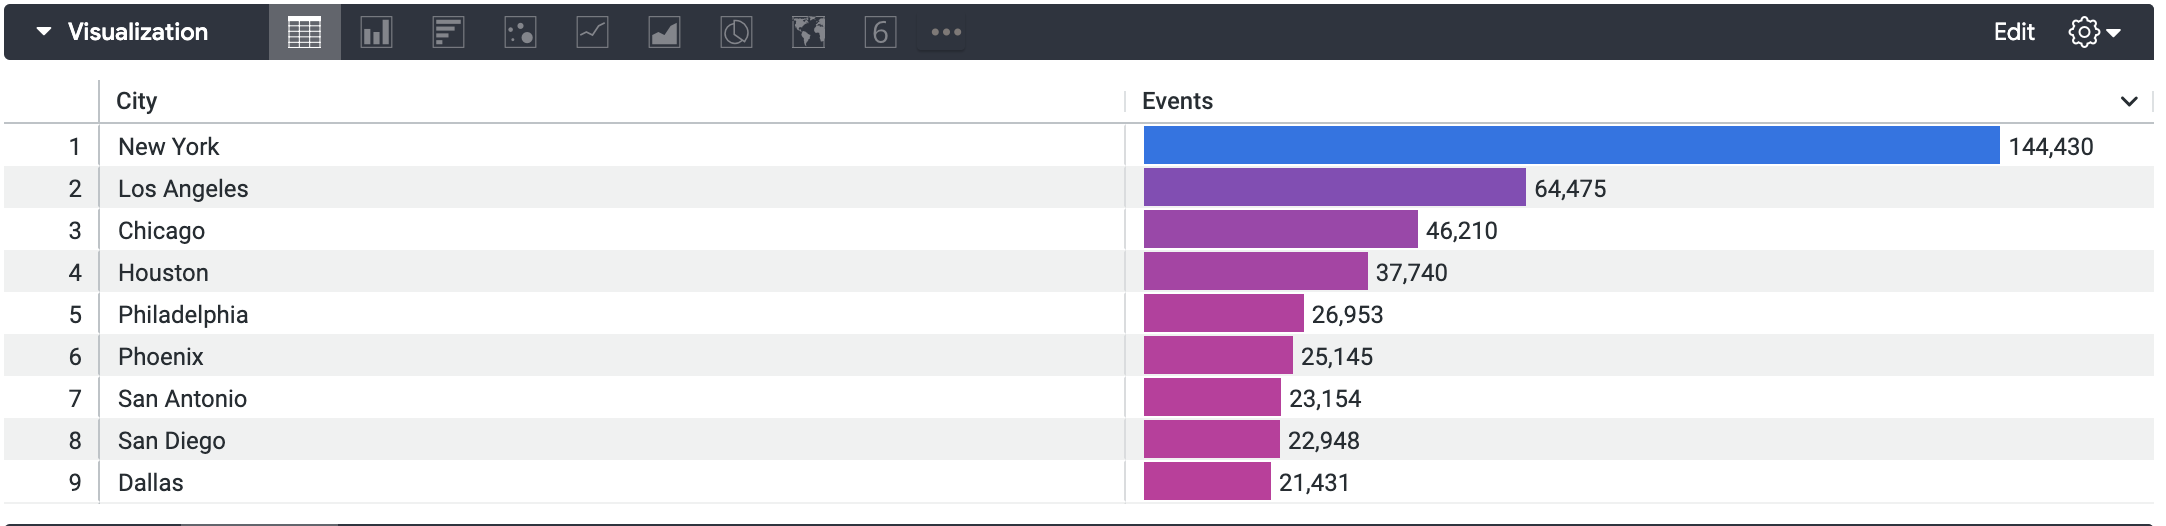
Task 1. Create a visualization on an Explore
In this task, you will create a table visualization on "E-Commerce Training" Explore.
- On the left-side navigation panel of the Looker User Interface, click Explore.
- Under E-Commerce Training, click Events.
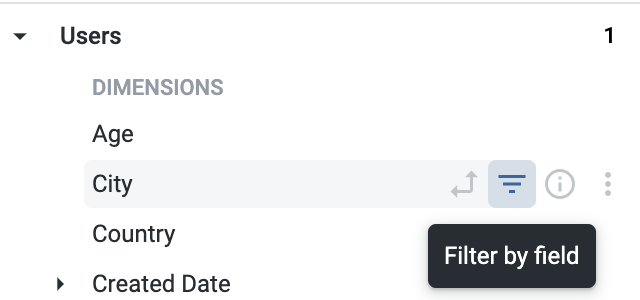
- Under Users , click City. Click the filter icon on City to filter the field to
is not null.
- Under Events, click Count. Click the header of Events Count to sort it decending.

- Set row limit to 10. Click Run.
- Click the arrow next to Visualization to expand the window and click Table visualization.
Click Check my progress to verify the objectives.
Create a visualization on an Explore
Task 2. Save the visualization to a new dashboard
In this task, you will save the visualization from Task 1 to a new dashboard.
- From the gear menu at the top-right portion of the screen, choose the Save > As a new dashboard menu option.
- Title your new Dashboard “Events count per User City”. Select Developer Student folder and then click Save.
- Back on the Explore interface, click View Dashboard.
Click Check my progress to verify the objectives.
Save the visualization to a new dashboard
Task 3. Create a new tile-based dashboard alert with a monthly frequency
In this task, you will configure a new tile-based dashboard alert that triggers monthly.
- From the last step in Task 2, you are in the editing mode of the dashboard. Click Cancel at the top-right portion of the screen to exit editing mode.
- Hover over the dashboard tile to reveal the bell icon
 .
.
- Click the bell icon to open the alert creation window.
- At the top of the alert creation window, name the alert “High events count alert”.
- In the Condition drop-down menus, set the components in sequence as
- “Any Events”
- “is greater than”
- “1000”.
- This tells Looker how to check the tile data, and if any events is greater than 1000 it will trigger an alert notification.
- Select Email from the Where to send it drop-down menu. You can designate the recipients of the alert email notification. Your email will be listed by default. Remove that and add manager@example.com instead.
- Under the Frequency drop-down menu, set the frequency to be
- This tells Looker how often to check your data for changes (and to send an alert notification if the alert conditions are met).
Note: The time clock used here employs 24 hour time, not AM/PM time notation.
- Set your alert’s permissions by selecting the “Public: visible to everyone in your organization” option from the Permissions drop-down menu in the alert creation window.
- Click the Save Alert button.
Click Check my progress to verify the objectives.
Create a new tile-based dashboard alert
Task 4. Modify an existing tile-based dashboard alert
In this task, modify an existing tile-based dashboard alert.
- Please start from your new “High events count alert” tile-based dashboard alert on the same dashboard in Looker.
- Hover over the dashboard tile to reveal the bell icon.
- Click the bell icon to see the list of alerts on the dashboard.
Note: You can choose to follow or unfollow any time-based dashboard alert to which you have access.
- Click on the vertical three-dot menu, and then select the Edit Alert menu option.
- Under the Frequency section of the alert creation window, change the frequency to be “Minutes”. The default setting is to check the data every 15 minutes.
- Set the Start time to be 08:00, and the End time to be 17:00.
Note:
The time clock used here employs 24 hour time, not AM/PM time notation.
Note: Start and End times are inclusive.
- Click the Save Alert button.
Congratulations!
In this lab, you learned how to create and edit a tile-based alert on a Looker dashboard.
Next steps / Learn more
Learn more about dashboard alerts in the Looker documentation
Google Cloud training and certification
...helps you make the most of Google Cloud technologies. Our classes include technical skills and best practices to help you get up to speed quickly and continue your learning journey. We offer fundamental to advanced level training, with on-demand, live, and virtual options to suit your busy schedule. Certifications help you validate and prove your skill and expertise in Google Cloud technologies.
Manual Last Updated November 04, 2024
Lab Last Tested November 04, 2024
Copyright 2024 Google LLC All rights reserved. Google and the Google logo are trademarks of Google LLC. All other company and product names may be trademarks of the respective companies with which they are associated.


