

Before you begin
- Labs create a Google Cloud project and resources for a fixed time
- Labs have a time limit and no pause feature. If you end the lab, you'll have to restart from the beginning.
- On the top left of your screen, click Start lab to begin
Enable the Cloud Profiler API
/ 100
In this lab, you will deploy an inefficient Go application that is configured to collect profile data. You will learn how to use Cloud Profiler to view the application's profile data and identify potential optimizations. Finally you will evaluate approaches to modify the application, re-deploy it and evaluate the effect of the modifications made.
In this lab, you will learn how to:
Read these instructions. Labs are timed and you cannot pause them. The timer, which starts when you click Start Lab, shows how long Google Cloud resources are made available to you.
This hands-on lab lets you do the lab activities in a real cloud environment, not in a simulation or demo environment. It does so by giving you new, temporary credentials you use to sign in and access Google Cloud for the duration of the lab.
To complete this lab, you need:
Click the Start Lab button. If you need to pay for the lab, a dialog opens for you to select your payment method. On the left is the Lab Details pane with the following:
Click Open Google Cloud console (or right-click and select Open Link in Incognito Window if you are running the Chrome browser).
The lab spins up resources, and then opens another tab that shows the Sign in page.
Tip: Arrange the tabs in separate windows, side-by-side.
If necessary, copy the Username below and paste it into the Sign in dialog.
You can also find the Username in the Lab Details pane.
Click Next.
Copy the Password below and paste it into the Welcome dialog.
You can also find the Password in the Lab Details pane.
Click Next.
Click through the subsequent pages:
After a few moments, the Google Cloud console opens in this tab.

Cloud Shell is a virtual machine that is loaded with development tools. It offers a persistent 5GB home directory and runs on the Google Cloud. Cloud Shell provides command-line access to your Google Cloud resources.
Click Activate Cloud Shell 
Click through the following windows:
When you are connected, you are already authenticated, and the project is set to your Project_ID,
gcloud is the command-line tool for Google Cloud. It comes pre-installed on Cloud Shell and supports tab-completion.
Output:
Output:
gcloud, in Google Cloud, refer to the gcloud CLI overview guide.
In this scenario, the server uses a gRPC framework, receives a word or phrase, and returns the number of times the word or phrase appears in the works of Shakespeare.
The average number of queries per second that the server can handle is determined by load testing the server. For each round of tests, a client simulator is called and instructed to issue 20 sequential queries. At the completion of a round, the number of queries sent by the client simulator, the elapsed time, and the average number of queries per second are displayed. The server code is inefficient (by design) for improvements to be made.
In this lab, the sample application's execution time is just long enough to collect profile data. In practice, it's desirable to have at least 10 profiles before analyzing profile data.
1 and the number of rounds set to 15:If prompted, click Authorize on the modal dialog.
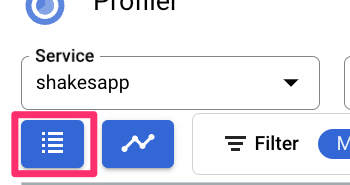
Profiler and select the corresponding service from the drop down when it appers.Notice that the Profile type is set to CPU time. This indicates that CPU usage data is displayed on the flame graph presented.
The output from Cloud Shell displays the elapsed time for each iteration and the average request rate.
When the application is started, the entry "Simulated 20 requests in 17.3s, rate of 1.156069 reqs / sec" indicates that the server is executing about 1 request per second.
By the last round, the entry "Simulated 20 requests in 1m48.03s, rate of 0.185134 reqs / sec" indicates that the server is executing about 1 request every 5 seconds.
Click Check my progress to verify the objective.
One approach to maximizing the number of queries per second is to identify CPU intensive methods and optimize their implementations. In this section, you use CPU time profiles to identify a CPU intensive method on the server.
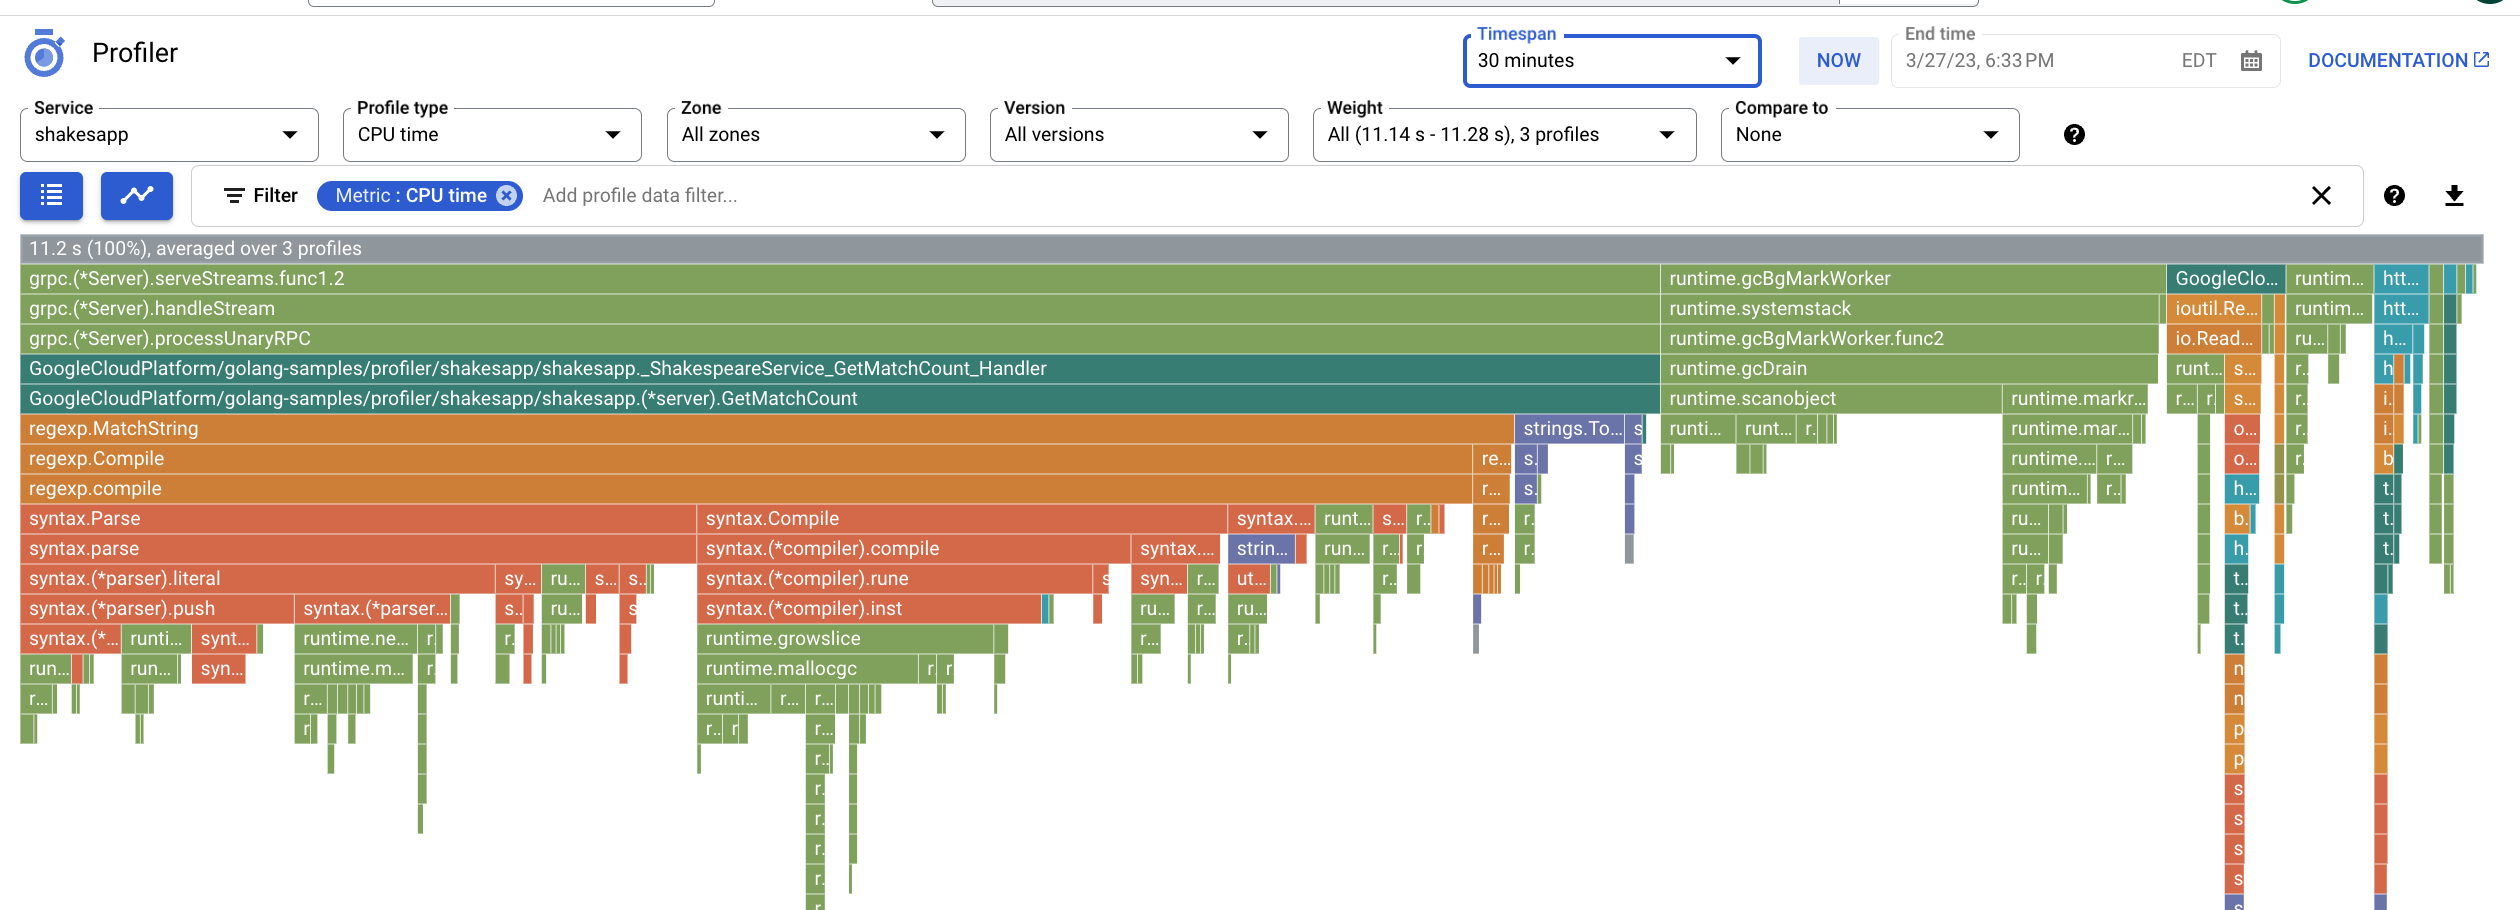
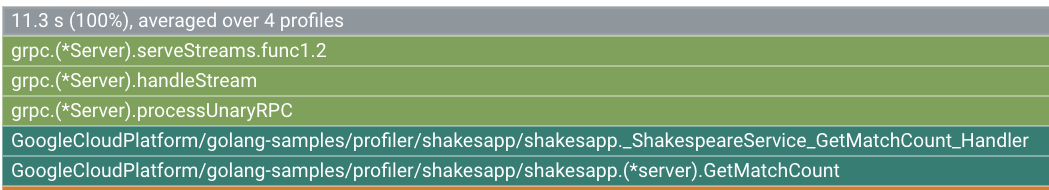
The root frame of the flame graph lists the total CPU time used by the application over the collection interval of 10 seconds:
In the example above, the service used 11.3s. When the system runs on a single core, a CPU time usage of 11.3 seconds corresponds to 113% utilization of that core! For more information on profiling, see the types of profiling available.
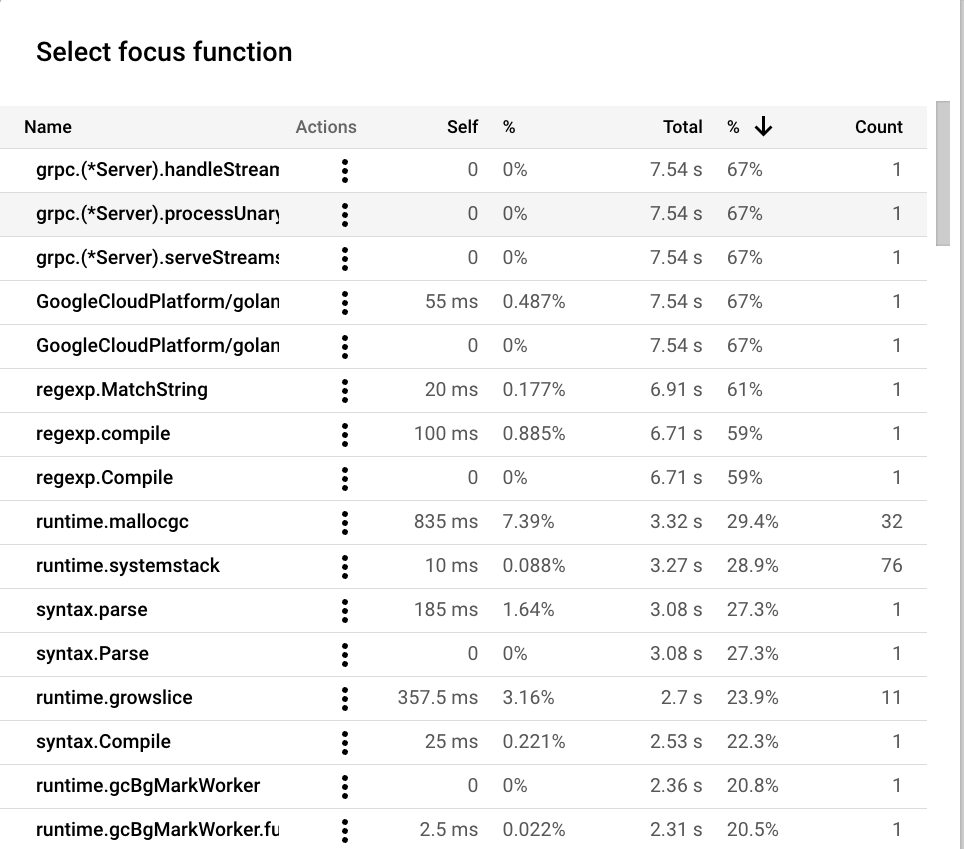
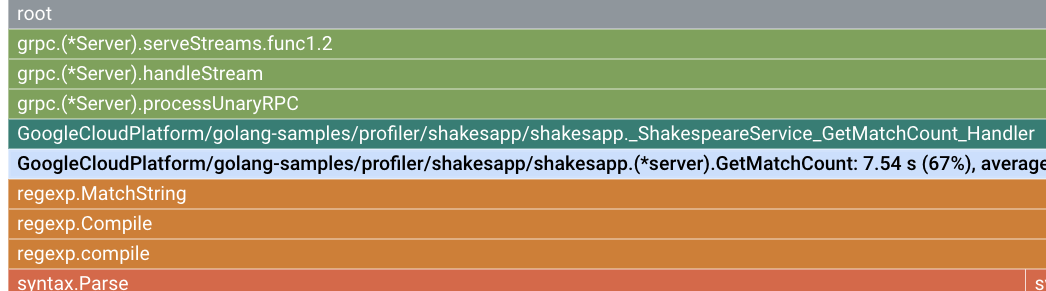
One way you can identify code that might need to be optimized is to view the table of functions and identify greedy functions:
In this example, GetMatchCount is the first shakesapp/server.go function that is listed. That function used 7.54s of the total CPU time, or 67% of the applications total CPU time. This function is known to be handling the gRPC requests.
The flame graph shows that the shakesapp/server.go function GetMatchCount calls MatchString, which in turn is spending most of its time calling Compile:
Rely on your language expertise. MatchString is a regular-expression method. In general, regular-expression processing is very flexible, but not necessarily the most efficient solution for every problem.
Rely on your application expertise. The client is generating a word or phrase, and the server is searching for this phrase.
Search the implementation of the shakesapp/server.go method GetMatchCount for uses of MatchString, and then determine if a simpler, more efficient function could replace that call.
In the file shakesapp/server.go, the existing code contains one call to MatchString:
One option is to replace the MatchString logic with equivalent logic that uses strings.Contains.
Click the Open Editor button at the top of the Cloud Shell and open the server.go file in the directory /profiler/shakesapp/shakesapp/server.go when the editor opens. Replace the MatchString logic shown above with the snippet below then save the file.
To evaluate the change, do the following:
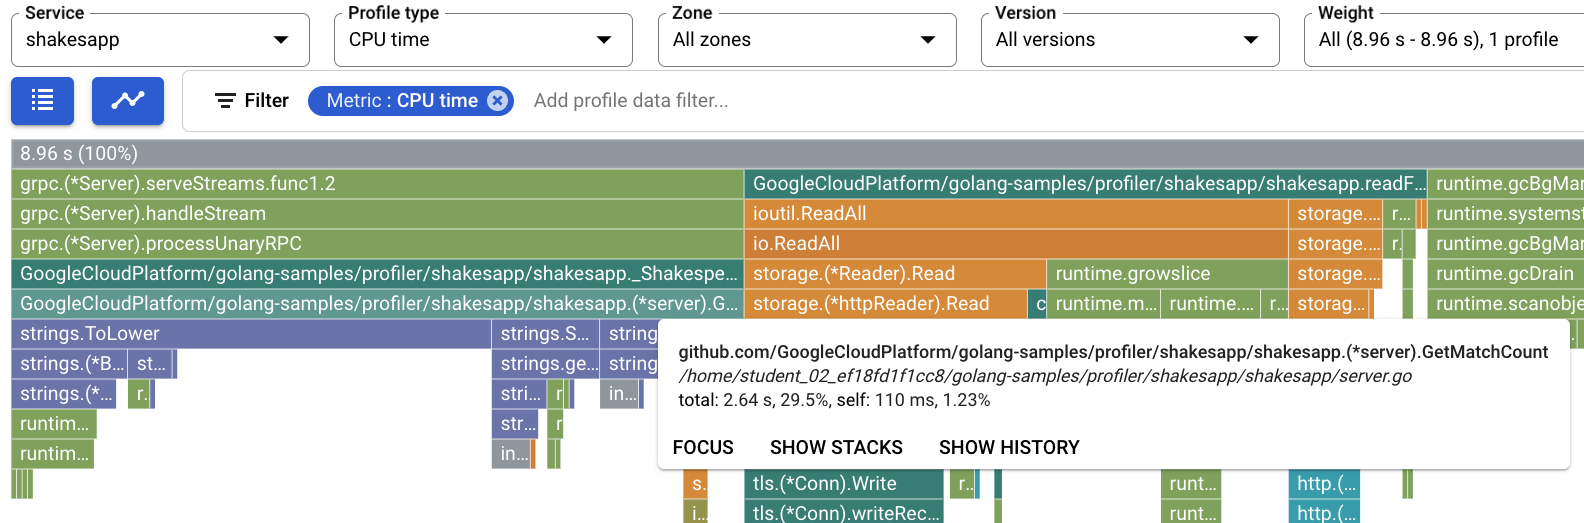
2:For one example, the flame graph is as shown:
In this figure, the root frame shows a value of 8.96 s. As a result of changing the string-match function, the CPU time used by the application decreased from 11.3 seconds to 8.96 seconds, or the application went from using 113% of a CPU core to using 89.6% of a CPU core.
The frame width is a proportional measure of the CPU time usage. In this example, the width of the frame for GetMatchCount indicates that function uses about 29.5% of all CPU time used by the application. In the original flame graph, this same frame was about 67% of the width of the graph. To view the exact CPU time usage, you can use the frame tooltip or you can use the Focus function list:
The small change to the application had two different effects:
In this task, you will learn how to use the heap and allocated heap profiles to identify an allocation-intensive method in the application.
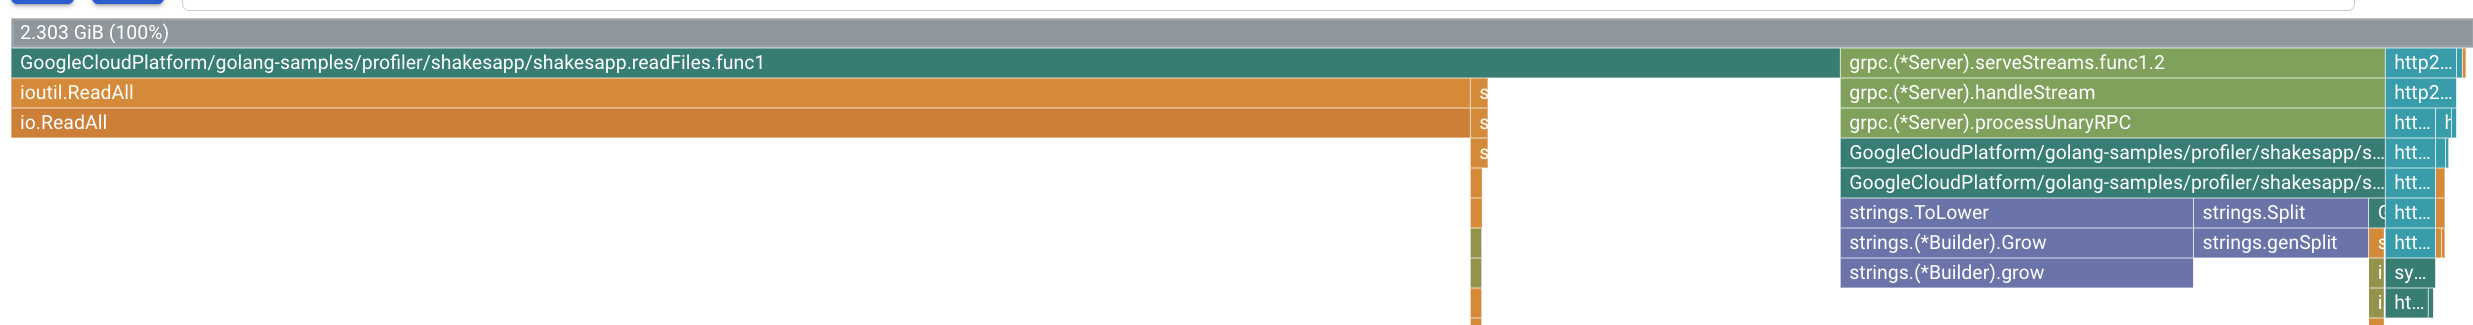
3 and enable the collection of heap and allocated heap profiles.For one example, the flame graph is as shown:
The root frame displays the total amount of heap that was allocated during the 10 seconds when a profile was collected, averaged over all profiles. In this example, the root frame shows that, on average, 2.303 GiB of memory was allocated.
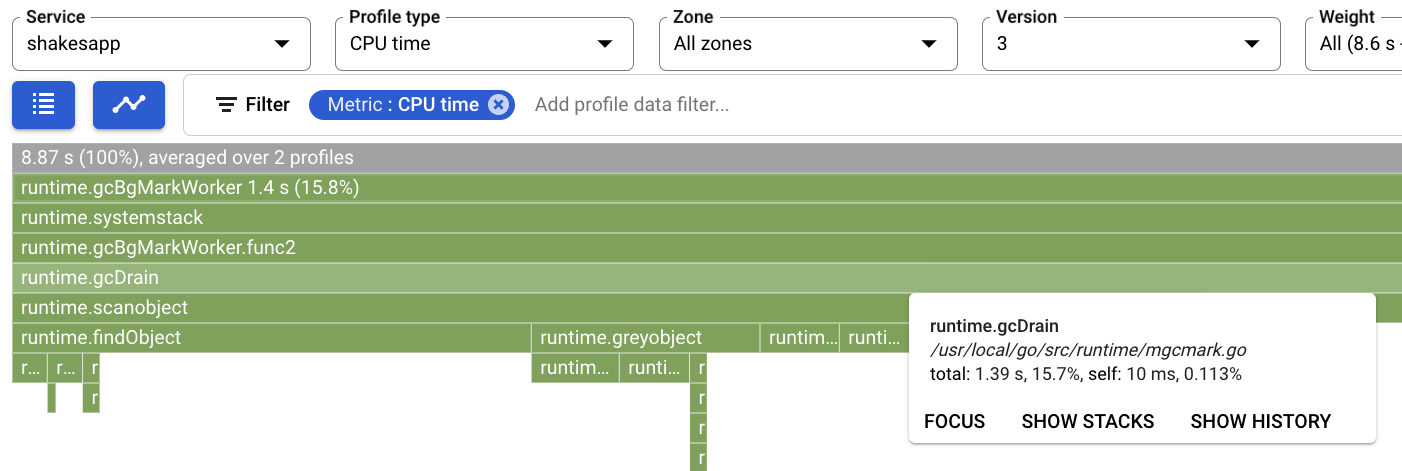
The CPU time usage of the Go background garbage collection function, runtime.gcBgMarkWorker.*, can be used to determine if it's worth the effort to optimize an application to reduce garbage collection costs:
For this example, the CPU time usage of the background garbage collector is 15.8%. This value is high enough that it's worth attempting to optimize shakesapp/server.go:
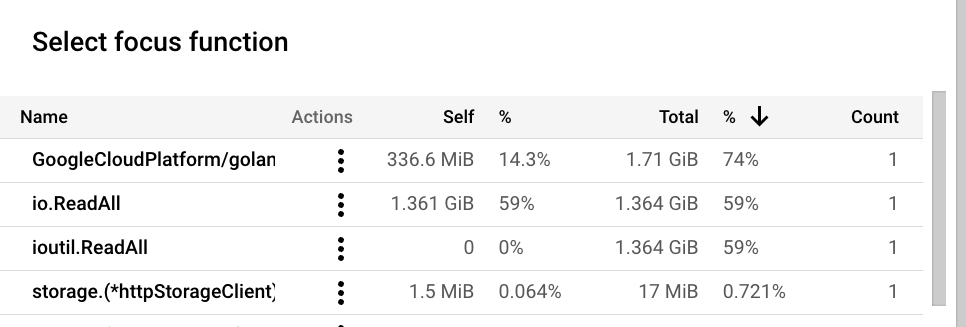
The file shakesapp/server.go contains two functions that might be targets for optimization: GetMatchCount and readFiles. To determine the rate of memory allocation for these functions, set the Profile type to Allocated heap, and then use the list Focus function list.
In this example, the total heap allocation for readFiles.func1 during the 10 second profile collection is, on average, 1.71 GiB or 74% of the total allocated memory. The self heap allocation during the 10 second profile collection is 336.6 MiB:
In this example, the Go method io.ReadAll allocated 1.361 GiB during the 10 second profile collection, on average. The simplest way to reduce these allocations is to reduce calls to io.ReadAll. The function readFiles calls io.ReadAll through a library method.
One option is to modify the application to read the files one time and then to re-use that content. For example, you could make the following changes. Open Cloud Shell and then Cloud Editor similar to the previous task to modify the server.go file. This should be located at the path golang-samples/profiler/shakesapp/shakesapp:
files to store the results of the initial file read:Place this under the package imports at the top of the server.go file.
readFiles to return early when files is defined:Replace the logic below:
With the snippet following snippet:
After making changes in the readFiles function, the code should look like this.
Save the file and click Open Terminal to go back to Cloud Shell.
To evaluate the change, do the following:
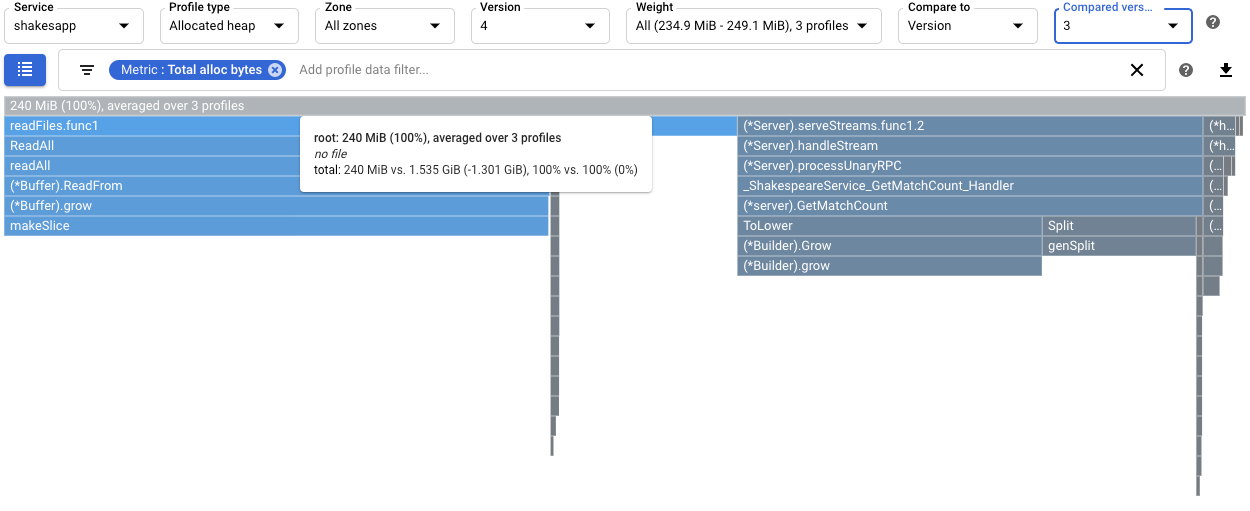
4:readFiles on the heap allocation rate, compare the allocated heap profiles for version 4 to those collected for 3:In this example, the root frame's tooltip shows that with version 4, the average amount of memory allocated during profile collection decreased by 1.301 GiB, as compared to version 3. The tooltip for readFiles.func1 shows a decrease of 1.045 GiB:
To determine if there is an impact of the change on the number of requests per second handled by the application, view the output in the Cloud Shell.
In the example below, version 4 completes up to 15 requests per second, which is substantially higher than the ~5 requests per second of version 3:
The increase in queries per second served by the application might be due to less time being spent on garbage collection.
In this lab, you explored the Cloud Operations suite, which allows Site Reliability Engineers (SRE) to investigate and diagnose issues experienced with workloads deployed.
CPU time and allocated heap profiles were used to identify potential optimizations to an application. The goals were to maximize the number of requests per second and to eliminate unnecessary allocations.
By using CPU time profiles, a CPU intensive function was identified. After applying a simple change, the server's request rate increased.
By using allocated heap profiles, the shakesapp/server.go function readFiles was identified as having a high allocation rate. After optimizing readFiles, the server's request rate increased to 15 requests per second.
This self-paced lab is part of the Cloud Architecture and DevOps Essentials quests. A quest is a series of related labs that form a learning path. Completing a quest earns you a badge to recognize your achievement. You can make your badge or badges public and link to them in your online resume or social media account. Enroll in any quest that contains this lab and get immediate completion credit. Refer to the Google Cloud Skills Boost catalog for all available quests.
Continue your quest or check out these suggested materials:
...helps you make the most of Google Cloud technologies. Our classes include technical skills and best practices to help you get up to speed quickly and continue your learning journey. We offer fundamental to advanced level training, with on-demand, live, and virtual options to suit your busy schedule. Certifications help you validate and prove your skill and expertise in Google Cloud technologies.
Manual Last Updated: August 16, 2023
Lab Last Tested: August 16, 2023
When you have completed your lab, click End Lab. Your account and the resources you've used are removed from the lab platform.
You will be given an opportunity to rate the lab experience. Select the applicable number of stars, type a comment, and then click Submit.
The number of stars indicates the following:
You can close the dialog box if you don't want to provide feedback.
For feedback, suggestions, or corrections, please use the Support tab.
Copyright 2025 Google LLC. All rights reserved. Google and the Google logo are trademarks of Google LLC. All other company and product names may be trademarks of the respective companies with which they are associated.


This content is not currently available
We will notify you via email when it becomes available

Great!
We will contact you via email if it becomes available

One lab at a time
Confirm to end all existing labs and start this one