
准备工作
- 实验会创建一个 Google Cloud 项目和一些资源,供您使用限定的一段时间
- 实验有时间限制,并且没有暂停功能。如果您中途结束实验,则必须重新开始。
- 在屏幕左上角,点击开始实验即可开始
Create a Compute Engine VM instance
/ 20
Install an Apache Web Server
/ 20
Install the Ops Agent
/ 30
Create an alerting policy
/ 30
As a cloud administrator, you are in charge of monitoring your infrastructure. You would like to monitor an Apache Web Server, and visualize data on a dashboard.
Some of your concerns are:
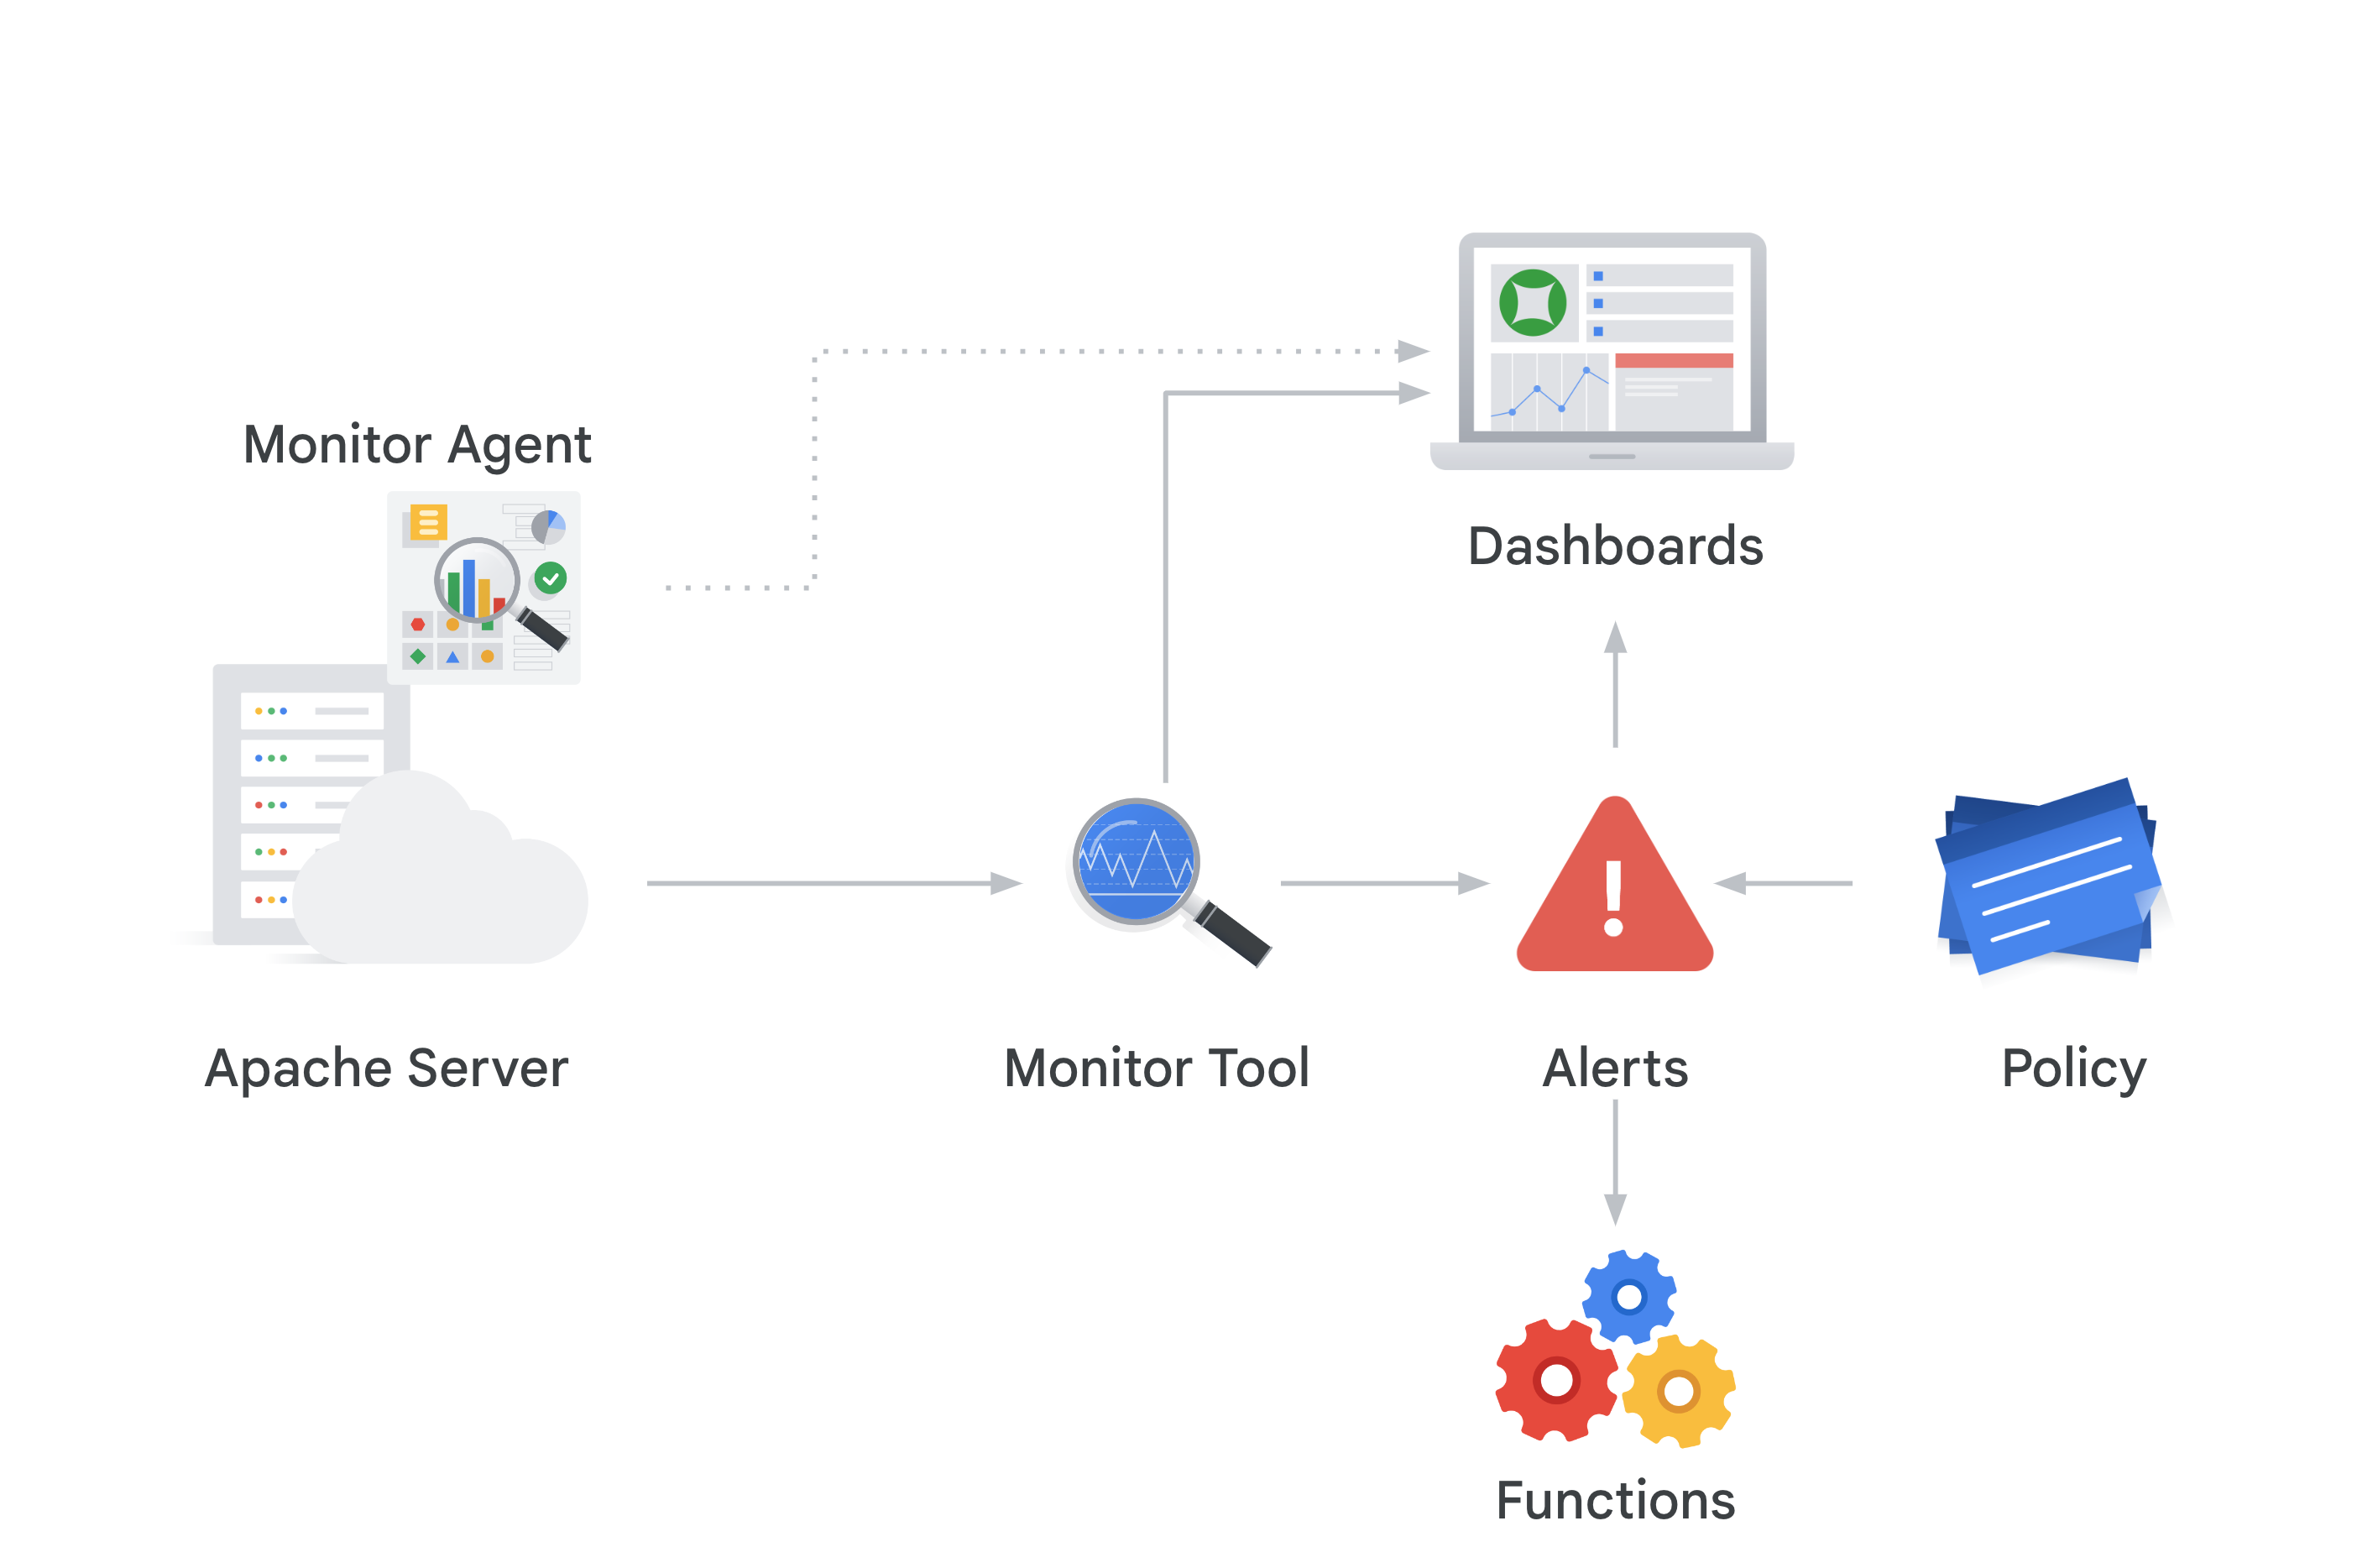
The monitoring workflow in Azure Monitor is as shown in the diagram:
In Azure, you install an Apache Web Server over your virtual machine (VM). Then you connect an Azure Monitor Agent on this server to collect data. Using Azure Monitor, configure Log Analytics to set up the logs and metrics that you want to visualize in a dashboard. Then name the dashboard to keep it readily available. Within Azure Monitor, you can configure the alerts to initiate a call to Azure Functions that automates the response to an alert. An Alert can also be generated whenever the definition of an Azure policy is not met.
In this lab you will create a compute engine to install and configure an Ops Agent. You will generate traffic and view metrics on the predefined Apache dashboard and also create an alerting policy.
In this lab, you learn how to perform the following tasks:
In Google Cloud console, navigate to Compute Engine > VM instance.
To create a VM instance, click Create instance.
Fill in the fields for your instance as follows:
quickstart-vm.Leave the rest of the fields at their default values.
Click Check my progress to verify the objective.
To deploy an Apache Web Server on your Compute Engine VM instance, do the following:
To open a terminal to your instance, in the Connect column, click SSH.
To update the package lists on your instance, run the following command:
http://EXTERNAL_IP, where EXTERNAL_IP is the external IP address of your VM. You can find this address in the External IP column of your VM instance.Click Check my progress to verify the objective.
To collect logs and metrics from your Apache Web Server, install the Ops Agent by using the terminal:
To open a terminal to your VM instance, in the Connect column, click SSH.
To install the Ops Agent, run the following command:
You see google-cloud-ops-agent installation succeeded.
The previous command creates the configuration to collect and ingest logs and metrics from the Apache Web Server. For more information about ingesting logs from the Apache Web Server, see Configure the Ops Agent for Apache Web Server.
Click Check my progress to verify the objective.
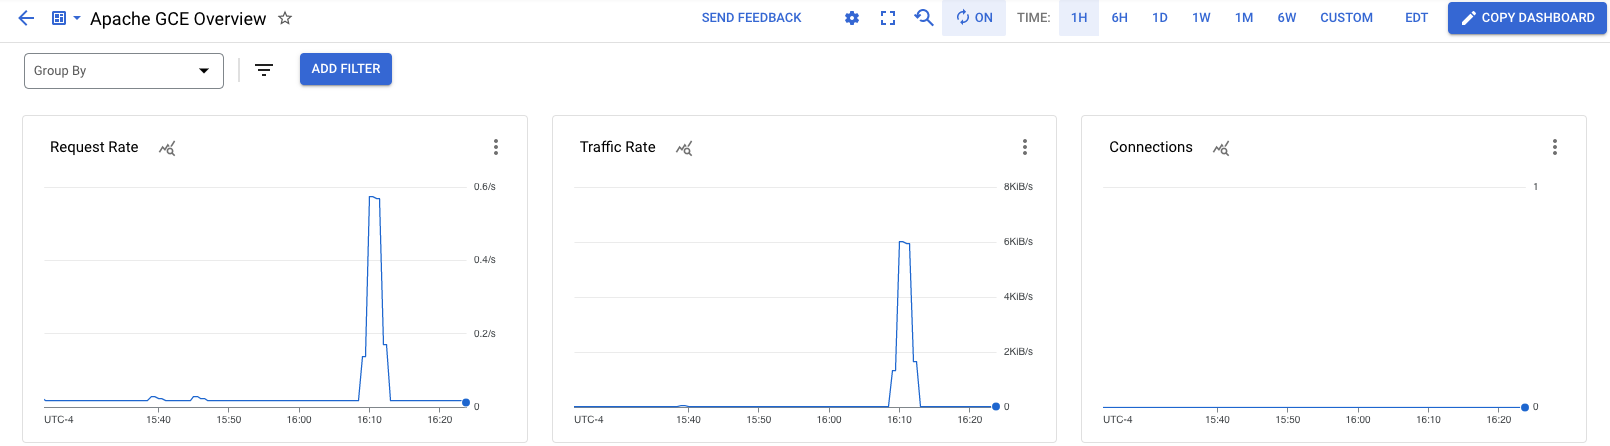
Monitoring dashboards let you view and analyze metrics related to your services. In this quickstart, you generate metrics on your Apache Web Server and view metric data on the automatically created Apache overview dashboard.
To generate metrics on your Apache Web Server, do the following:
In the Google Cloud console, go to Compute Engine.
In the Connect column, click SSH to open a terminal to your VM instance.
To generate traffic on your Apache Web Server, run the following command:
The previous command generates traffic by making a request to the Apache Web Server every four seconds.
To view the Apache GCE Overview dashboard, do the following:
In the Google Cloud console, search for Monitoring in the top search bar and navigate to the Monitoring service.
In the navigation pane, select Dashboards.
In All Dashboards, select the Apache GCE Overview dashboard. The dashboard opens.
In the dashboard, there are several charts that contain information about your Apache and Compute Engine integration:
An email address you have access to
To create an alerting policy that monitors a metric and sends an email notification when the traffic rate on your Apache Web Server exceeds 4 KiB/s, do the following:
In the Google Cloud console > Monitoring select Alerting and then click Create policy.
Select the time series to be monitored:
The chart for Apache traffic is shown.
1 min
rate
Any time series violates
Above threshold
4000
An email address you have access to
30 min
Apache traffic above threshold
Click Check my progress to verify the objective.
To test the alerting policy you just created, do the following:
Navigate to Cloud Console > Compute Engine.
In the Connect column, click SSH to open a terminal to your VM instance.
In the terminal, enter the following command:
The previous command generates traffic in your Apache Web Server.
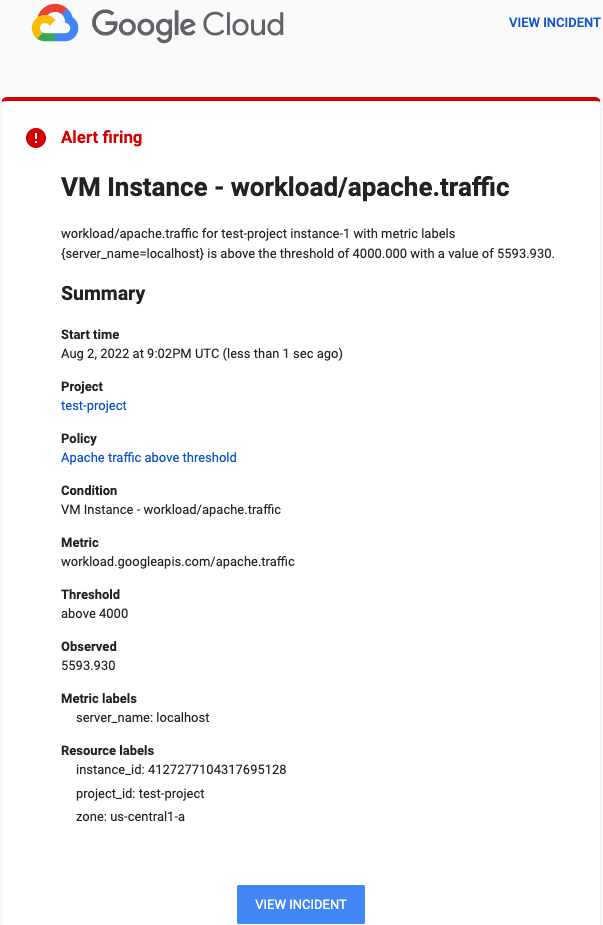
After the traffic rate threshold value of 4 KiB/s is exceeded in your Apache Web Server, an email notification is sent. It might take several minutes for this process to complete.
The email notification you receive looks similar to the following:
In this lab, you learned how to install an Ops Agent on a VM and use it to set an alerting policy to notify a recipient of potential issues with the instance.
Ops Agent, similar to Azure Monitor Agent, is used to collect telemetry data from your Virtual machine instances. Here are some similarities and differences between the two services:
Similarities:
Differences:
When you have completed your lab, click End Lab. Google Cloud Skills Boost removes the resources you’ve used and cleans the account for you.
You will be given an opportunity to rate the lab experience. Select the applicable number of stars, type a comment, and then click Submit.
The number of stars indicates the following:
You can close the dialog box if you don't want to provide feedback.
For feedback, suggestions, or corrections, please use the Support tab.
Copyright 2022 Google LLC All rights reserved. Google and the Google logo are trademarks of Google LLC. All other company and product names may be trademarks of the respective companies with which they are associated.


此内容目前不可用
一旦可用,我们会通过电子邮件告知您

太好了!
一旦可用,我们会通过电子邮件告知您

一次一个实验
确认结束所有现有实验并开始此实验