

Before you begin
- Labs create a Google Cloud project and resources for a fixed time
- Labs have a time limit and no pause feature. If you end the lab, you'll have to restart from the beginning.
- On the top left of your screen, click Start lab to begin
BQ Query nested event
/ 25
BQ Query average pass distance
/ 25
BQ Query analyze shot distance
/ 25
BQ Query analyze shot angle
/ 25
BigQuery can be used to perform more sophisticated data analysis. In this lab, you will analyze soccer event data to achieve real insight from the dataset.
The data used in this lab comes from the following sources:
In this lab, you will learn how to:
Read these instructions. Labs are timed and you cannot pause them. The timer, which starts when you click Start Lab, shows how long Google Cloud resources are made available to you.
This hands-on lab lets you do the lab activities in a real cloud environment, not in a simulation or demo environment. It does so by giving you new, temporary credentials you use to sign in and access Google Cloud for the duration of the lab.
To complete this lab, you need:
Click the Start Lab button. If you need to pay for the lab, a dialog opens for you to select your payment method. On the left is the Lab Details pane with the following:
Click Open Google Cloud console (or right-click and select Open Link in Incognito Window if you are running the Chrome browser).
The lab spins up resources, and then opens another tab that shows the Sign in page.
Tip: Arrange the tabs in separate windows, side-by-side.
If necessary, copy the Username below and paste it into the Sign in dialog.
You can also find the Username in the Lab Details pane.
Click Next.
Copy the Password below and paste it into the Welcome dialog.
You can also find the Password in the Lab Details pane.
Click Next.
Click through the subsequent pages:
After a few moments, the Google Cloud console opens in this tab.

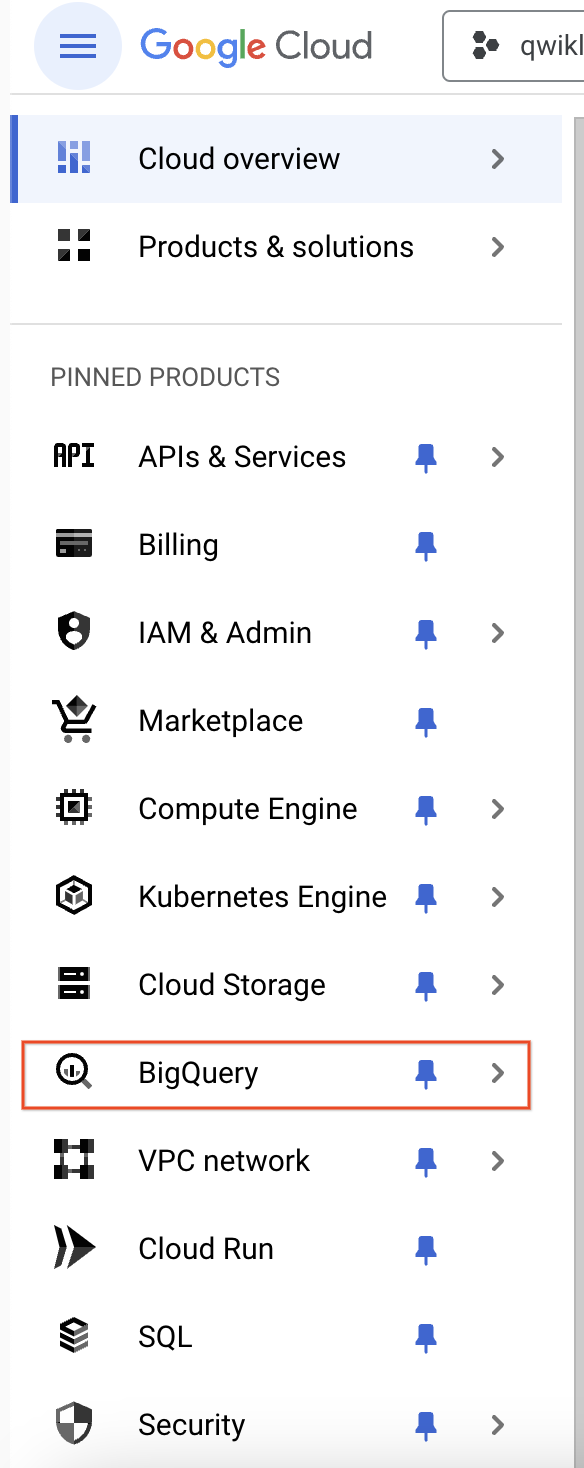
The BigQuery console provides an interface to query tables, including public datasets offered by BigQuery.
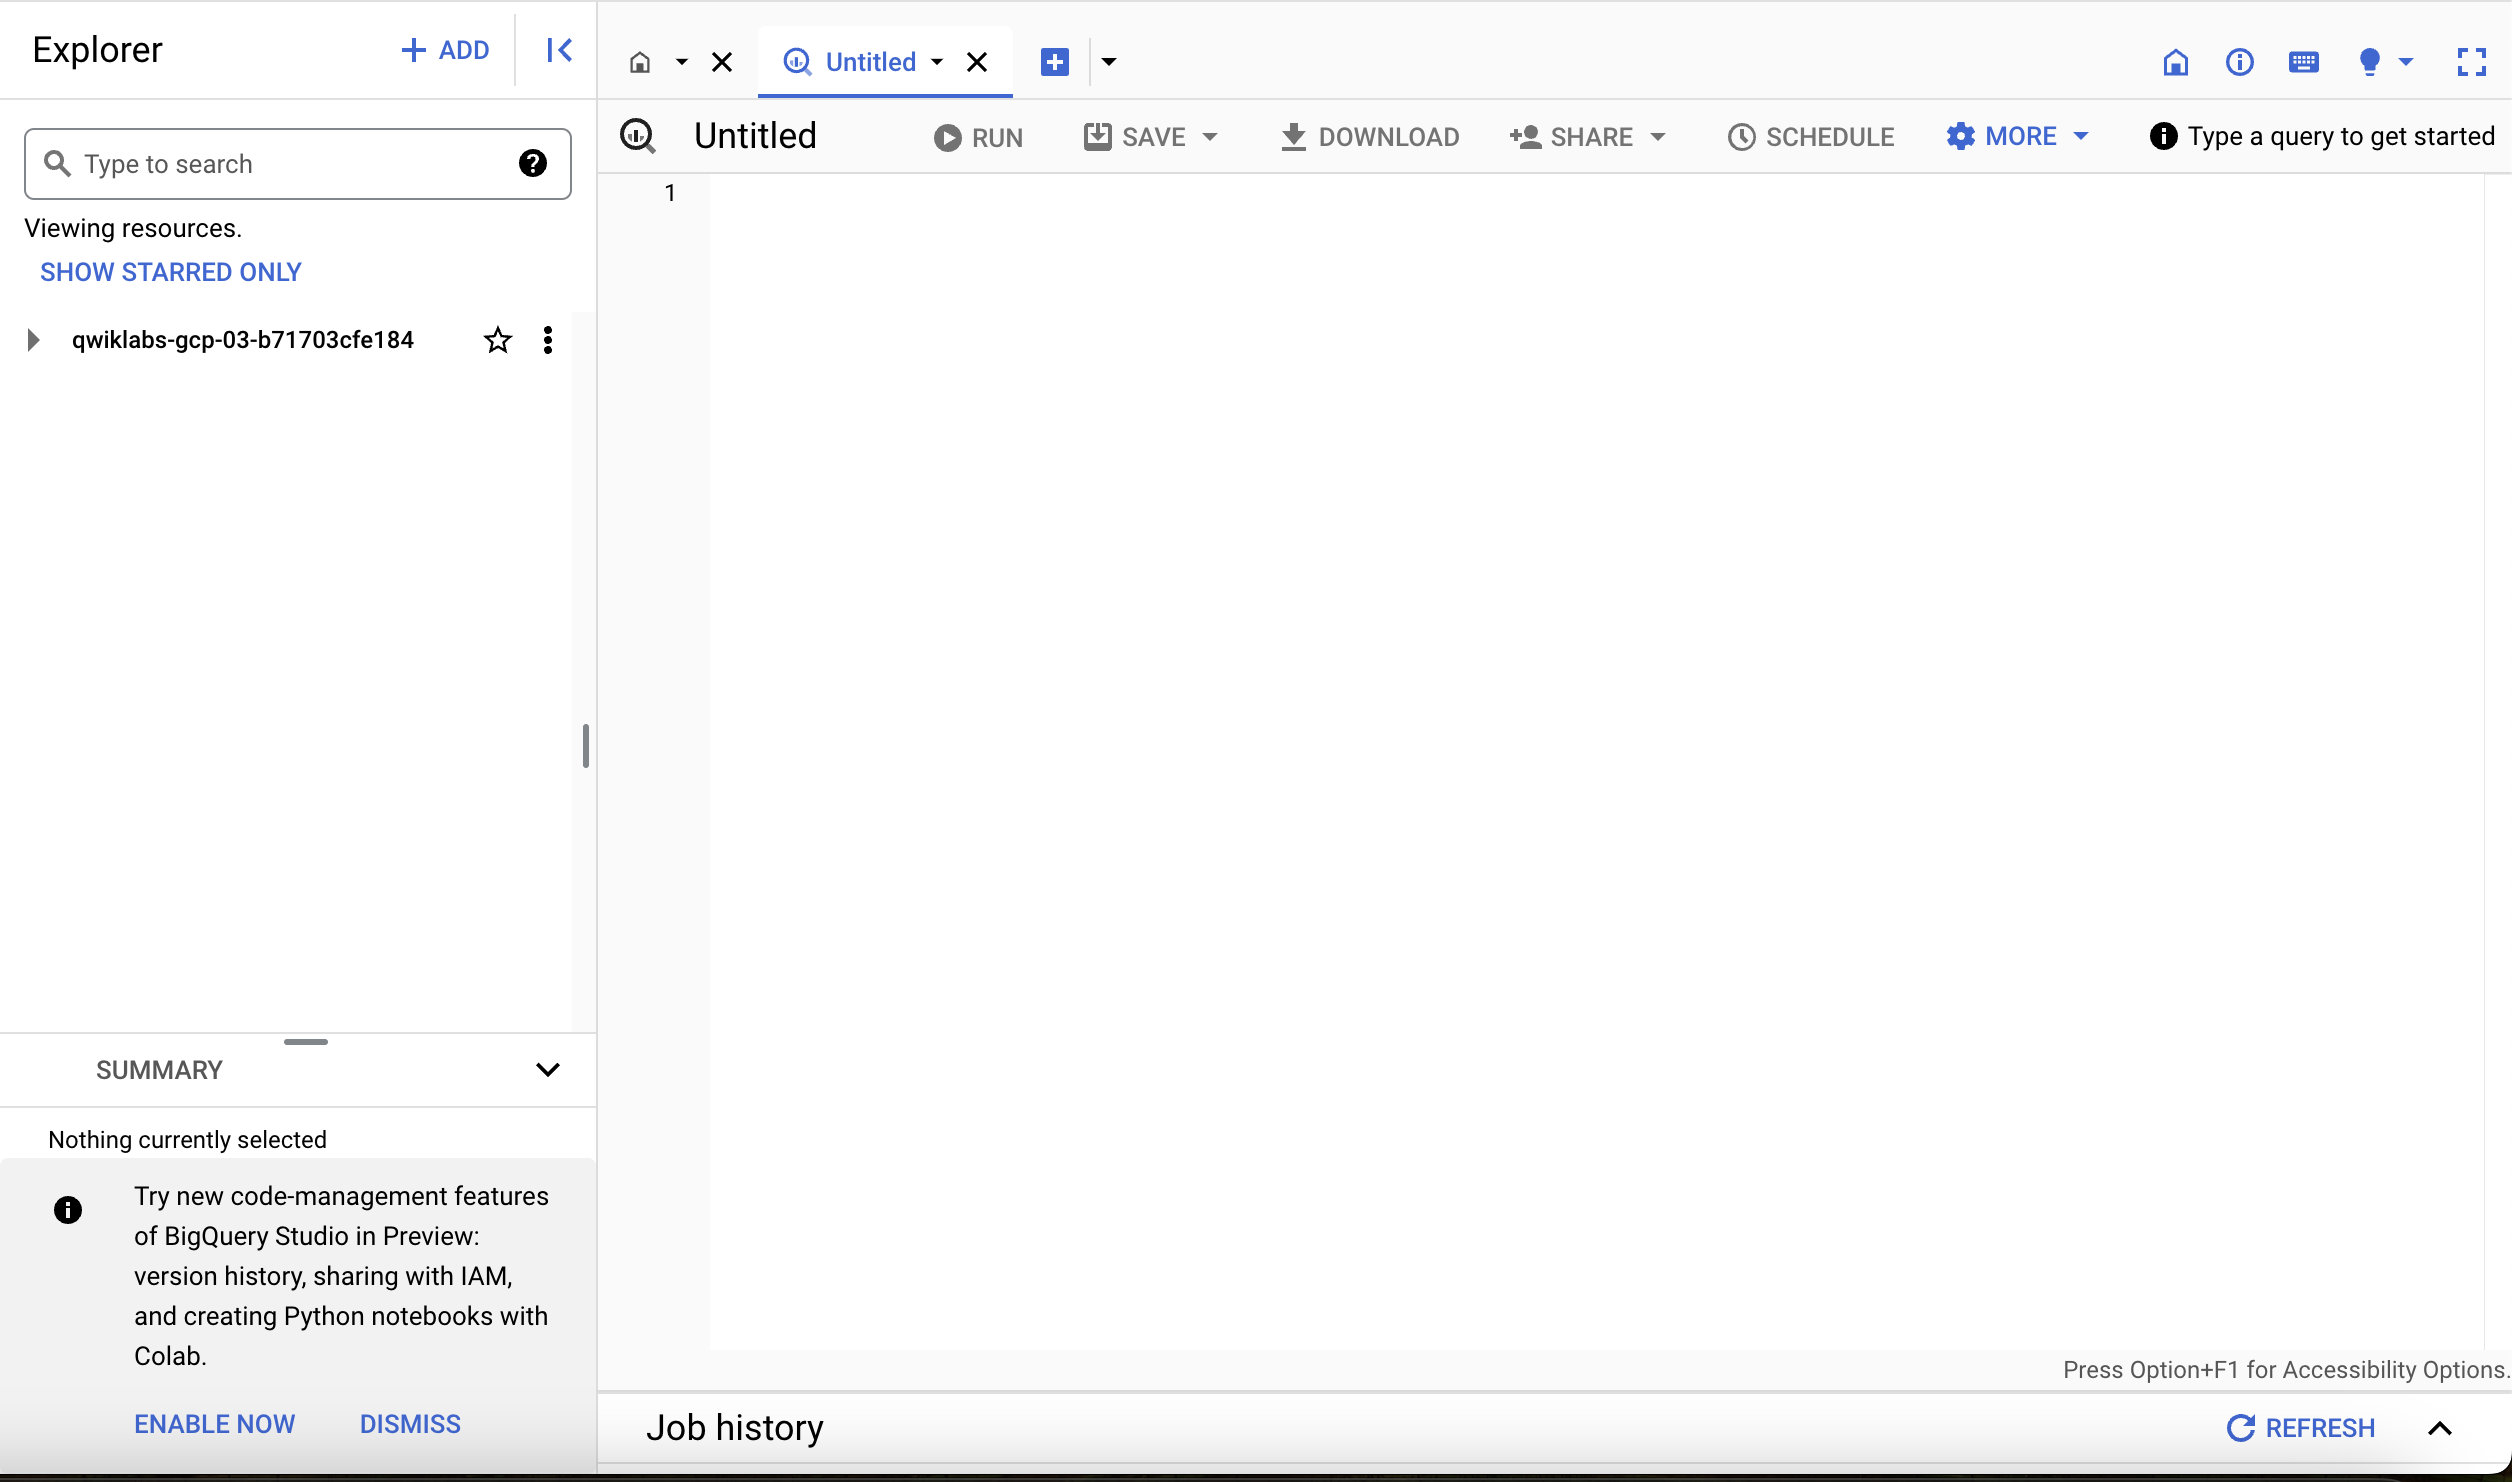
The Welcome to BigQuery in the Cloud Console message box opens. This message box provides a link to the quickstart guide and the release notes.
The BigQuery console opens.
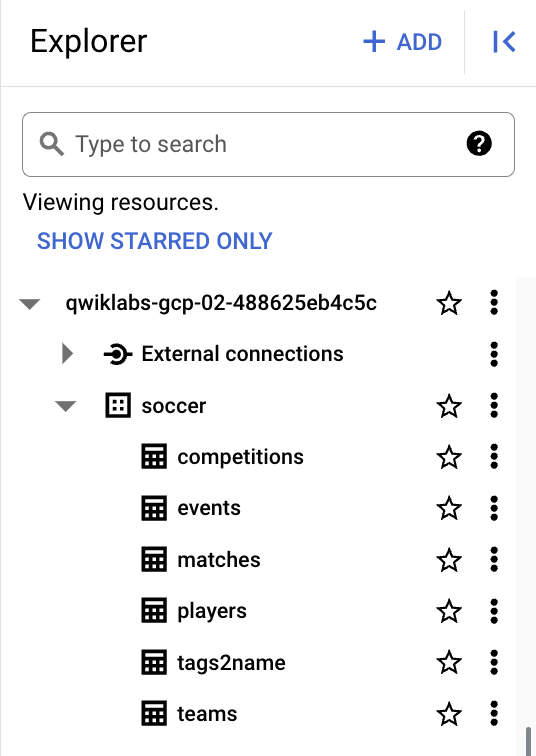
Once the tables are created the display will be similar to below:
In this section the BigQuery interface was used to access the console. The console provides a convenient way to add information to a dataset. BigQuery uses tables to represent data in a structured way.
In the next section learn more about creating more complex queries.
In this section, you will run some queries that use JOINs with BigQuery's array functionality to enable better control over the soccer event data.
Assists aren't marked as a separate scalar field in the events table, so you need to look "inside" the tags field.
This is done by using a correlated cross join between the events table and the tags field (with the "," in the FROM clause to represent an implicit join) to create 1 row per tag per event (rather than 1 row per event). The tag ID that corresponds to assists is found from the tags2name table, the number of occurrences of that tag is counted by player, and the players table gets player names from their IDs.
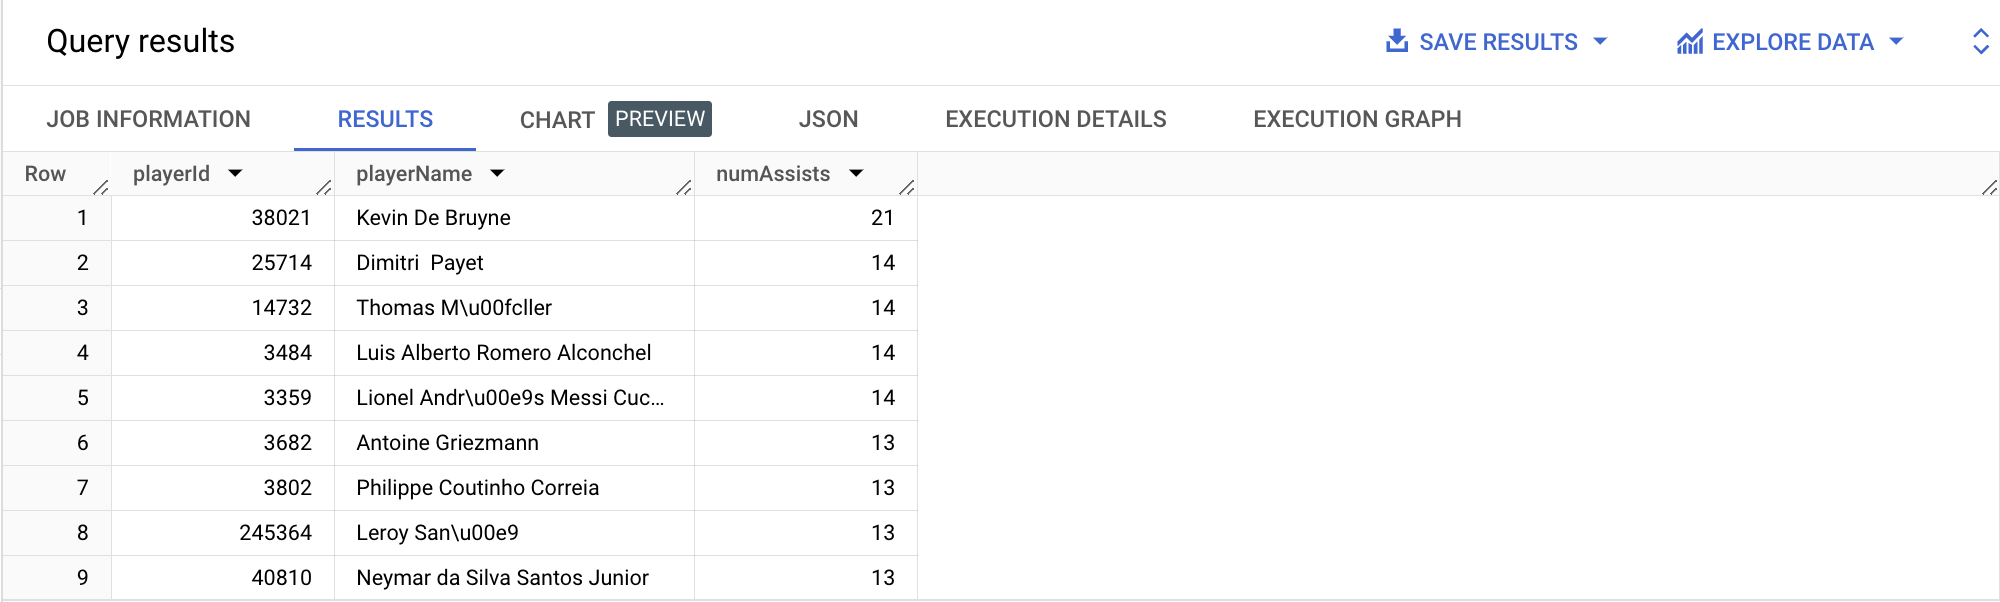
Click Check my progress to verify the objective
In this section a more complex query was created in BigQuery. Performing Joins in BigQuery and leveraging Arrays provide a powerful way to aggregate data.
In the next section learn how to use Nesting and Arrays with BigQuery.
In this section, you will run some queries that use the nested fields in the soccer event data and BigQuery's array functionality and STRUCT data type to answer some interesting questions.
To answer this question, study the positions field in the events table. Observing this data, you see that this is a repeated field that contains 1 or more (x, y) pairs per event. Per Wyscout, a leading data company in the soccer industry that provided this data, these represent the origin and (if applicable) destination positions associated with the event, on a 0-100 scale representing the percentage of the field from the perspective of the attacking team.
The screenshot below illustrates the positions corresponding to a few different event types for a few example events.
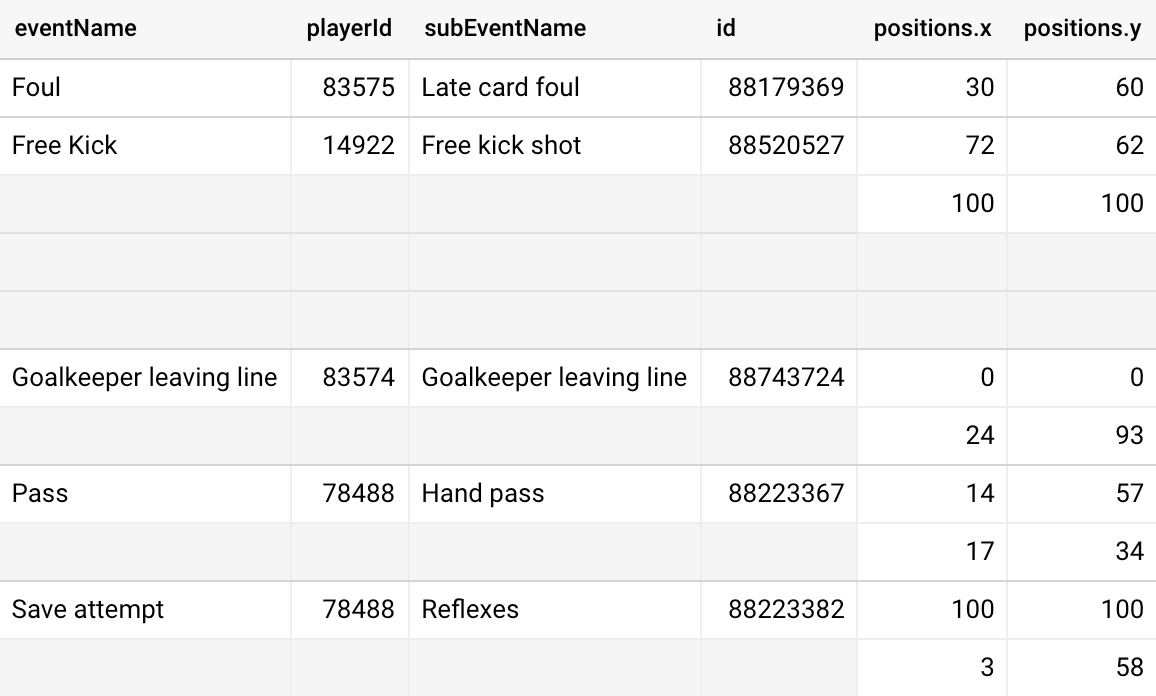
From the data you can note that passes have 2 attributes (x, y) pairs representing the start and end position. Therefore pass distance can be calculated by calculating x- and y-coordinate differences, then converting to estimated meters using the average dimensions of a soccer field (105 x 68, per Wikipedia; there is no standard field size) and the 2-dimensional distance formula.
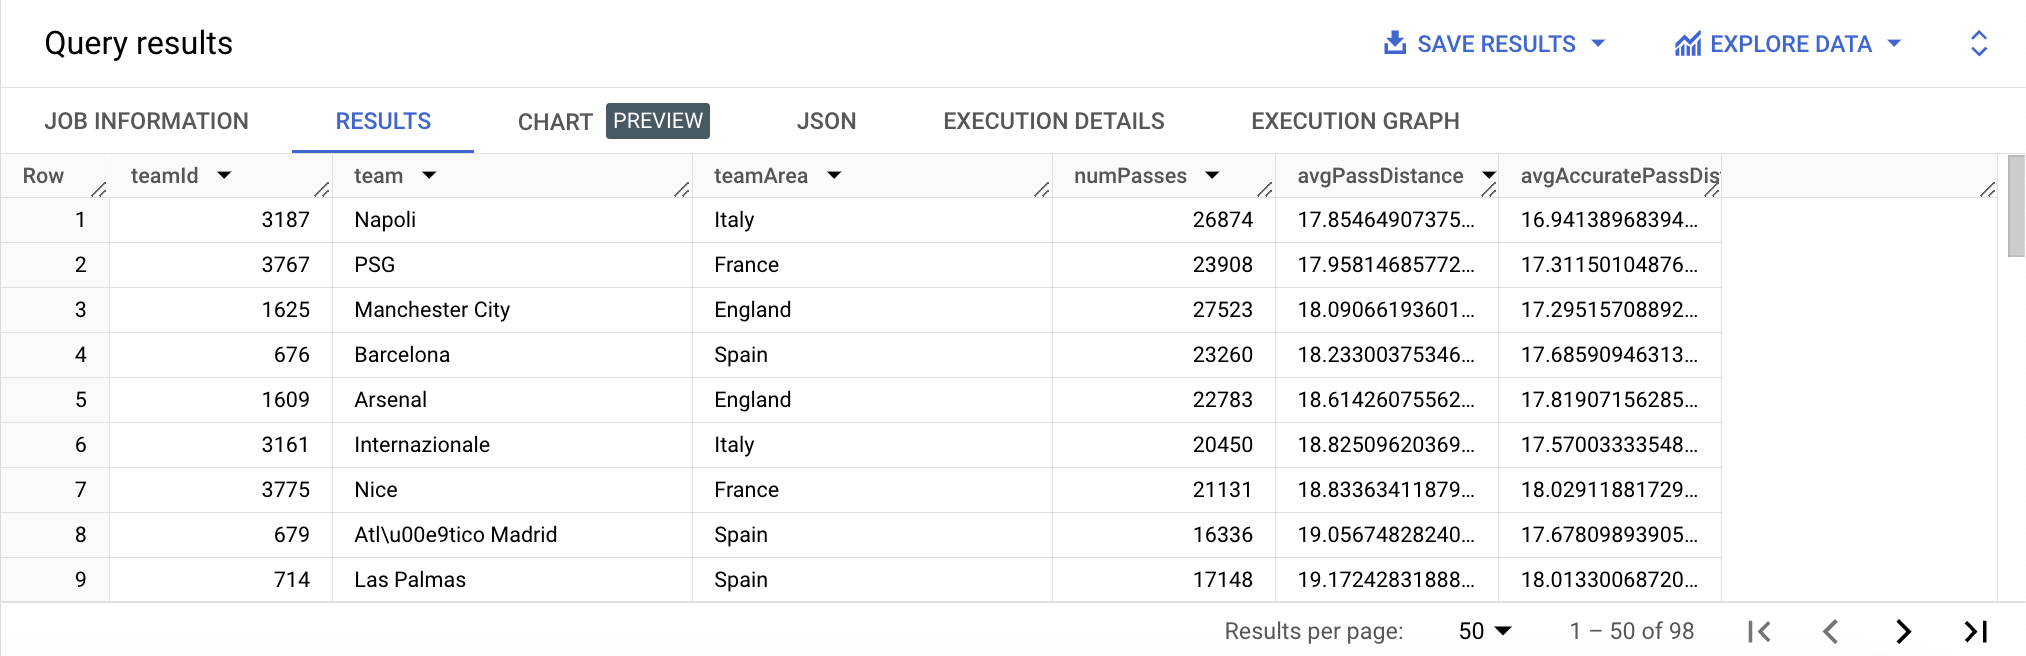
The code in the initial WITH clause filters the events table to passes only and adds an accuratePass field by looking "inside" the tags field.
The pass distance is calculated by extracting the initial and final (x, y) coordinates using ORDINAL and applying the concepts and formula mentioned above. The final SELECT statement aggregates the passes data to the team level (filtering to only club teams), including average pass distance on all passes and accurate passes only.
Click Check my progress to verify the objective
In this section BigQuery was used to determine the number of passes and the average distance of passes by team. To achieve this, you used array processing capabilities to extract repeated values in a single field, then calculated the distance between the starting and ending point of each pass.
In the next section learn how to unnest other coordinate data to generate information about shot distances.
In this section, you will create a new query to analyze shot distance.
What impact does the distance of a shot have on the likelihood of a goal being scored?
To answer this question use a process similar to the previous section. For shots, use (x, y) values from the positions field in the events table.
The initial WITH clause filters the events table to shots only, adds an isGoal field by looking "inside" the tags field, and calculates shot distance the same way that pass distance was handled in the previous section, but uses the midpoint of the goal mouth (100, 50) as the ending location.
The final SELECT statement aggregates the number of shots, number of goals, and percentage of goals from shots by distance rounded to the nearest meter.
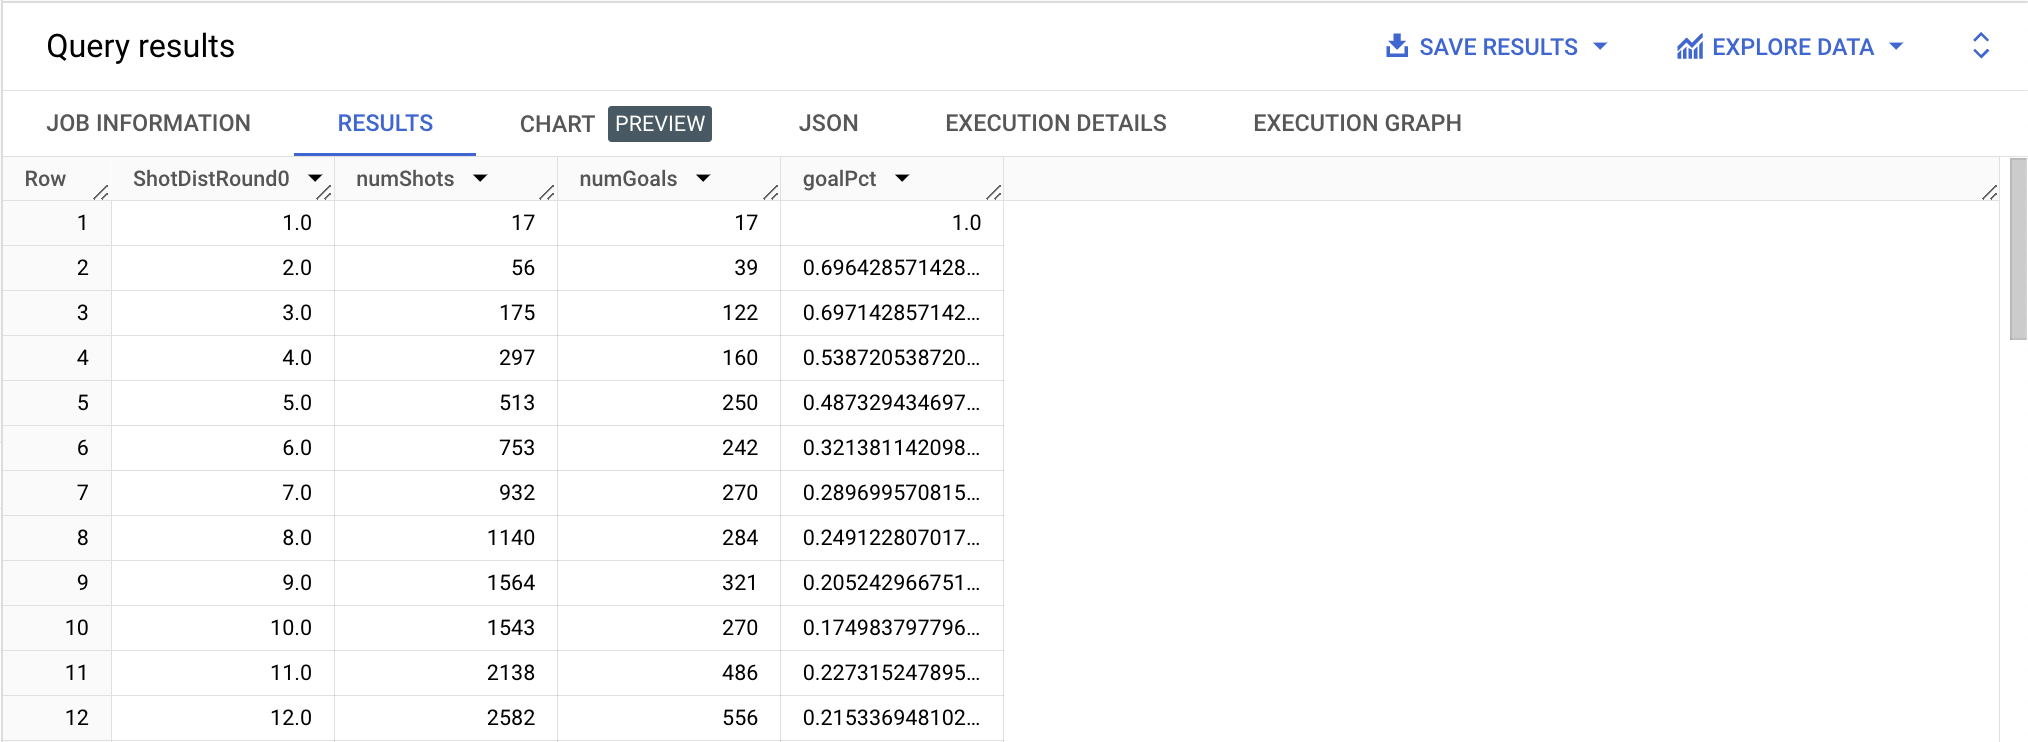
As expected, shots at close distance have much higher goal rates, going from near 70% success at 2-3 meters down to less than 25% at 8 meters, and declining steadily all the way to 25+ meters.
Visualizing the data can make it easier to understand and see trends.

There's a slight bump up in success rate at 11-12 meters, but that can likely be explained by the fact that penalty kicks (which are, by design, much higher propositions than most other shots) account for a large percentage of shots from that range.
Click Check my progress to verify the objective
In this section BigQuery was used to establish a view on shot distance versus goal success rate. From this analysis there is a better understanding of the likelihood of a goal being scored based on the distance of the shot.
In the next section you will perform a similar analysis to look at the impact of shot angle on shot success.
In this section, modify the previous query to look at the impact of the angles on shots.
In this case, the angle calculated is the one made by the location of the shot and the goal line, as shown below (image credit to Ian Dragulet).
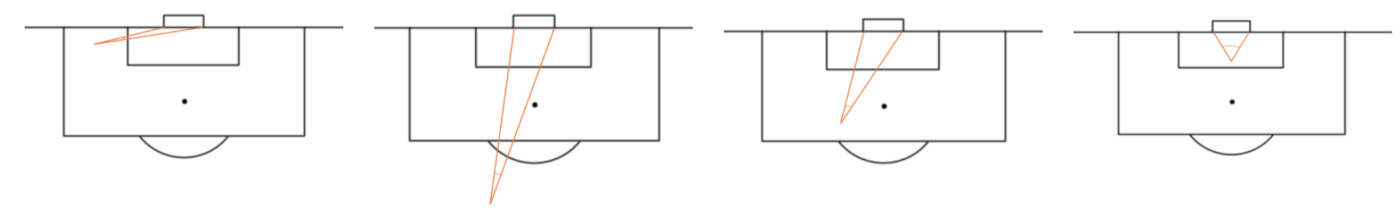
Larger angles arise from being close to the goal and in the center, so this is somewhat correlated with the distance calculation performed above. The shot angle calculations involve using BigQuery's trigonometric functions on the (x, y) data.
This query is similar to the shot distance one above except for an initial WITH clause to extract the shot coordinates (to simplify when needing them multiple times in the angle calculation) and a more detailed trigonometric calculation using the Law of Cosines to get shot angle in the second WITH clause.
The final SELECT statement aggregates by shot angle rounded to the nearest degree.
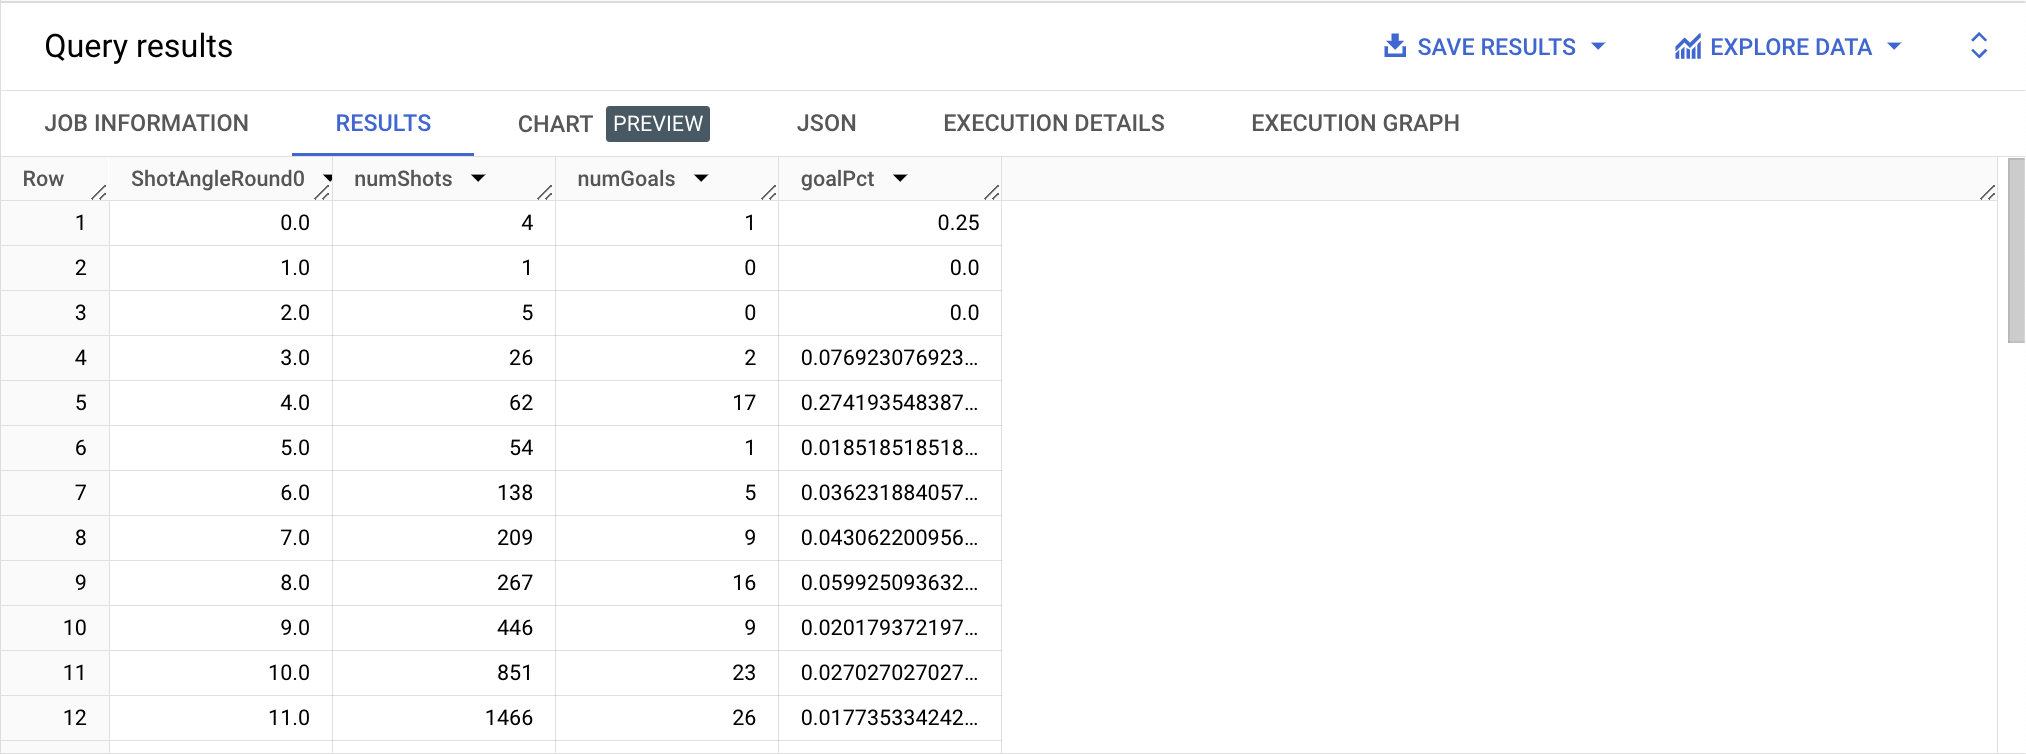
Shot angle seems to be generally positively correlated with goal success rate, going from single-digit success rate at angles below 20° to much higher rates at wider angles (with relatively lower sample sizes beyond 60° or so).
By clicking on the Charts in the Query results section, selecting Scatter for the chart types, and then you can visualize the full trend like you see below.

The plot shows that the relationship between shot angle and success rate is relatively linear up to about 100°. Again, the widest angles are only possible on shots close to the goal, so some of this is correlated with the distance effect shown above. There is some slight bumping up in success rate at 35° and 38°, as these are the most common shot angles for penalty kicks (again, much higher propositions than most other shots) and account for a large percentage of shots from that range.
Click Check my progress to verify the objective
In the next section test your understanding of what you have learned in this lab.
Test your understanding of BigQuery by completing the short quiz on the topics covered in this lab.
You're on your way to understanding sports data science! You have successfully used BigQuery to analyze average pass distance, as well as the relationship shot distance and shot angle have with success. The queries used correlated cross joins and BigQuery's array and trigonometric functions to look inside nested data and perform the distance and angle calculations necessary to analyze the data as requested.
...helps you make the most of Google Cloud technologies. Our classes include technical skills and best practices to help you get up to speed quickly and continue your learning journey. We offer fundamental to advanced level training, with on-demand, live, and virtual options to suit your busy schedule. Certifications help you validate and prove your skill and expertise in Google Cloud technologies.
Manual Last Updated January 25, 2024
Lab Last Tested January 25, 2024
Copyright 2025 Google LLC All rights reserved. Google and the Google logo are trademarks of Google LLC. All other company and product names may be trademarks of the respective companies with which they are associated.


This content is not currently available
We will notify you via email when it becomes available

Great!
We will contact you via email if it becomes available

One lab at a time
Confirm to end all existing labs and start this one