

准备工作
- 实验会创建一个 Google Cloud 项目和一些资源,供您使用限定的一段时间
- 实验有时间限制,并且没有暂停功能。如果您中途结束实验,则必须重新开始。
- 在屏幕左上角,点击开始实验即可开始
View sample report data
/ 100
In this lab, you will visualize the Google Cloud Cortex Data Foundation for SAP by viewing reports pre-installed into a Looker instance available with this lab.
If you are unfamiliar with the Google Cloud Cortex Data Foundation for SAP you can find out more information about it at the link provided.
This scenario intends to convey how a business analyst would consume reports to have a better idea of how to run the business and make informed decisions with SAP ERP data, all within Looker’s snappy, intuitive interface.
The Google Cloud Cortex Data Foundation for SAP provides Looker Blocks to monitor sales performance and order fulfillment, hone in on customers, orders and products to dig into anomalies or answer new questions. You can find the git repository to install the SAP Cortex Looker Block in your own Looker environment at the link provided.
A connection to the BigQuery instance has been pre-created to support this lab environment.
In this section, you will review the properties of the Looker Block which require configuration in order to pull data from BigQuery. If you are unfamiliar with Looker Blocks you can read more about them at the documentation site here.
Select the Open Looker button on the student console of the lab and enter the credentials provided to login to the Looker instance available.
Once logged in, enable Development Mode by selecting the toggle button in the bottom left corner of the landing page.
In the left navigation menu select Develop > cortex_data_foundation.
In the resulting page you will see an editor view of the Looker Block pre-installed into the Looker instance. This will look very similar to the SAP Cortex Looker Block available on GitHub with minor configuration changes.
Notice that a README.md provides instructions on what configurations can be made on this block and how to make them. Open the file manifest.lkml.
Observe the constants CONNECTION_NAME and DATASET defined in the file. These configurations instruct the Looker instance what connection to utilize to pull data warehousing data from (in this case a BigQuery instance) and what dataset that the block should use in the data warehouse instance connection once established.
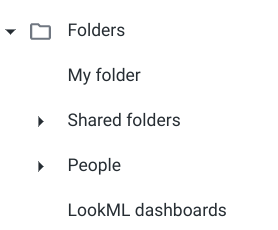
Navigate back to the Home page of the Looker instance:
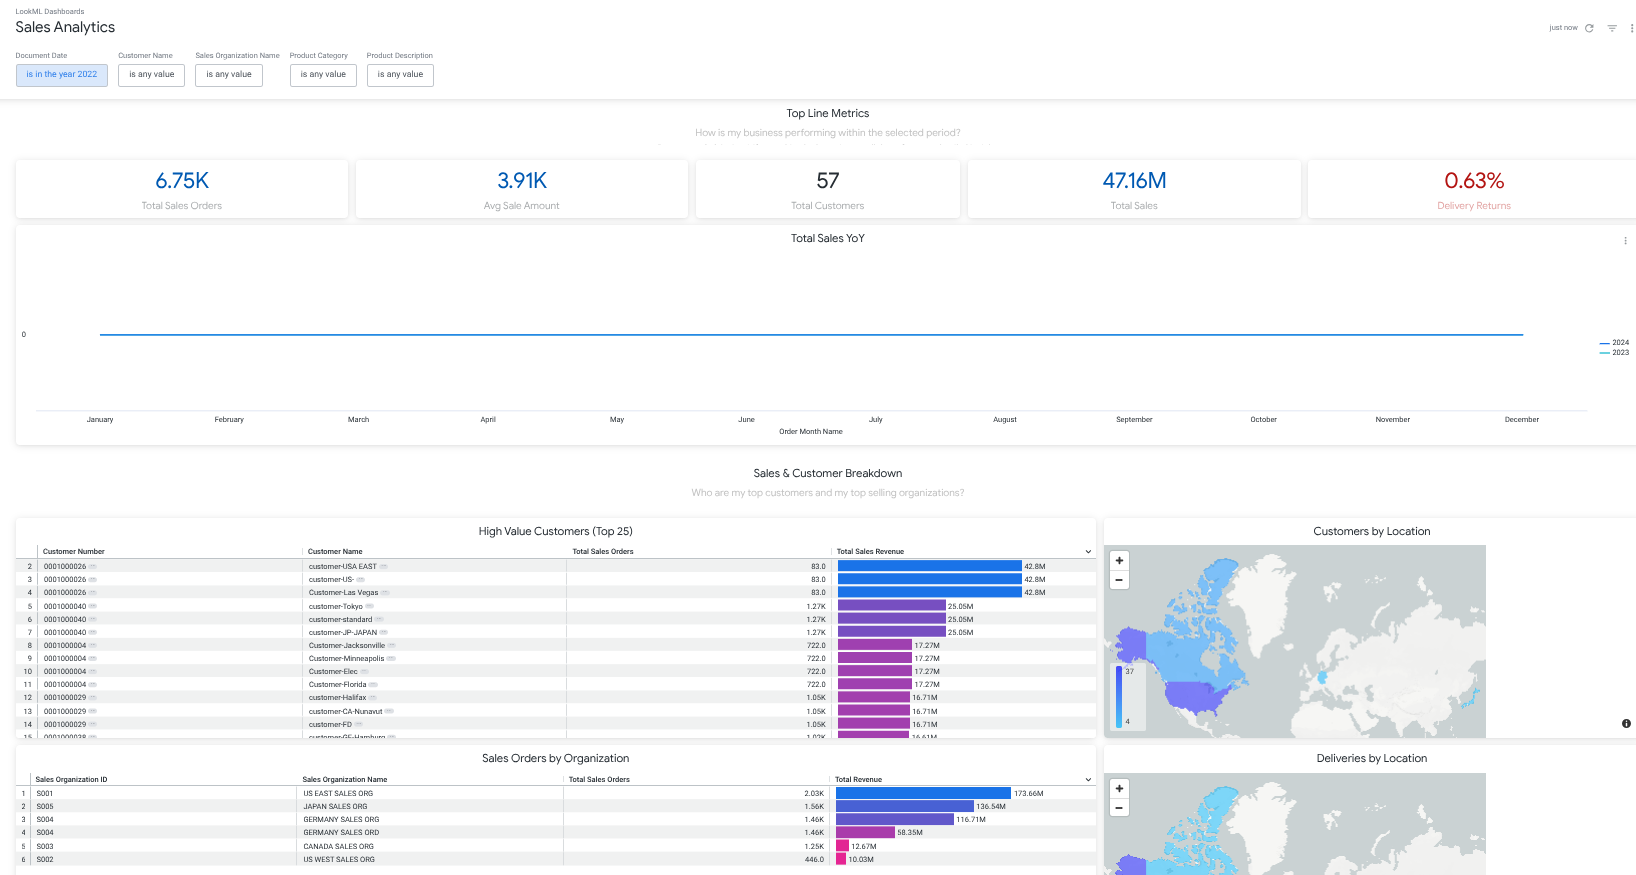
In the resulting page, select the Sales Analytics report.
Update the Document Date to is in the year 2022 by clicking in the filter box to select the option and fill in the year, and then click Update.
The resulting report contains Sales Analytics data which an analyst can use to compare year over year product sales and order fulfillment.
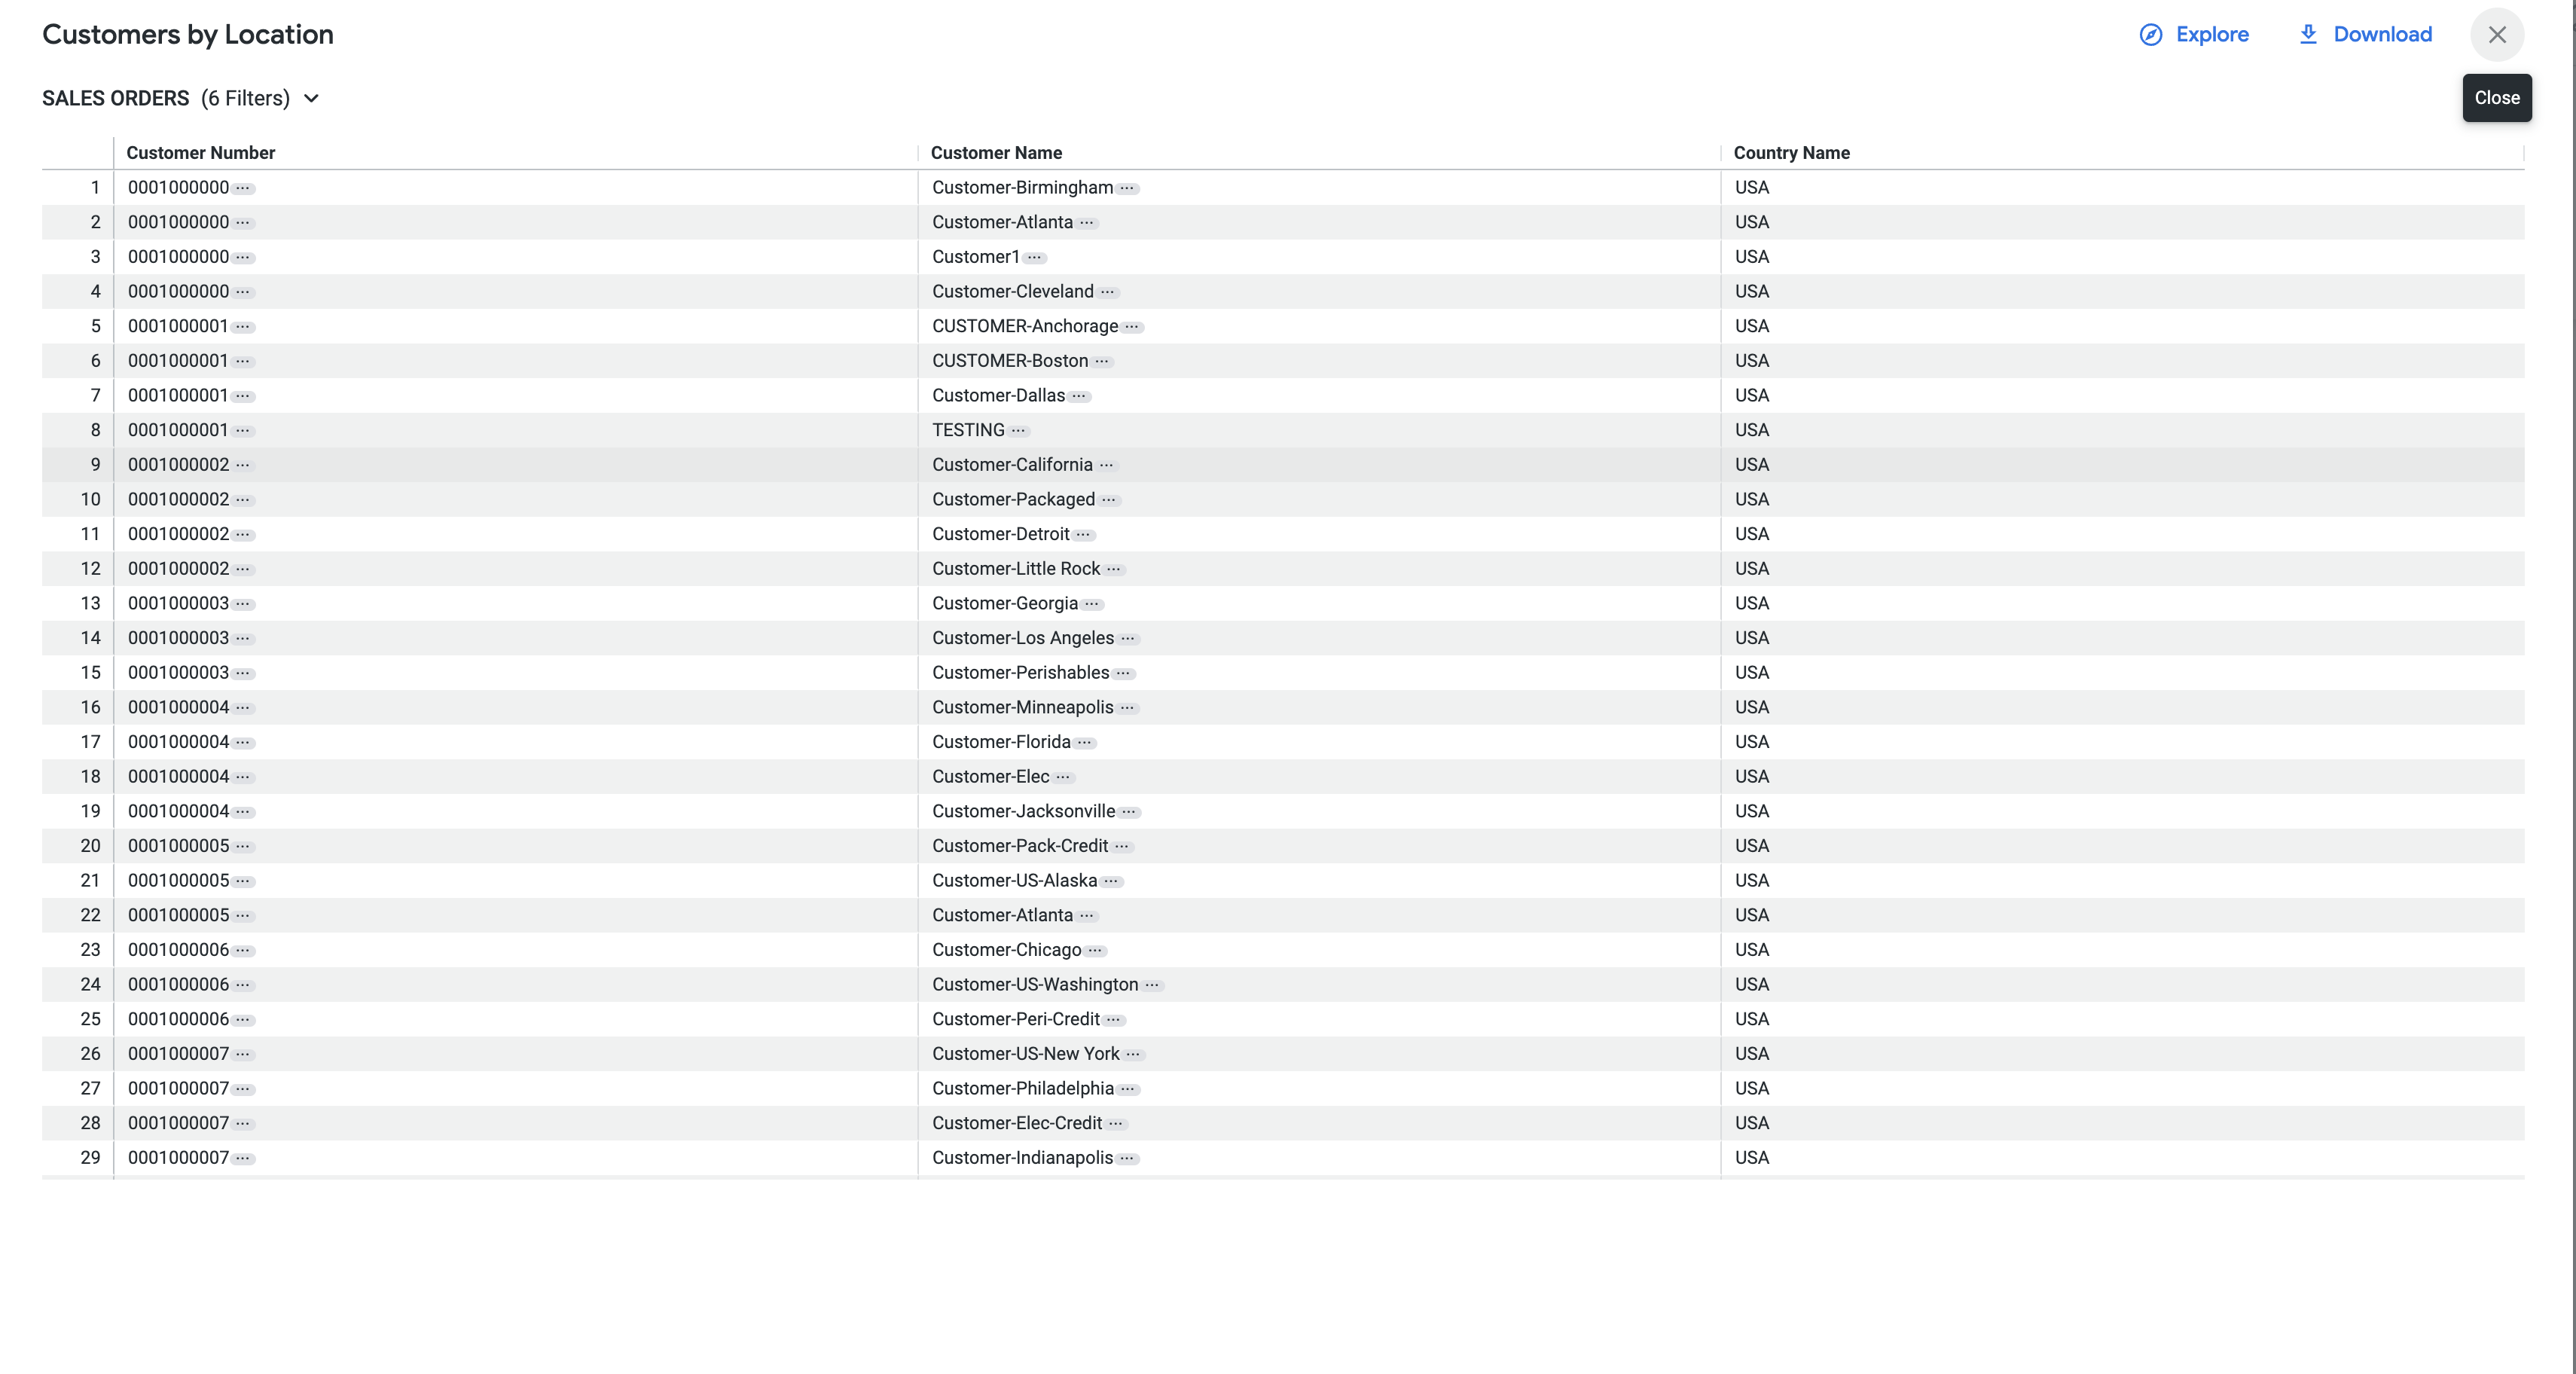
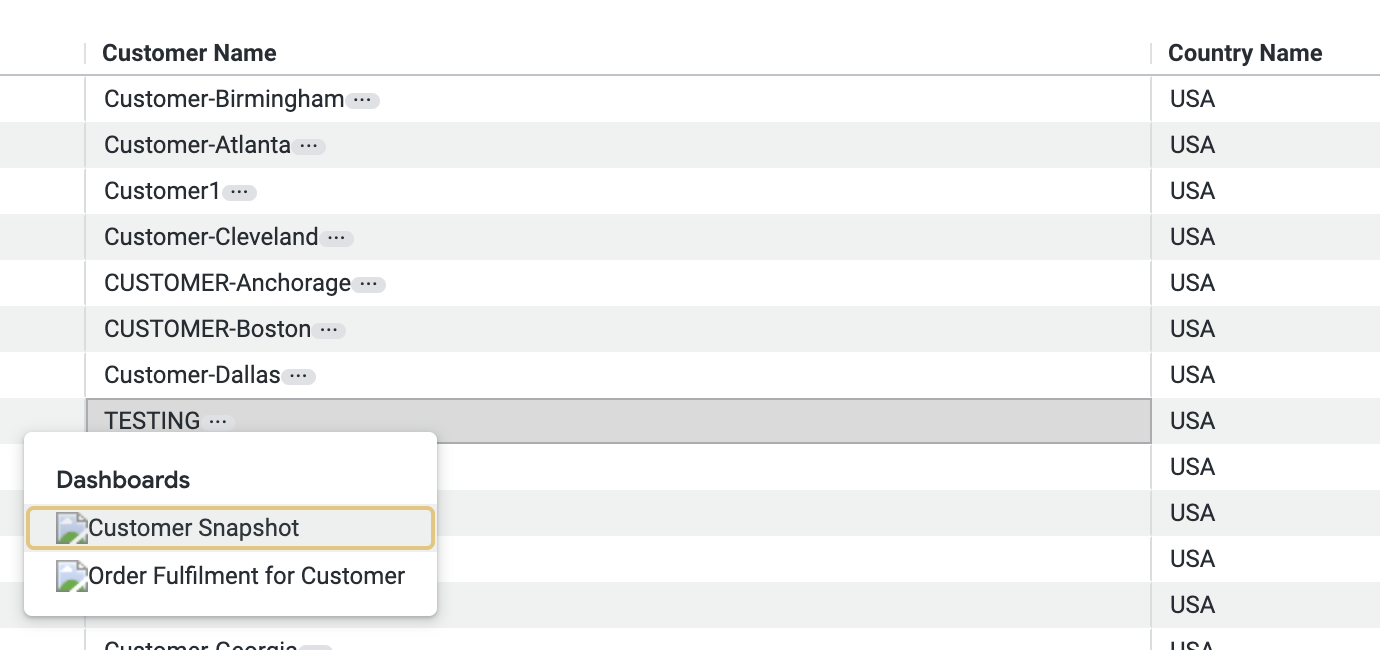
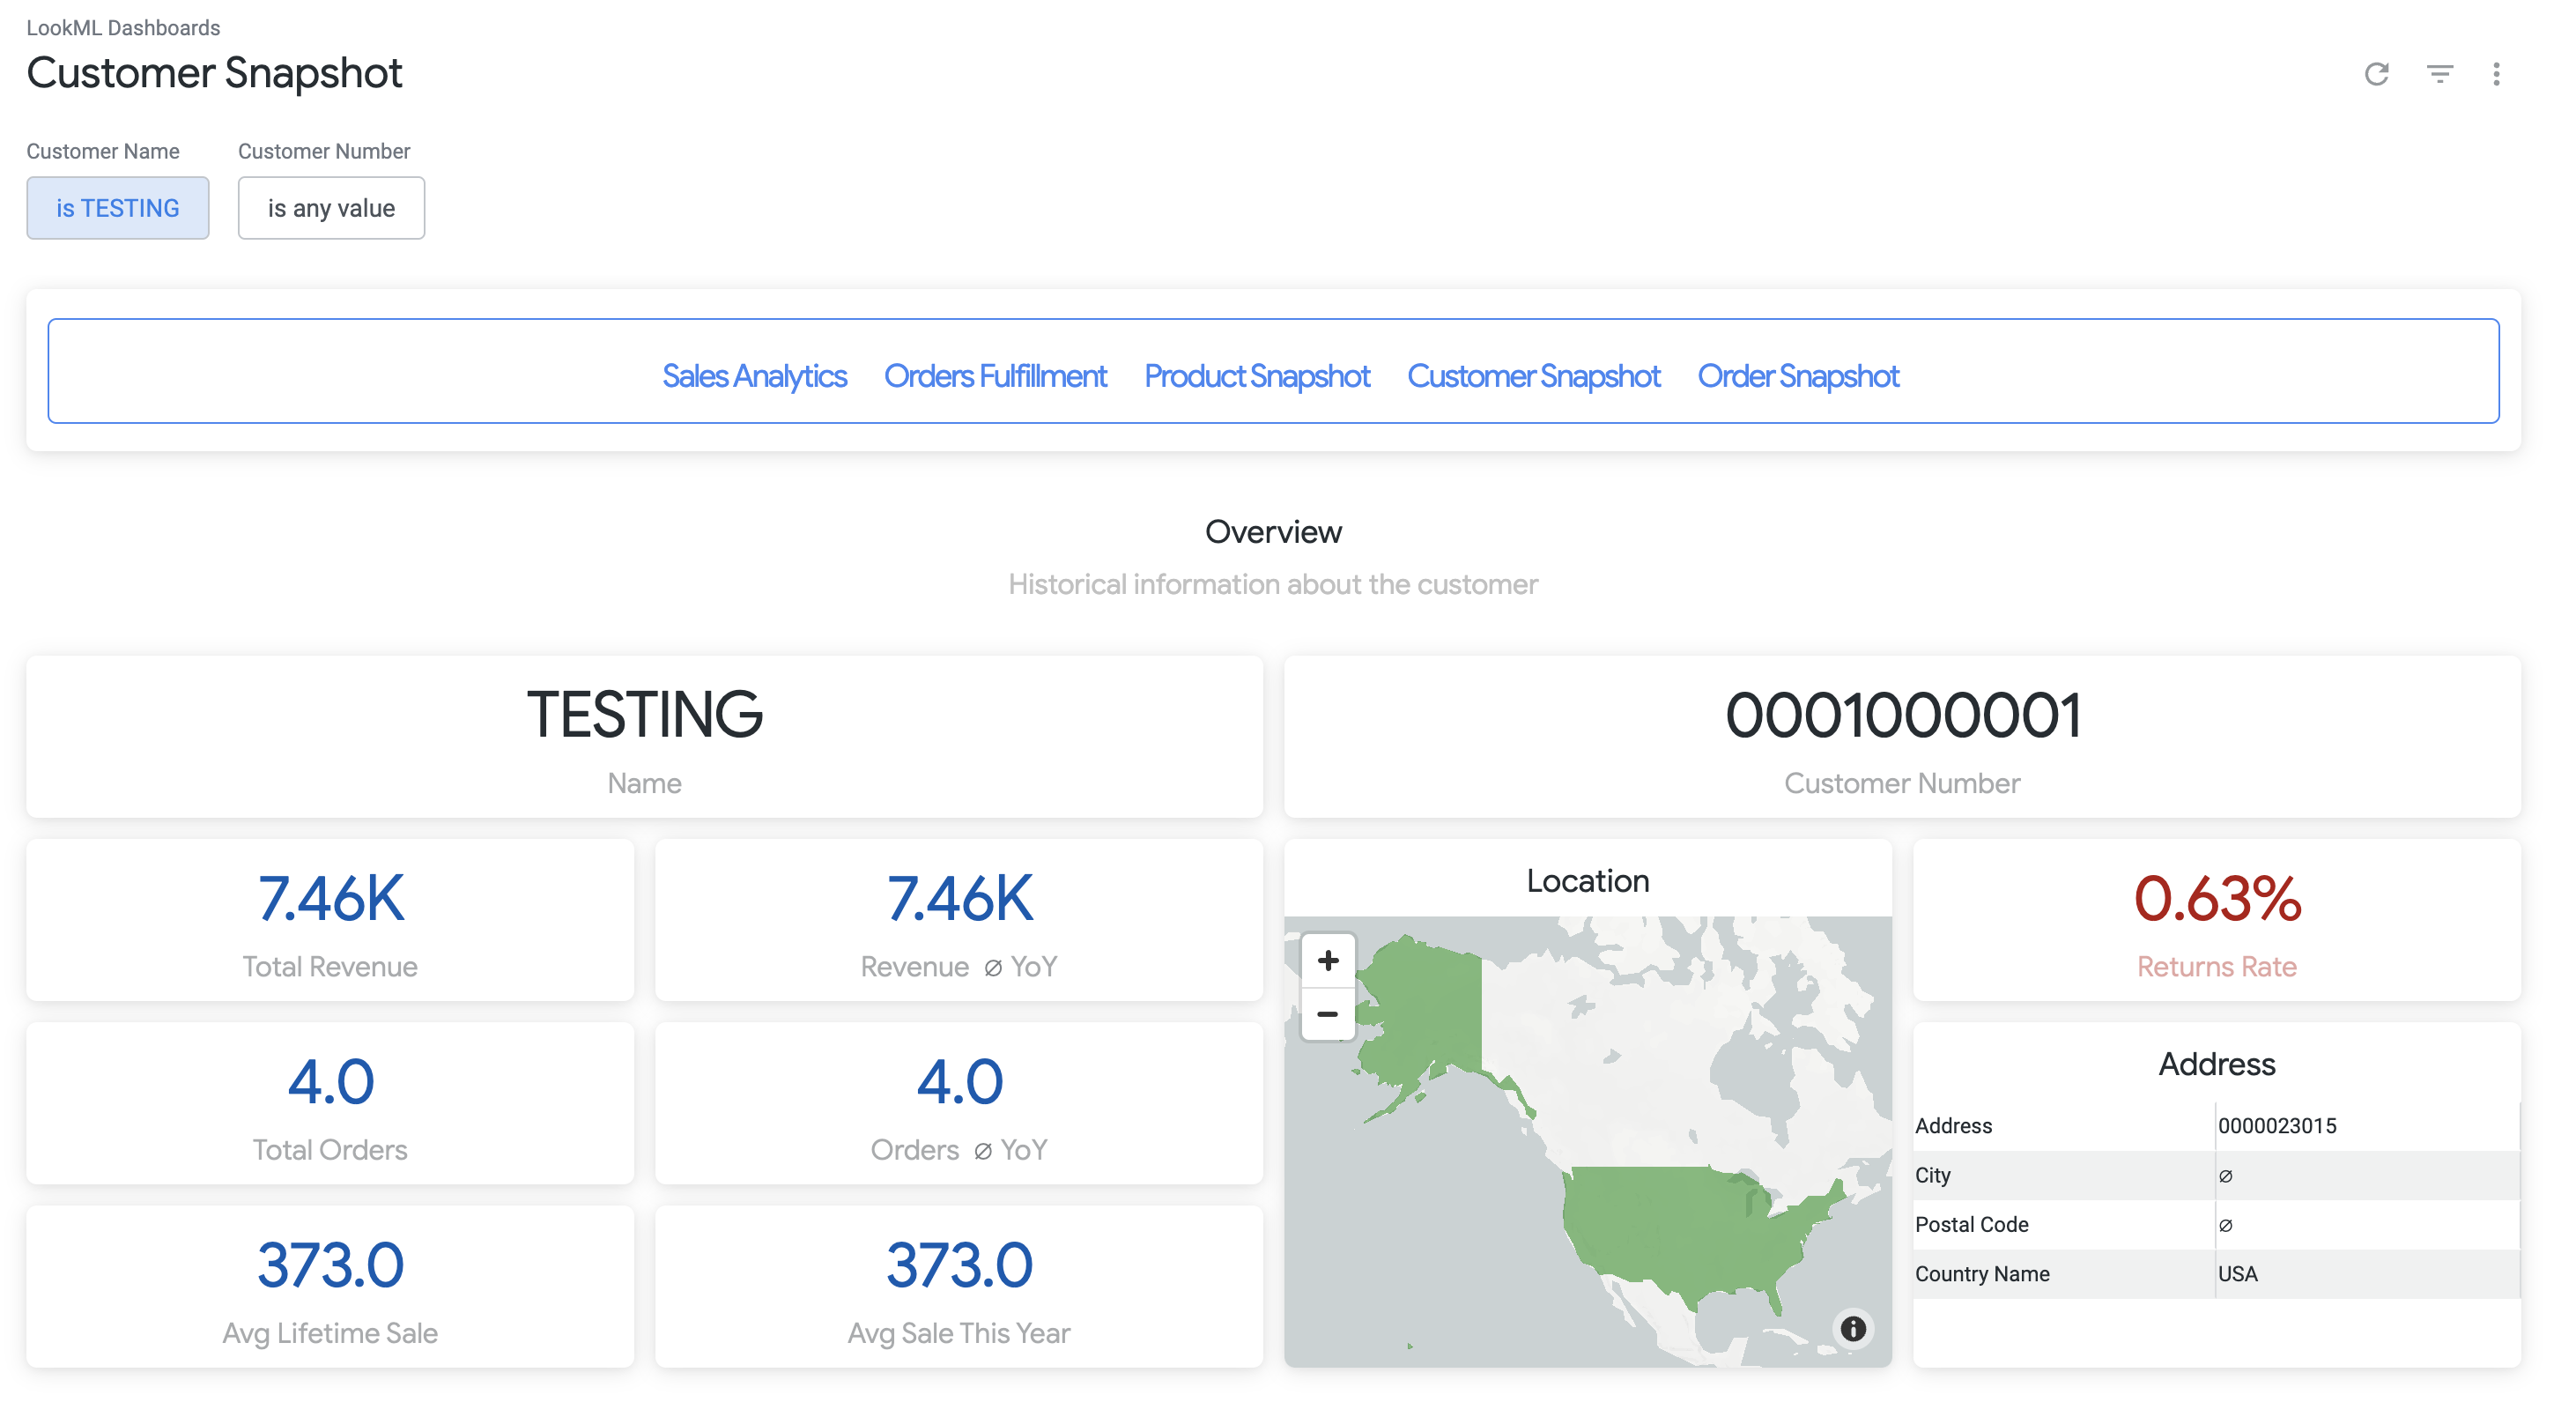
TESTING.As a business analyst, you can leverage the out of the box reports provided by the SAP Cortex Looker Block to understand more about the state of the business and specific customers and products. Learn more about how to deploy the underlying data at the Cortex Data Foundation GitHub Repository.
Click Check my progress to verify the objective.
In this lab, you learned how to leverage the Data Foundation for Google Cloud Cortex Framework to gain business insight into how your business is operating.
Check out the following for more information on Google Cloud Cortex Framework:
...helps you make the most of Google Cloud technologies. Our classes include technical skills and best practices to help you get up to speed quickly and continue your learning journey. We offer fundamental to advanced level training, with on-demand, live, and virtual options to suit your busy schedule. Certifications help you validate and prove your skill and expertise in Google Cloud technologies.
Manual Last Updated July 28, 2025
Lab Last Tested July 26, 2025
Copyright 2025 Google LLC. All rights reserved. Google and the Google logo are trademarks of Google LLC. All other company and product names may be trademarks of the respective companies with which they are associated.


此内容目前不可用
一旦可用,我们会通过电子邮件告知您

太好了!
一旦可用,我们会通过电子邮件告知您

一次一个实验
确认结束所有现有实验并开始此实验