

Before you begin
- Labs create a Google Cloud project and resources for a fixed time
- Labs have a time limit and no pause feature. If you end the lab, you'll have to restart from the beginning.
- On the top left of your screen, click Start lab to begin
Deploy application
/ 50
Create a Log bucket
/ 25
create the log sink
/ 25
Cloud Logging is a fully managed service that allows you to store, search, analyze, monitor, and alert on logging data and events from Google Cloud. In this lab you learn about the features and tools provided by Cloud Logging to gain insight into your applications.
In this lab you learn how to:
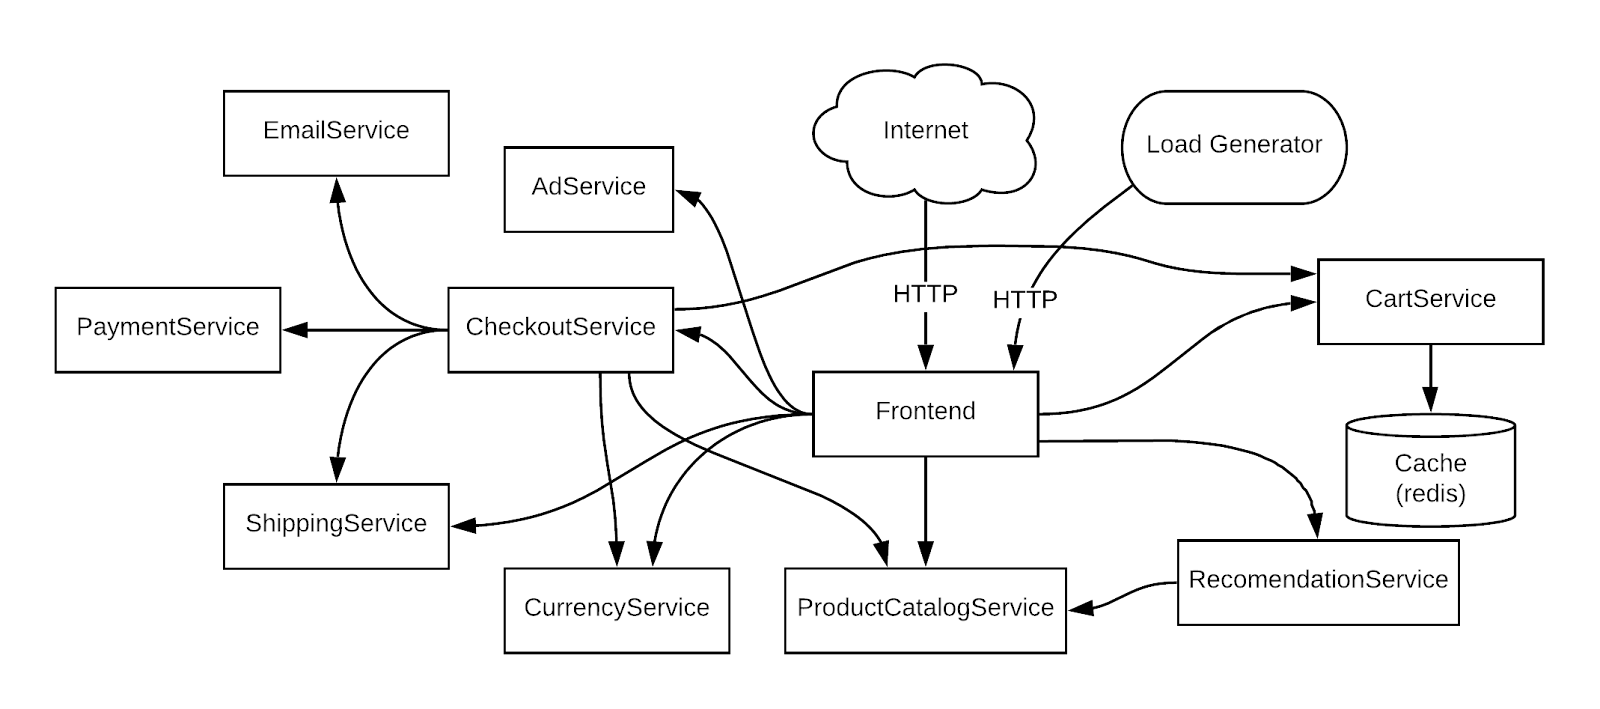
In this lab, you work through a scenario based on this microservices demo app deployed to a GKE cluster. This demo app has many microservices and dependencies embedded in it.
Read these instructions. Labs are timed and you cannot pause them. The timer, which starts when you click Start Lab, shows how long Google Cloud resources are made available to you.
This hands-on lab lets you do the lab activities in a real cloud environment, not in a simulation or demo environment. It does so by giving you new, temporary credentials you use to sign in and access Google Cloud for the duration of the lab.
To complete this lab, you need:
Click the Start Lab button. If you need to pay for the lab, a dialog opens for you to select your payment method. On the left is the Lab Details pane with the following:
Click Open Google Cloud console (or right-click and select Open Link in Incognito Window if you are running the Chrome browser).
The lab spins up resources, and then opens another tab that shows the Sign in page.
Tip: Arrange the tabs in separate windows, side-by-side.
If necessary, copy the Username below and paste it into the Sign in dialog.
You can also find the Username in the Lab Details pane.
Click Next.
Copy the Password below and paste it into the Welcome dialog.
You can also find the Password in the Lab Details pane.
Click Next.
Click through the subsequent pages:
After a few moments, the Google Cloud console opens in this tab.

Cloud Shell is a virtual machine that is loaded with development tools. It offers a persistent 5GB home directory and runs on the Google Cloud. Cloud Shell provides command-line access to your Google Cloud resources.
Click Activate Cloud Shell 
Click through the following windows:
When you are connected, you are already authenticated, and the project is set to your Project_ID,
gcloud is the command-line tool for Google Cloud. It comes pre-installed on Cloud Shell and supports tab-completion.
Output:
Output:
gcloud, in Google Cloud, refer to the gcloud CLI overview guide.
Connect to a GKE cluster and validate that it's been created correctly.
gcloud:You should see a similar status:
The cluster status should say RUNNING. If it's still PROVISIONING, wait a moment and run the command above again. Repeat until the status is RUNNING.
You can also check the progress in the Google Cloud console. In the Navigation menu (
Your output should look like this:
Your output should look like this:
Next, you deploy a microservices application called Online Boutique to your cluster to create an actual workload you can monitor.
microservices-demo directory:kubectl:The output should look similar to the output below. Re-run the command until all pods are reporting a Running status before moving to the next step.
An IP address is returned only after the service has been deployed. You may need to repeat the commands until there's an external IP address assigned.
When the IP address is assigned, your output should be similar to this:
Your confirmation looks like this:
After the application is deployed, you can also view the status in the console.
On the Kubernetes Engine page, in the left pane, click Workloads to see that all the pods are OK.
In the left pane, click Gateways, Services & Ingress and then verify that all services are OK.
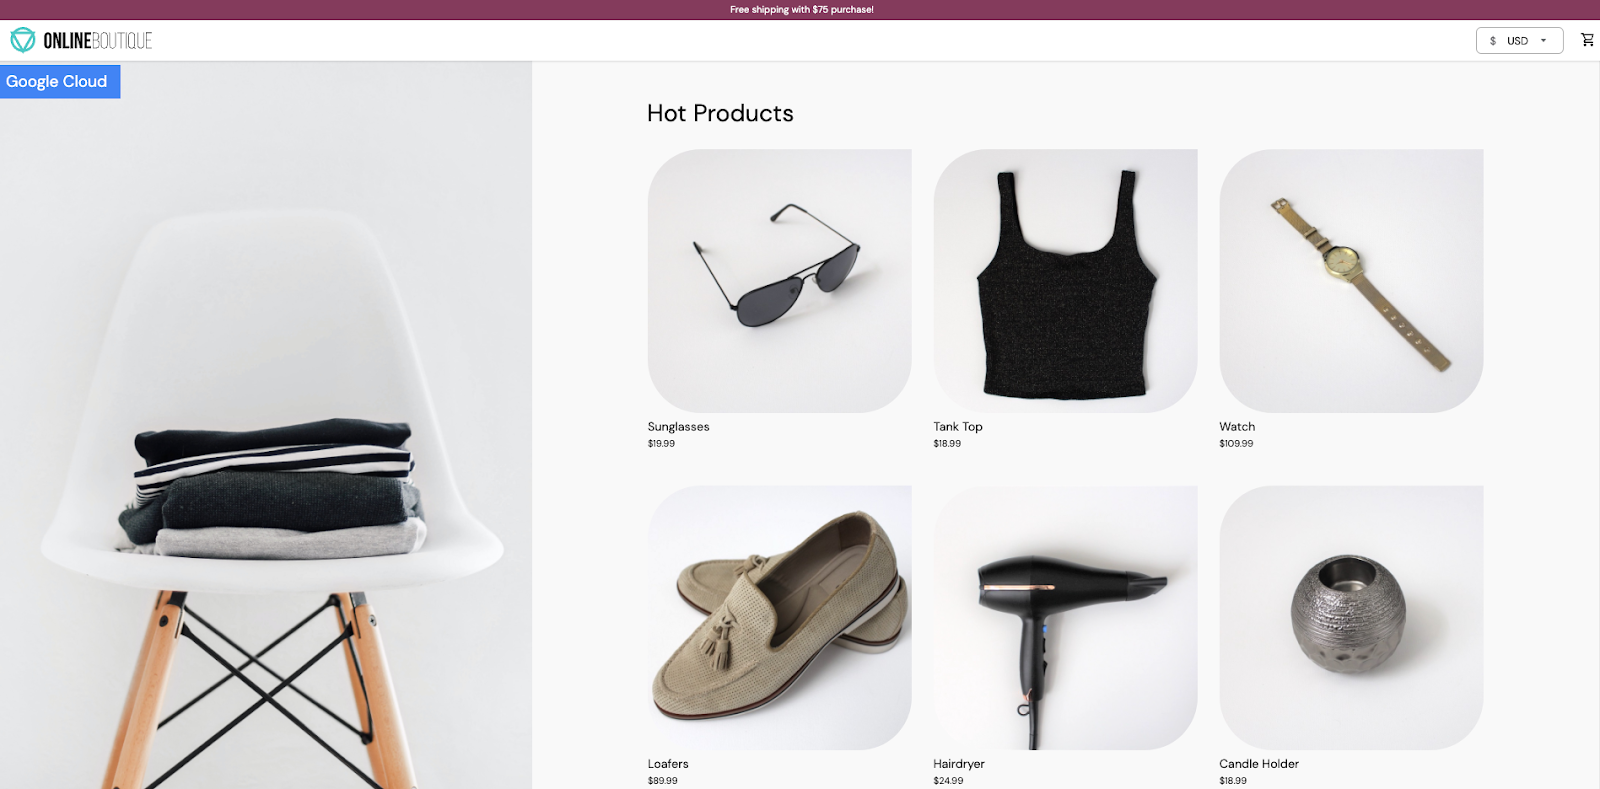
Under Gateways, Services & Ingress, click the Endpoint IP of the service frontend-external.
It should open a demo web page similar to the following:
Click Check my progress to verify the objective.
There are two ways to enable Log Analytics. One way is to upgrade an existing bucket. The other is to create a new log bucket with Log Analytics enabled.
You can use the following steps to upgrade an existing log bucket.
In the console, in the Navigation menu (
Click UPGRADE for an existing bucket, for example, the Default bucket.
Click UPGRADE in the confirmation dialog.
Wait for the upgrade to complete.
Initially the status changes to Not eligible for upgrade before you see the Upgraded status.
_AllLogs.The Log Analytics page opens.
Alternatively, you can configure Cloud Logging to create a new log bucket with Log Analytics enabled.
On the console title bar, type logging in the Search field, and then Logging in the search results.
In the left pane, click Logs storage and then click CREATE LOG BUCKET at the top of the Logs Storage window.
Provide a name, such as day2ops-log to the bucket.
Check both Upgrade to use Log Analytics and Create a new BigQuery dataset that links to this bucket.
Type in a dataset name, such as: day2ops_log
Selecting Create a linked dataset in BigQuery creates a dataset for you in BigQuery if it does not exist. This lets you run queries in BigQuery.
Click Check my progress to verify the objective.
There are a couple ways to create a log sink to route log entries to the new log bucket:
Still in the Logging page, click Logs Explorer in the left pane.
In the top-right, enable Show query and run the following query in the query field:
Above the Log list, click Actions > Create sink.
Provide a name such as day2ops-sink as the sink name.
Click NEXT.
Select Logging bucket in the sink service dropdown list.
Select the new log bucket you just created.
Click NEXT.
You should see the resource type query already in the filter.
Wait about a minute and your sink should be created.
Click Check my progress to verify the objective.
Go back to the Logs Explorer (in the left pane, click Logs explorer). Notice in the Log fields list, in the Resource Type section, that there are many different resource types for the logs.
To view the logs in the new log bucket, at the top left of the Logs Explorer window, click Project logs > Log view > the new log bucket (that you just created).
Click APPLY.
You see that Kubernetes Containers is now the only resource type and there are fewer log entries. That's because only filtered logs are sent to the bucket.
If your query field is empty or you forget which table to use, click the Query button to get the sample query back.
You can run your own queries in the query field. This task provides some examples.
FROM clause is different for the log buckets. Be sure you use the correct view name. You can use the previous step to verify.
Use this query to find the most recent errors for from the containers:
Use this query to find the min, max, and average latencies in a timeframe for the frontend service:
Use this query to find how many times users visit a certain product page in the past hour:
Use this query to find how many sessions end up with checkout (POST call to the /cart/checkout service):
You now have experience using Cloud Logging to get insight about applications running on GKE, and you built and ran queries using log analytics.
...helps you make the most of Google Cloud technologies. Our classes include technical skills and best practices to help you get up to speed quickly and continue your learning journey. We offer fundamental to advanced level training, with on-demand, live, and virtual options to suit your busy schedule. Certifications help you validate and prove your skill and expertise in Google Cloud technologies.
Manual Last Updated March 21, 2025
Lab Last Tested February 20, 2025
Copyright 2025 Google LLC. All rights reserved. Google and the Google logo are trademarks of Google LLC. All other company and product names may be trademarks of the respective companies with which they are associated.


This content is not currently available
We will notify you via email when it becomes available

Great!
We will contact you via email if it becomes available

One lab at a time
Confirm to end all existing labs and start this one