

Before you begin
- Labs create a Google Cloud project and resources for a fixed time
- Labs have a time limit and no pause feature. If you end the lab, you'll have to restart from the beginning.
- On the top left of your screen, click Start lab to begin
Create a new dataset
/ 25
Identify a key field in your ecommerce dataset
/ 25
Pitfall: non-unique key
/ 25
Join pitfall solution
/ 25
BigQuery is Google's fully managed, NoOps, low cost analytics database. With BigQuery you can query terabytes and terabytes of data without having any infrastructure to manage or needing a database administrator. BigQuery uses SQL and can take advantage of the pay-as-you-go model. BigQuery allows you to focus on analyzing data to find meaningful insights.
Joining data tables can provide meaningful insight into your dataset. However, when you join your data there are common pitfalls that could corrupt your results. This lab focuses on avoiding those pitfalls. Types of joins:
For more information about joins, refer to the Join Page.
The dataset you'll use is an ecommerce dataset that has millions of Google Analytics records for the Google Merchandise Store loaded into BigQuery. You have a copy of that dataset for this lab and will explore the available fields and row for insights.
For syntax information to help you follow and update the queries, see Standard SQL Query Syntax.
In this lab, you learn how to:
Read these instructions. Labs are timed and you cannot pause them. The timer, which starts when you click Start Lab, shows how long Google Cloud resources are made available to you.
This hands-on lab lets you do the lab activities in a real cloud environment, not in a simulation or demo environment. It does so by giving you new, temporary credentials you use to sign in and access Google Cloud for the duration of the lab.
To complete this lab, you need:
Click the Start Lab button. If you need to pay for the lab, a dialog opens for you to select your payment method. On the left is the Lab Details pane with the following:
Click Open Google Cloud console (or right-click and select Open Link in Incognito Window if you are running the Chrome browser).
The lab spins up resources, and then opens another tab that shows the Sign in page.
Tip: Arrange the tabs in separate windows, side-by-side.
If necessary, copy the Username below and paste it into the Sign in dialog.
You can also find the Username in the Lab Details pane.
Click Next.
Copy the Password below and paste it into the Welcome dialog.
You can also find the Password in the Lab Details pane.
Click Next.
Click through the subsequent pages:
After a few moments, the Google Cloud console opens in this tab.

The Welcome to BigQuery in the Cloud Console message box opens. This message box provides a link to the quickstart guide and the release notes.
The BigQuery console opens.
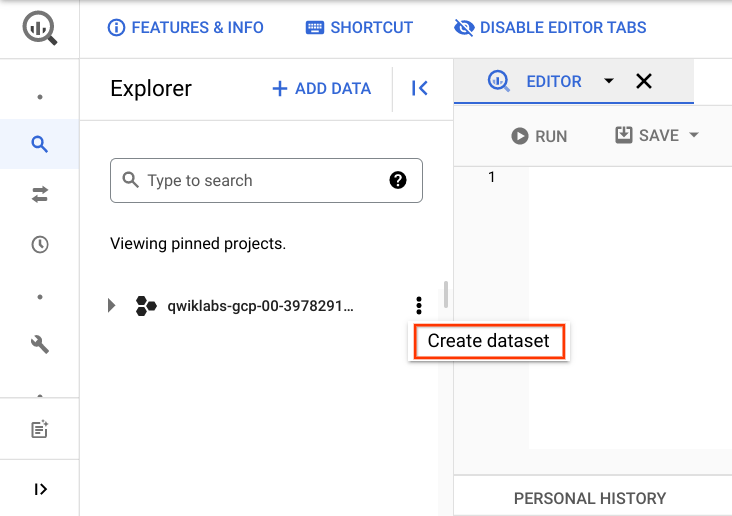
In your BigQuery project, create a new dataset titled ecommerce.
The Create dataset dialog opens.
Set the dataset ID to ecommerce.
Leave the other options at their default values, and click Create dataset.
In the left pane, you see an ecommerce table listed under your project.
Click Check my progress to verify the objective.
Scenario: Your team provides you with a new dataset on the inventory stock levels for each of your products for sale on your ecommerce website. You want to become familiar with the products on the website and the fields you could use to potentially join on to other datasets.
The project with the new dataset is data-to-insights.
 ) click BigQuery.
The Welcome to BigQuery in the Cloud Console message box opens.
Click Done.
BigQuery public datasets are not displayed by default. To open the public datasets project, copy data-to-insights (to paste in a dialog in the next step).
Click + Add data > Star a project by name then paste the data-to-insights name.
Click Star.
The data-to-insights project is listed in the Explorer section.
Next, get familiar with the products and fields on the website you can use to create queries to analyze the dataset.
In the left pane in the Resources section, navigate to data-to-insights > ecommerce > all_sessions_raw.
On the right, under the Query editor, click the Schema tab to see the Fields and information about each field.
Examine the products and fields further. You want to become familiar with the products on the website and the fields you could use to potentially join on to other datasets.
In this section you find how many product names and product SKUs are on your website and whether either one of those fields is unique.
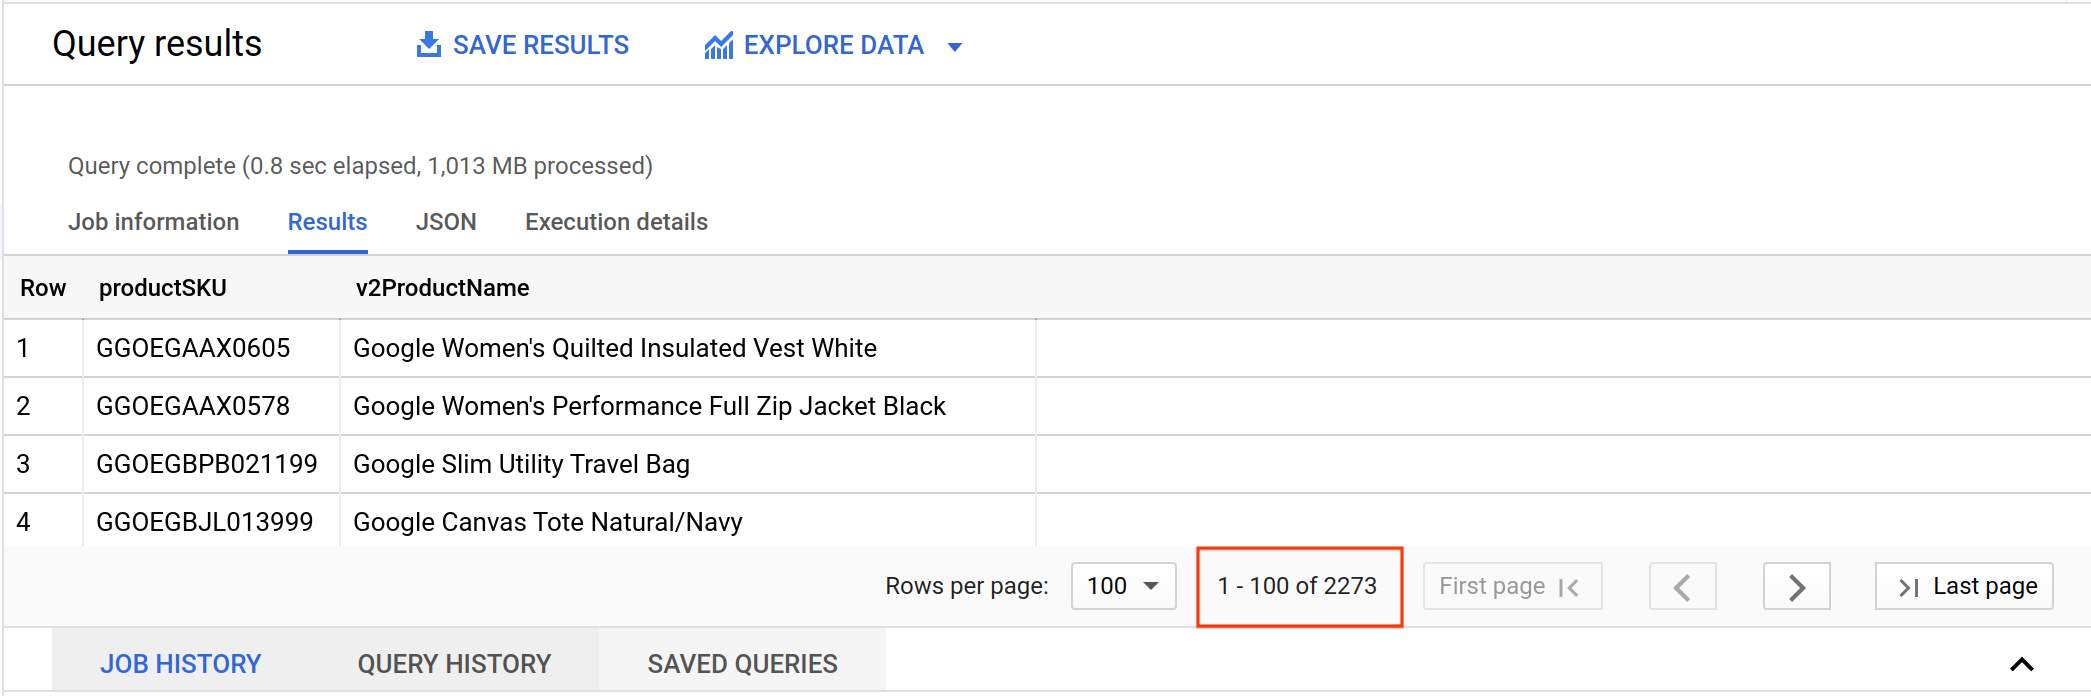
Look at the pagination results in the console for the total number of records returned.
But...do the results mean that there are that many unique product SKUs? One of the first queries you will run as a data analyst is looking at the uniqueness of your data values.
DISTINCT:Now determine which products have more than one SKU and which SKUs have more than one Product Name.
Results:
The ecommerce website catalog shows that each product name may have multiple options (size, color) -- which are sold as separate SKUs.
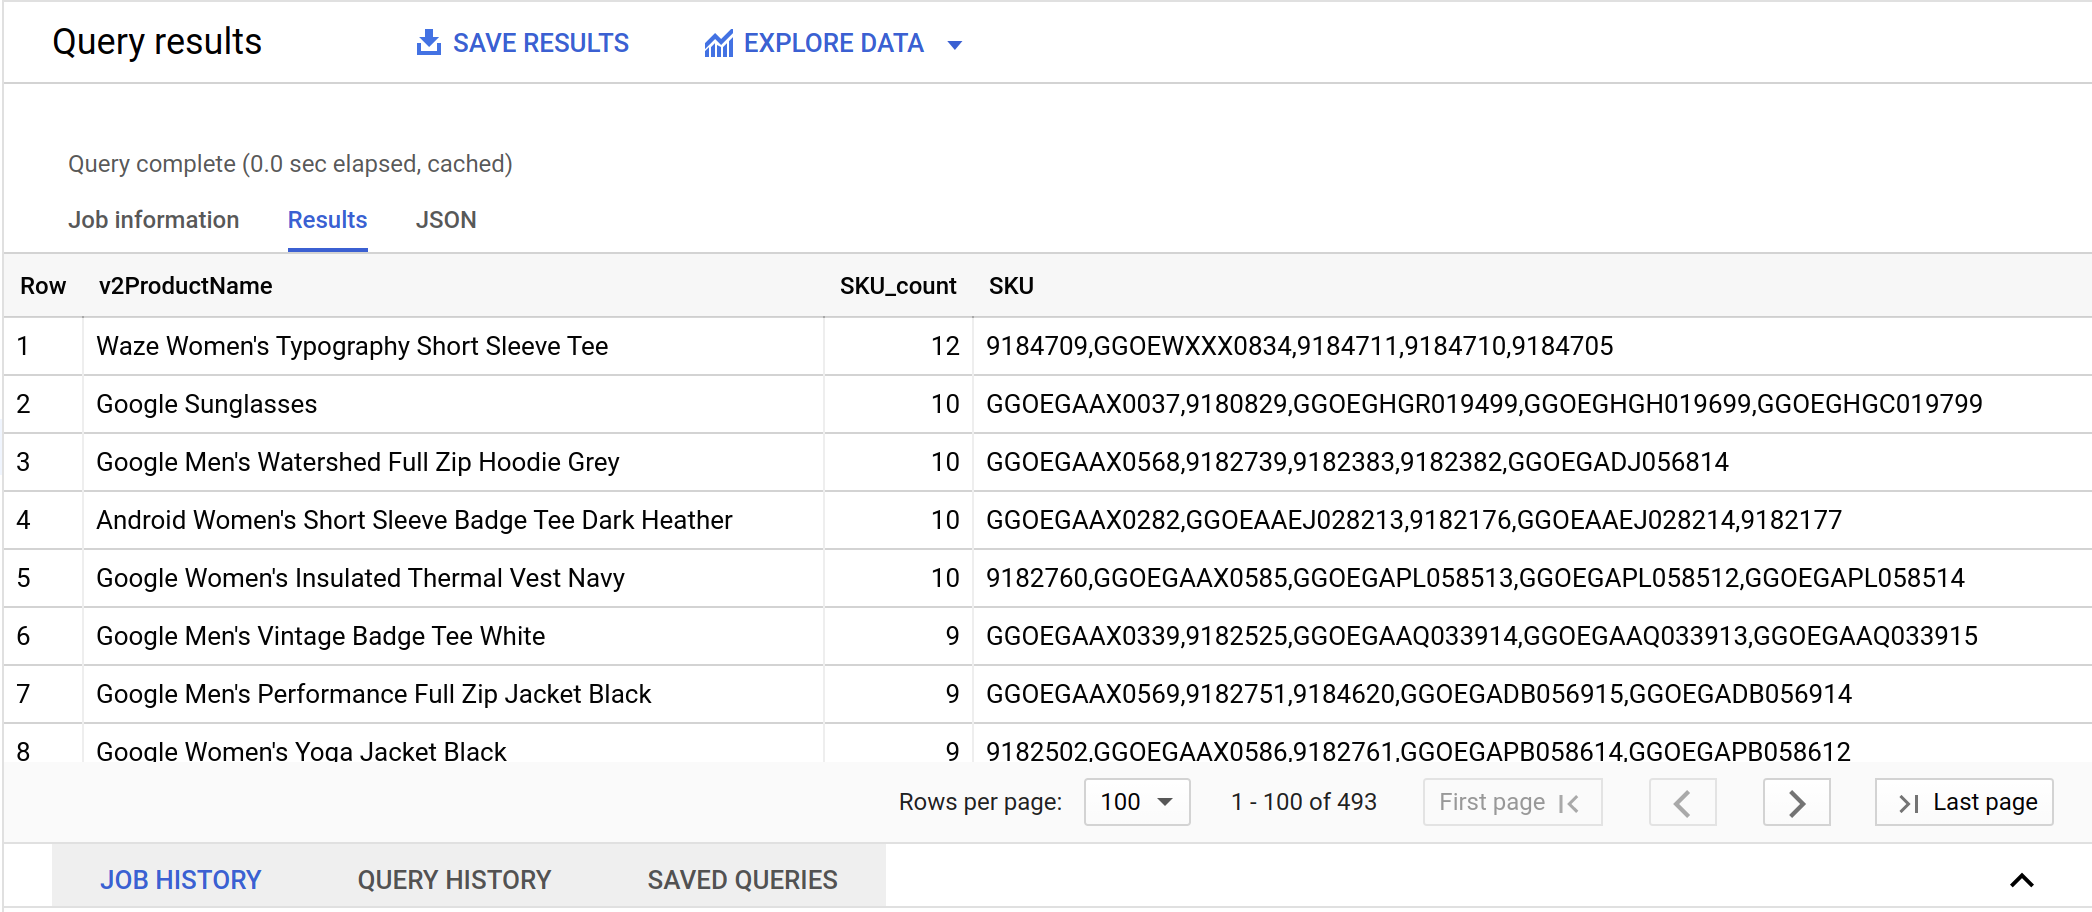
So you have seen that 1 Product can have 12 SKUs. What about 1 SKU? Should it be allowed to belong to more than 1 product?
You will see why this many-to-many data relationship will be an issue in the next section.
Click Check my progress to verify the objective.
In inventory tracking, a SKU is designed to uniquely identify one and only one product. For us, it will be the basis of your JOIN condition when you lookup information from other tables. Having a non-unique key can cause serious data issues as you will see.
'GGOEGPJC019099'.Possible solution:
|
v2ProductName |
productSKU |
|
7" Dog Frisbee |
GGOEGPJC019099 |
|
7" Dog Frisbee |
GGOEGPJC019099 |
|
Google 7-inch Dog Flying Disc Blue |
GGOEGPJC019099 |
From the query results, it looks like there are three different names for the same product. In this example, there is a special character in one name and a slightly different name for another:
Now see the impact of joining on a dataset with multiple products for a single SKU. First explore the product inventory dataset (the products table) to see if this SKU is unique there.
You now have two datasets: one for inventory stock level and the other for our website analytics. JOIN the inventory dataset against your website product names and SKUs so you can have the inventory stock level associated with each product for sale on the website.
Next, expand our previous query to simply SUM the inventory available by product.
Oh no! It is 154 x 3 = 462 or triple counting the inventory! This is called an unintentional cross join (a topic that will be revisited later).
Click Check my progress to verify the objective.
What are the options to solve your triple counting dilemma? First you need to only select distinct SKUs from the website before joining on other datasets.
You know that there can be more than one product name (like 7" Dog Frisbee) that can share a single SKU.
Now instead of having a row for every Product Name, you only have a row for each unique SKU.
Now you're ready to join against your product inventory dataset again.
It seems 819 SKUs were lost after joining the datasets Investigate by adding more specificity in your fields (one SKU column from each dataset):
It appears the SKUs are present in both of those datasets after the join for these 1,090 records. How can you find the missing records?
The default JOIN type is an INNER JOIN which returns records only if there is a SKU match on both the left and the right tables that are joined.
Possible solution:
You have successfully used a LEFT JOIN to return all of the original 1,909 website SKUs in your results.
How many SKUs are missing from your product inventory set?
Possible solution:
Question: How many products are missing?
Answer: 819 products are missing (SKU IS NULL) from your product inventory dataset.
Now, what about the reverse situation? Are there any products in the product inventory dataset but missing from the website?
Possible solution:
Answer: Yes. There are two product SKUs missing from the website dataset
Next, add more fields from the product inventory dataset for more details.
Why would the below products be missing from the ecommerce website dataset?
|
website_SKU |
SKU |
name |
orderedQuantity |
stockLevel |
restockingLeadTime |
sentimentScore |
sentimentMagnitude |
|
null |
GGOBJGOWUSG69402 |
USB wired soundbar - in store only |
10 |
15 |
2 |
1.0 |
1.0 |
|
null |
GGADFBSBKS42347 |
PC gaming speakers |
0 |
100 |
1 |
null |
null |
Possible answers:
Why would the new product not show up on your website dataset?
What if you wanted one query that listed all products missing from either the website or inventory?
Possible solution:
You have your 819 + 2 = 821 product SKUs.
LEFT JOIN + RIGHT JOIN = FULL JOIN which returns all records from both tables regardless of matching join keys. You then filter out where you have mismatches on either side
Not knowing the relationship between data table keys (1:1, 1:N, N:N) can return unexpected results and also significantly reduce query performance.
The last join type is the CROSS JOIN.
Create a new table with a site-wide discount percent that you want applied across products in the Clearance category.
In the left pane, site_wide_promotion is now listed in the Resource section under your project and dataset.
See the impact of unintentionally adding more than one record in the discount table.
Next, view the data values in the promotion table.
How many records were returned?
Answer: 3
What happens when you apply the discount again across all 82 clearance products?
How many products are returned?
Answer: Instead of 82, you now have 246 returned which is more records than your original table started with.
Now investigate the underlying cause by examining one product SKU.
What was the impact of the CROSS JOIN?
Answer: Since there are 3 discount codes to cross join on, you are multiplying the original dataset by 3.
The solution is to know your data relationships before you join and don't assume keys are unique.
Click Check my progress to verify the objective.
You've concluded this lab and worked through some serious SQL join pitfalls by identifying duplicate records and knowing when to use each type of JOIN. Nice work!
...helps you make the most of Google Cloud technologies. Our classes include technical skills and best practices to help you get up to speed quickly and continue your learning journey. We offer fundamental to advanced level training, with on-demand, live, and virtual options to suit your busy schedule. Certifications help you validate and prove your skill and expertise in Google Cloud technologies.
Manual Last Updated August 19, 2025
Lab Last Tested August 19, 2025
Copyright 2025 Google LLC. All rights reserved. Google and the Google logo are trademarks of Google LLC. All other company and product names may be trademarks of the respective companies with which they are associated.


This content is not currently available
We will notify you via email when it becomes available

Great!
We will contact you via email if it becomes available

One lab at a time
Confirm to end all existing labs and start this one