
准备工作
- 实验会创建一个 Google Cloud 项目和一些资源,供您使用限定的一段时间
- 实验有时间限制,并且没有暂停功能。如果您中途结束实验,则必须重新开始。
- 在屏幕左上角,点击开始实验即可开始
Google Looker Studio turns your data into informative dashboards and reports that are easy to read, easy to share, and fully customizable. Dashboarding allows you to tell great data stories to support better business decisions.
BigQuery is Google's fully managed, NoOps, low cost analytics database. With BigQuery you can query terabytes and terabytes of data without having any infrastructure to manage or needing a database administrator. BigQuery uses SQL and can take advantage of the pay-as-you-go model. BigQuery allows you to focus on analyzing data to find meaningful insights.
The dataset used in this lab is an ecommerce dataset that has millions of Google Analytics records for the Google Merchandise Store loaded into BigQuery. You have a copy of that dataset for this lab and will explore the available fields and row for insights.
This lab focuses on how to create new reports and explore your ecommerce dataset visually for insights.
In this lab, you:
For each lab, you get a new Google Cloud project and set of resources for a fixed time at no cost.
Sign in to Qwiklabs using an incognito window.
Note the lab's access time (for example, 1:15:00), and make sure you can finish within that time.
There is no pause feature. You can restart if needed, but you have to start at the beginning.
When ready, click Start lab.
Note your lab credentials (Username and Password). You will use them to sign in to the Google Cloud Console.
Click Open Google Console.
Click Use another account and copy/paste credentials for this lab into the prompts.
If you use other credentials, you'll receive errors or incur charges.
Accept the terms and skip the recovery resource page.
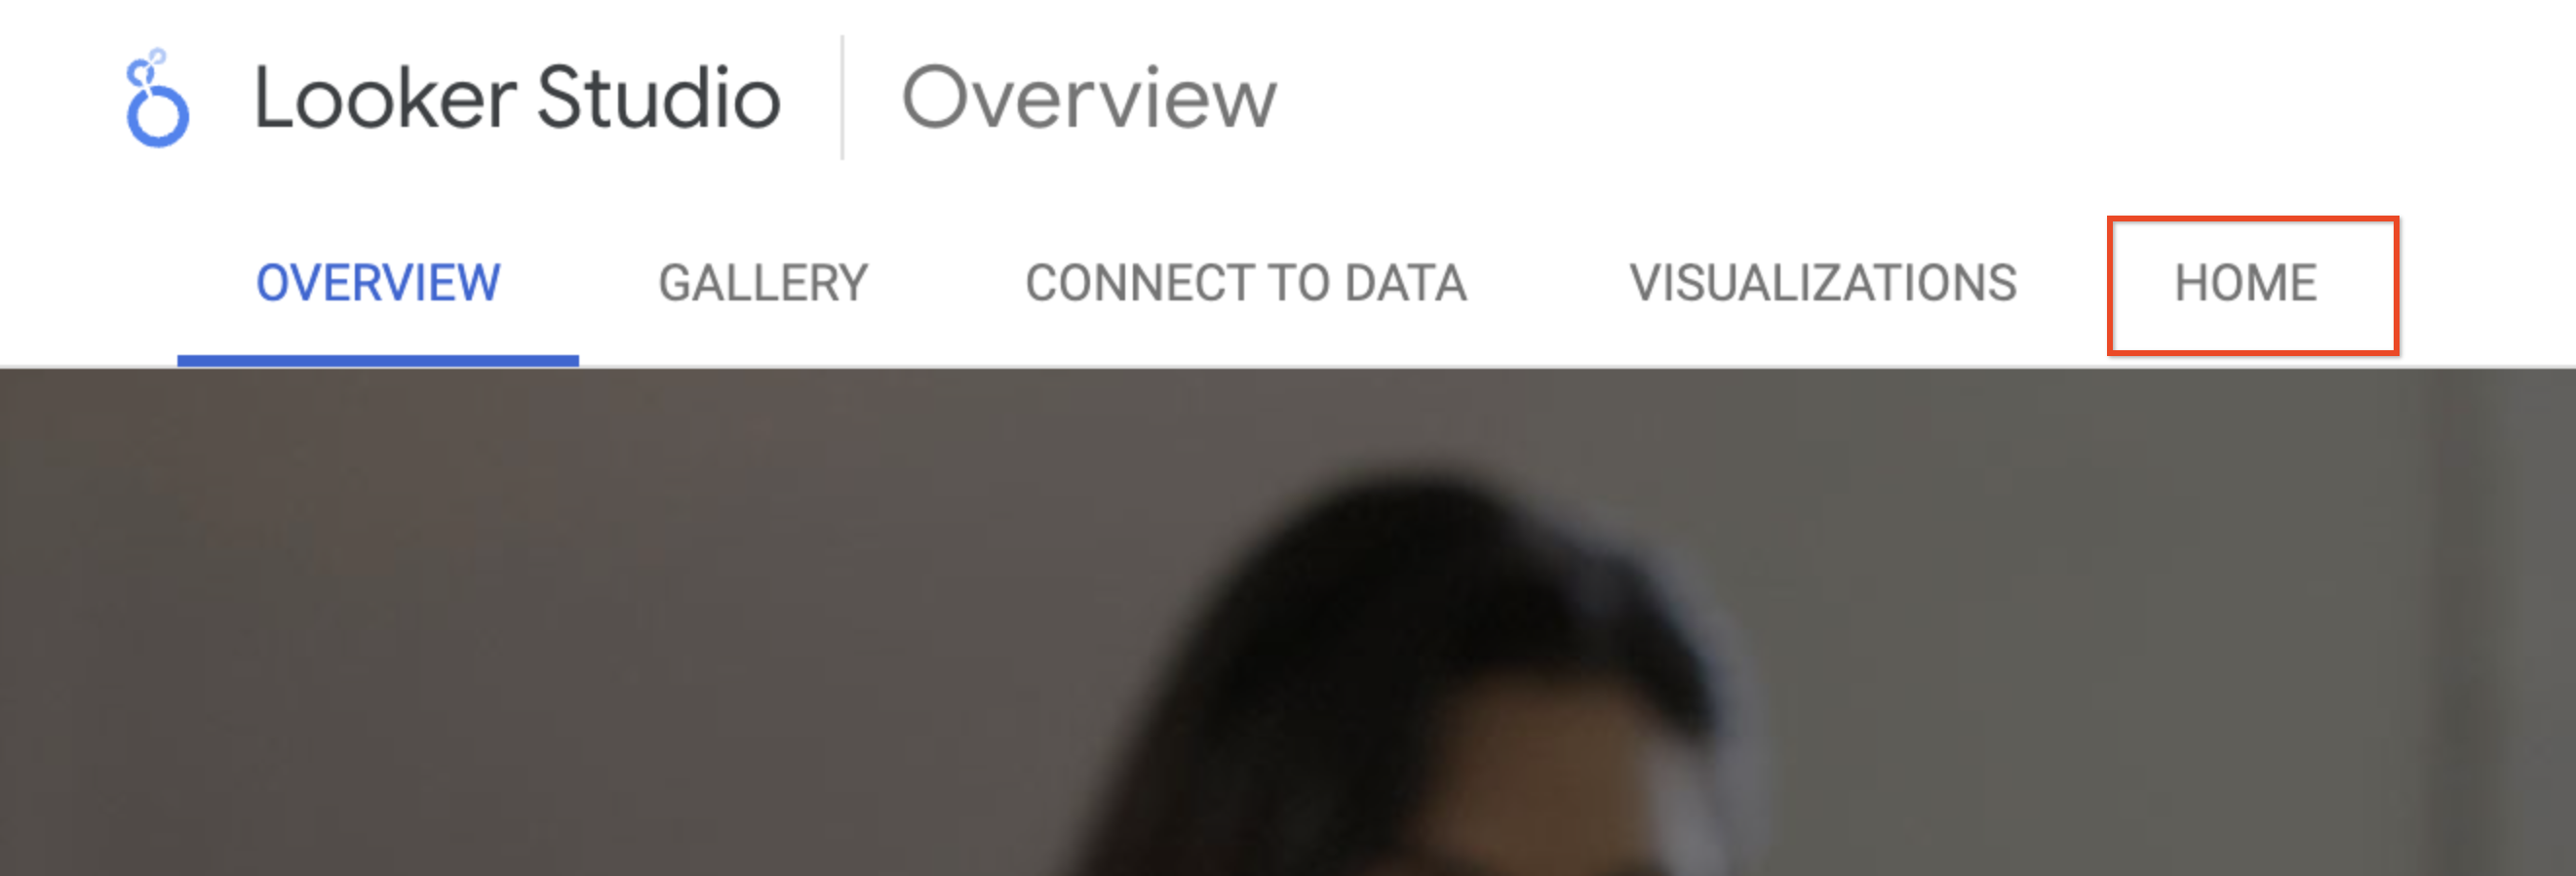
The Looker Studio page opens.
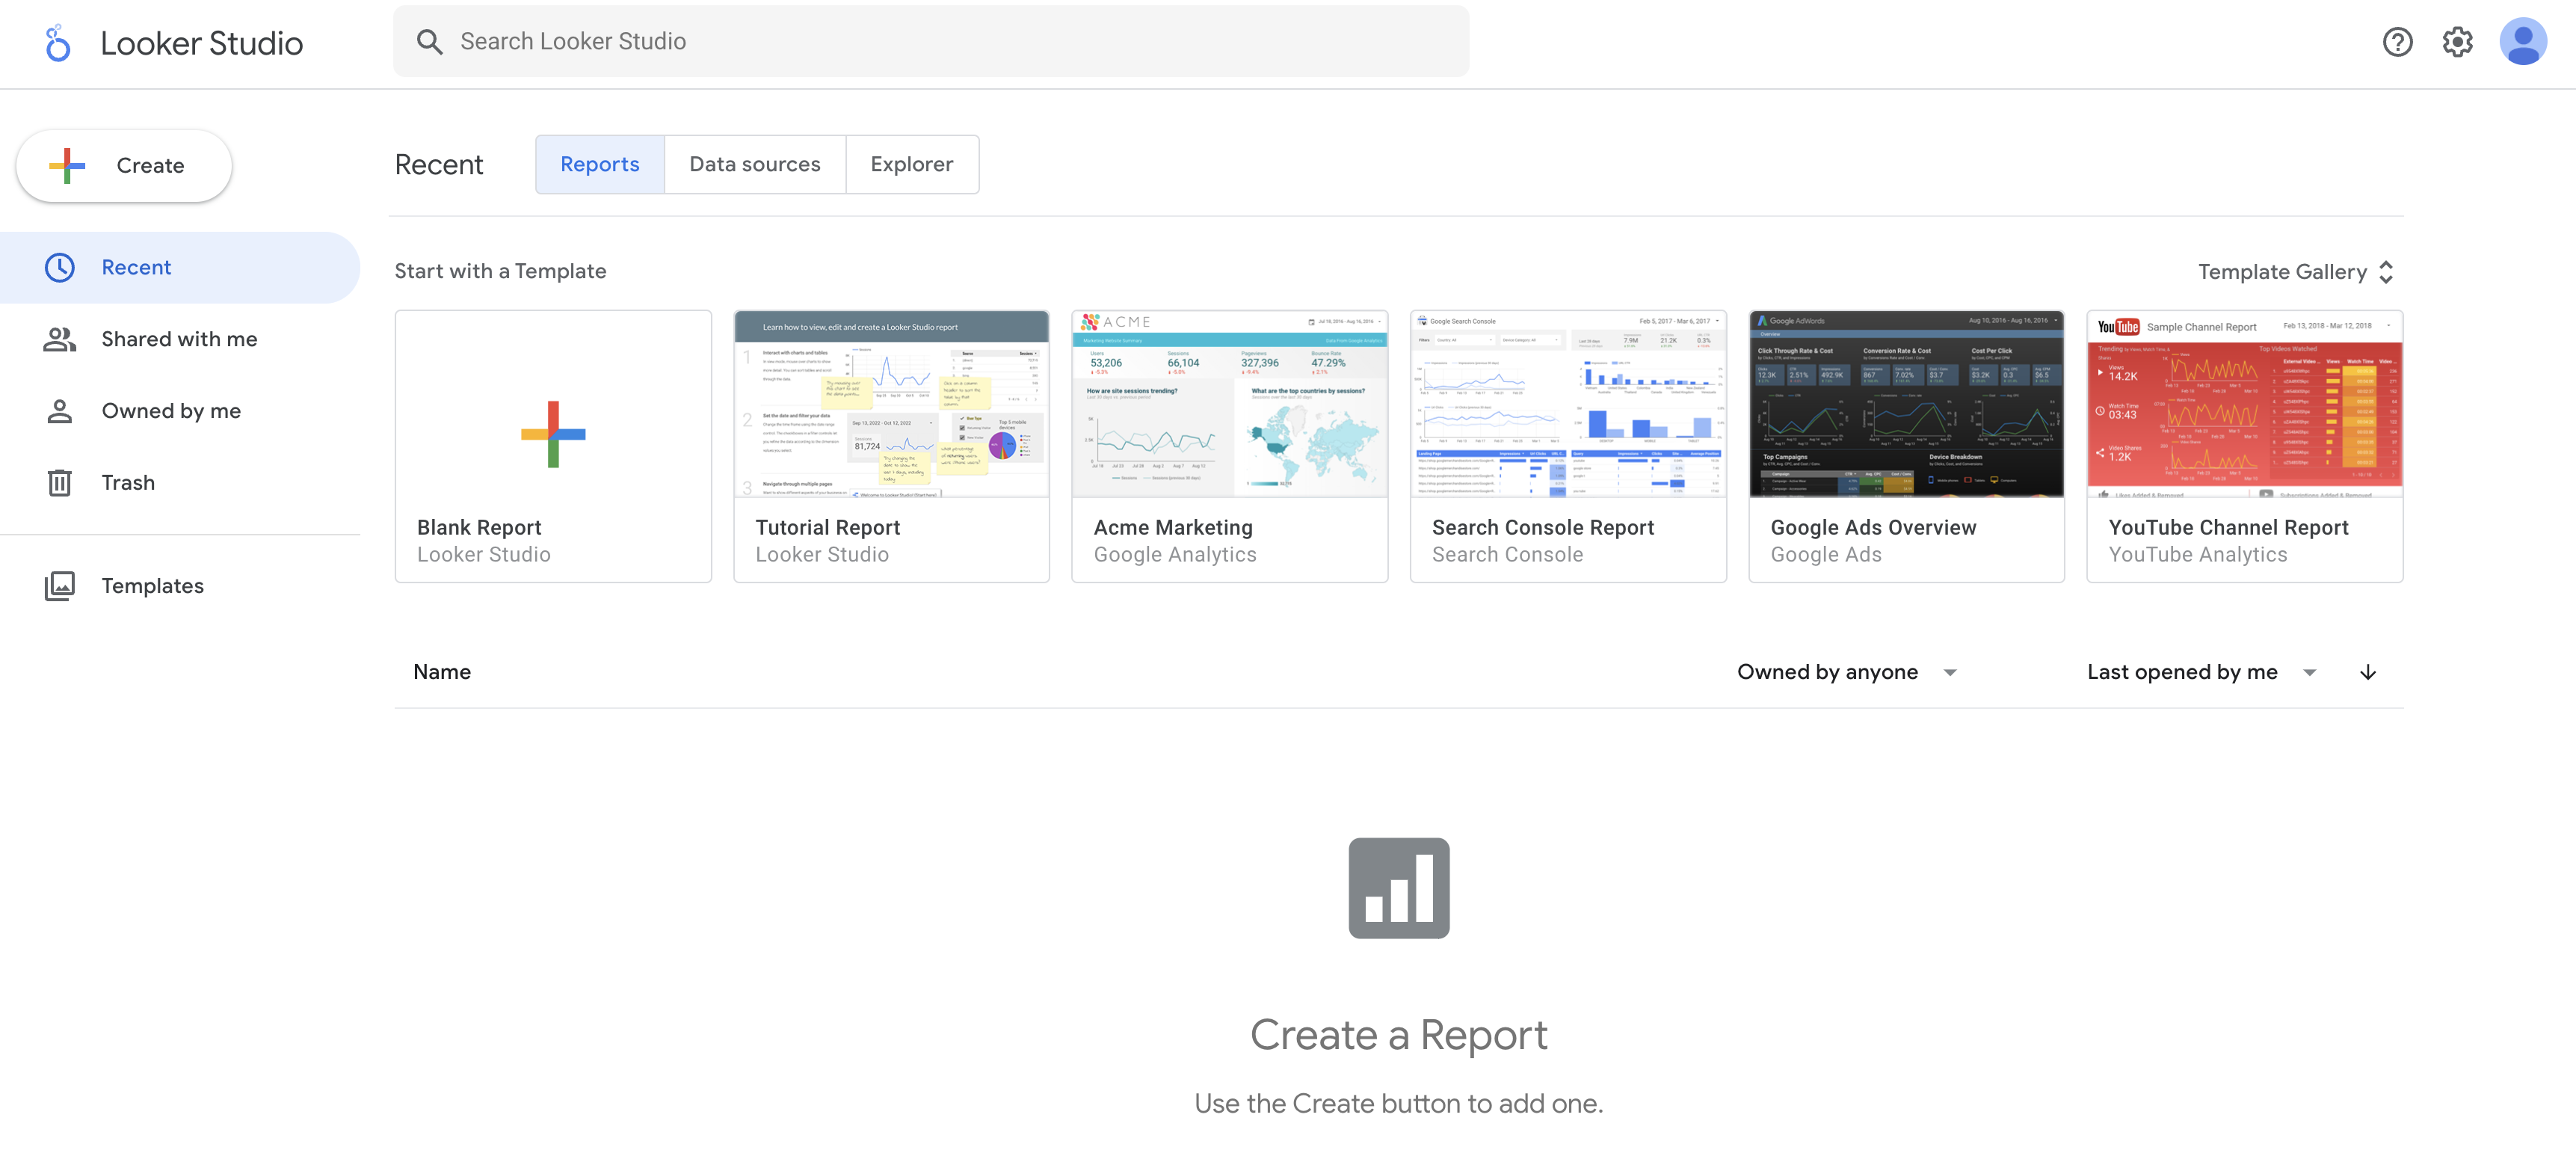
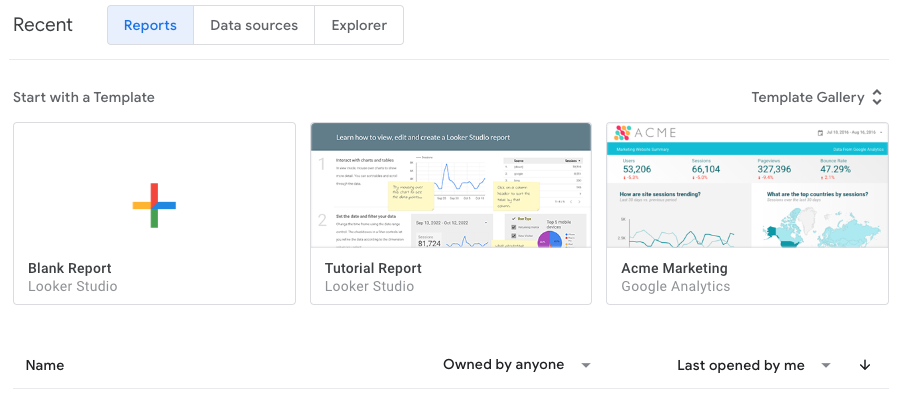
The Looker Studio home page opens.
In the Start with a Template section, click the Blank Report template.
Click through the following prompts:
A new, untitled report opens.
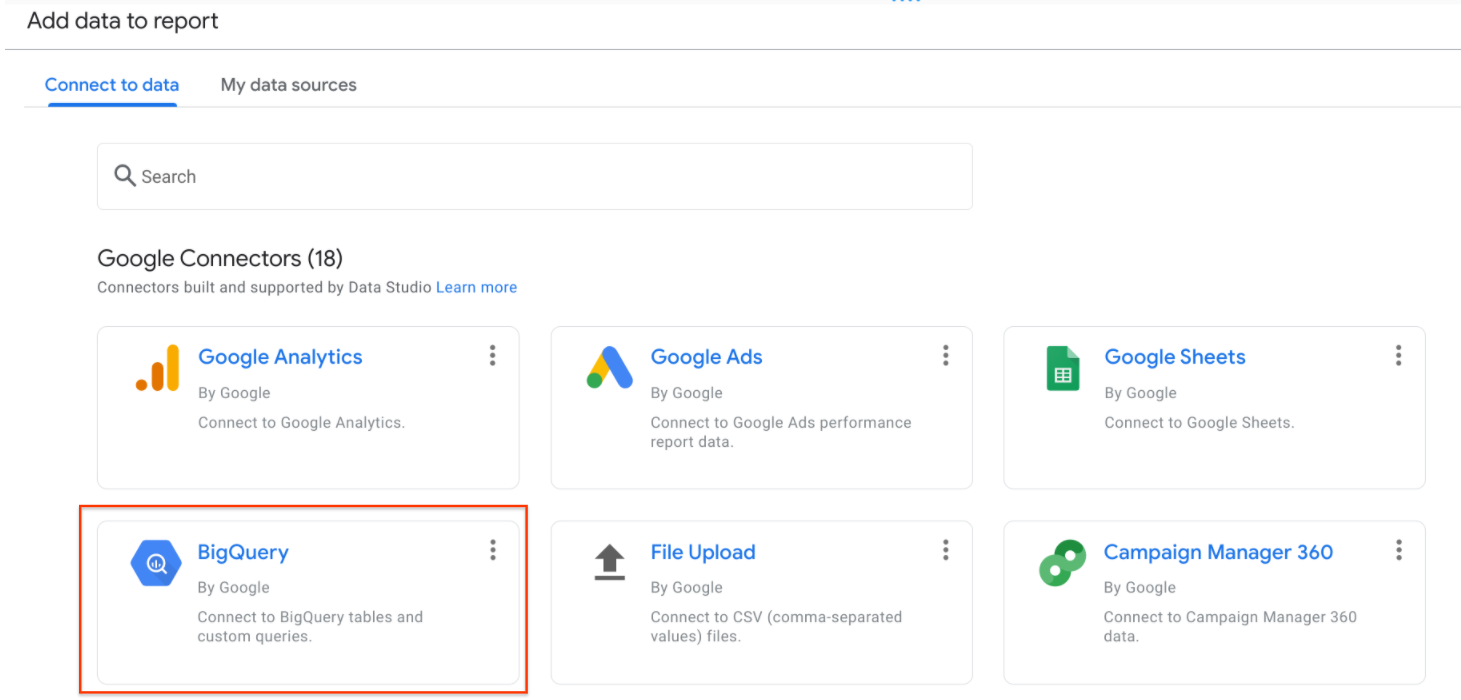
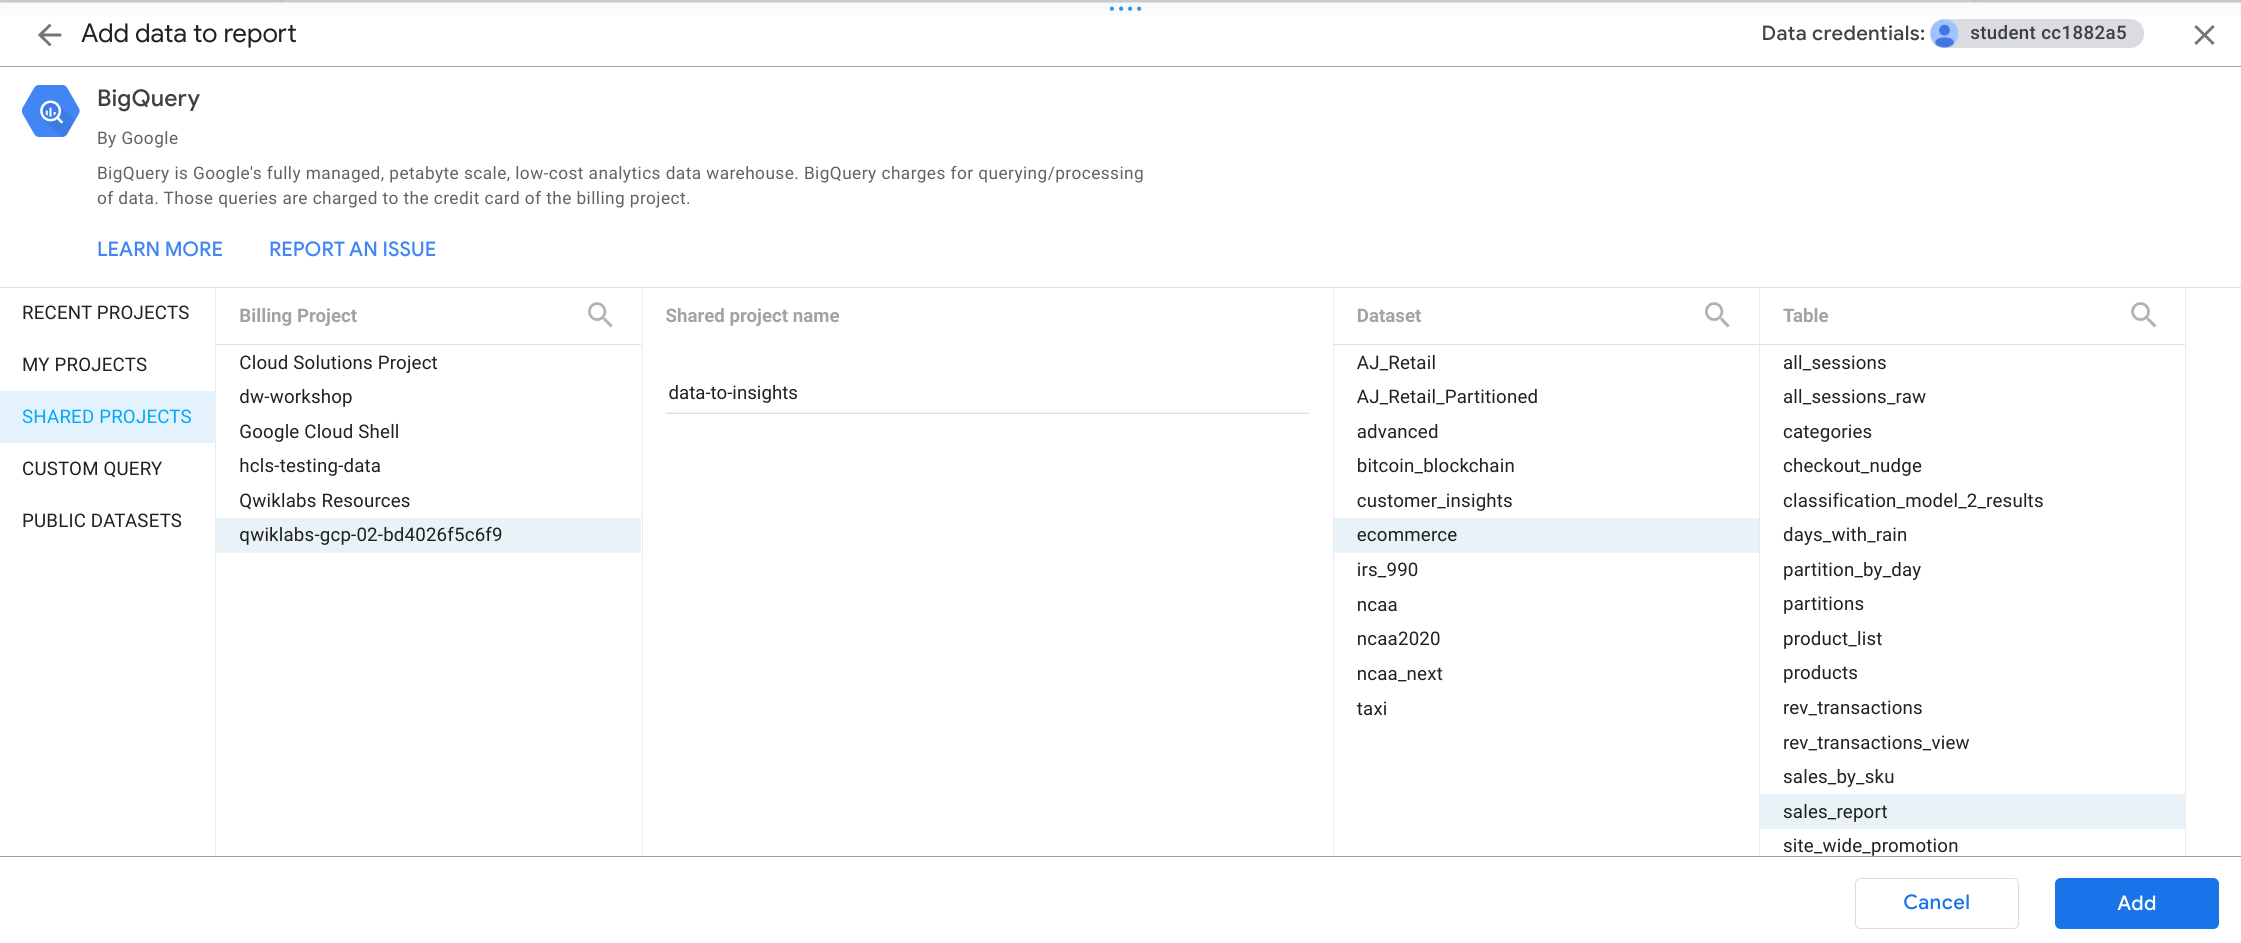
You'll be on the Add data to report > Connect to data tab..
For Google Connectors, select BigQuery.
data-to-insights.Click Add in the bottom right corner and then click Add to Report.
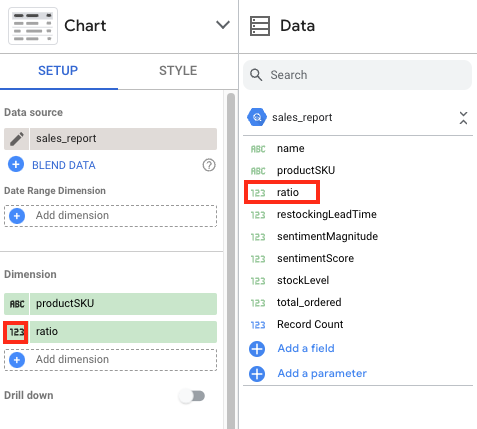
A preview of the available fields that you can add to the report opens.
Under Data panel, click on ratio, and drag it into the Dimension section.
Click in the number icon to edit.
Scroll down to the Data type, and use the dropdown menu to select Numeric > Percent.
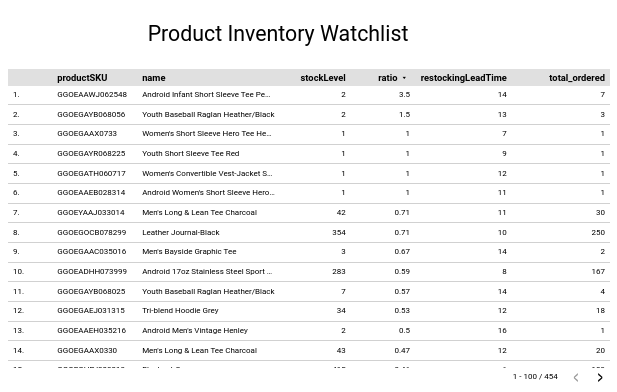
Verify that the ratio column is added with values as a percentage.
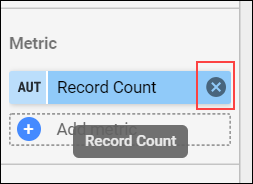
Delete this table. You will now create a report with a customized table.
You are now viewing a blank canvas where you'll add visuals and interactive filters for your reporting users.
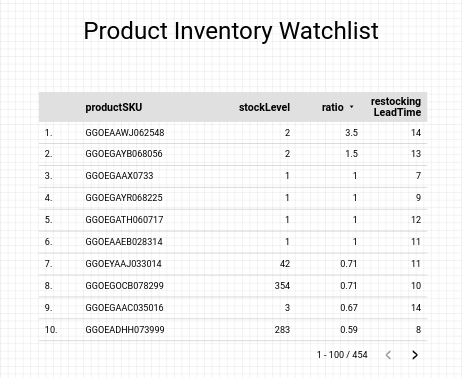
Untitled Report and rename it to Ecommerce Product Operations Report.Product Inventory Watchlist.You've successfully created a basic report in Google Looker Studio. Continue exploring new chart types and connect to additional data sources for richer, more visual reporting.
When you have completed your lab, click End Lab. Google Cloud Skills Boost removes the resources you’ve used and cleans the account for you.
You will be given an opportunity to rate the lab experience. Select the applicable number of stars, type a comment, and then click Submit.
The number of stars indicates the following:
You can close the dialog box if you don't want to provide feedback.
For feedback, suggestions, or corrections, please use the Support tab.
Copyright 2022 Google LLC All rights reserved. Google and the Google logo are trademarks of Google LLC. All other company and product names may be trademarks of the respective companies with which they are associated.


此内容目前不可用
一旦可用,我们会通过电子邮件告知您

太好了!
一旦可用,我们会通过电子邮件告知您

一次一个实验
确认结束所有现有实验并开始此实验