Google Looker Studio turns your data into informative dashboards and reports that are easy to read, easy to share, and fully customizable. Dashboarding allows you to tell great data stories to support better business decisions.
BigQuery is Google's fully managed, NoOps, low cost analytics database. With BigQuery you can query terabytes and terabytes of data without having any infrastructure to manage or needing a database administrator. BigQuery uses SQL and can take advantage of the pay-as-you-go model. BigQuery allows you to focus on analyzing data to find meaningful insights.
The dataset used in this lab is an ecommerce dataset that has millions of Google Analytics records for the Google Merchandise Store loaded into BigQuery. You have a copy of that dataset for this lab and will explore the available fields and row for insights.
This lab focuses on how to create new reports and explore your ecommerce dataset visually for insights.
What you'll do
In this lab, you:
Launch Looker Studio
Create and manipulate a report
Create an interactive filter for your report
Setup and requirements
For each lab, you get a new Google Cloud project and set of resources for a fixed time at no cost.
Sign in to Qwiklabs using an incognito window.
Note the lab's access time (for example, 1:15:00), and make sure you can finish within that time.
There is no pause feature. You can restart if needed, but you have to start at the beginning.
When ready, click Start lab.
Note your lab credentials (Username and Password). You will use them to sign in to the Google Cloud Console.
Click Open Google Console.
Click Use another account and copy/paste credentials for this lab into the prompts.
If you use other credentials, you'll receive errors or incur charges.
Accept the terms and skip the recovery resource page.
Task 1. Launch Looker Studio and create a blank report
In the Choose an account dialog, click Use another account.
On the Sign in dialog, enter your Username from the Connection Details panel, then click Next.
On the Welcome dialog, enter your Password from the Connection Details panel, then click Next.
On the Welcome to your new account dialog, click Accept.
On the Protect your account dialog, click Confirm.
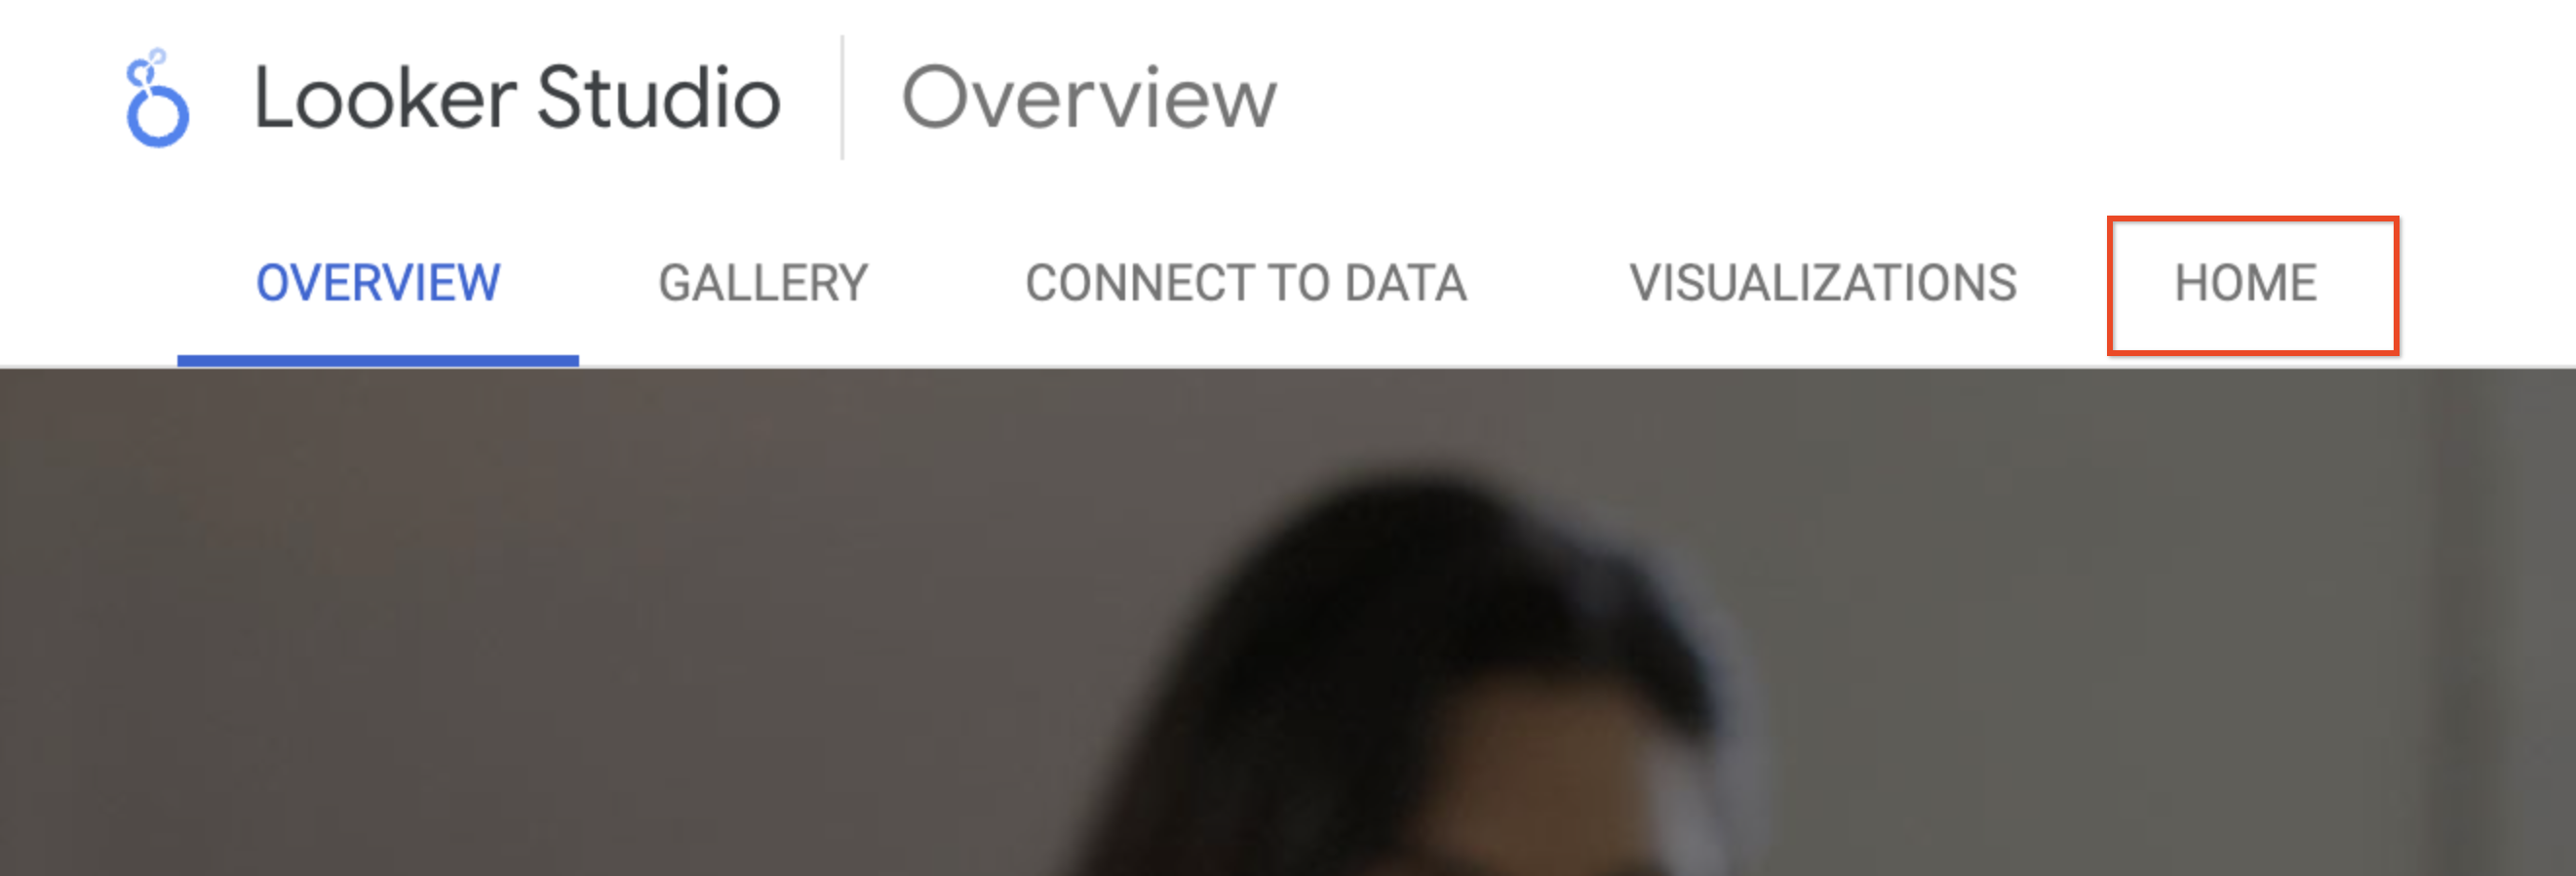
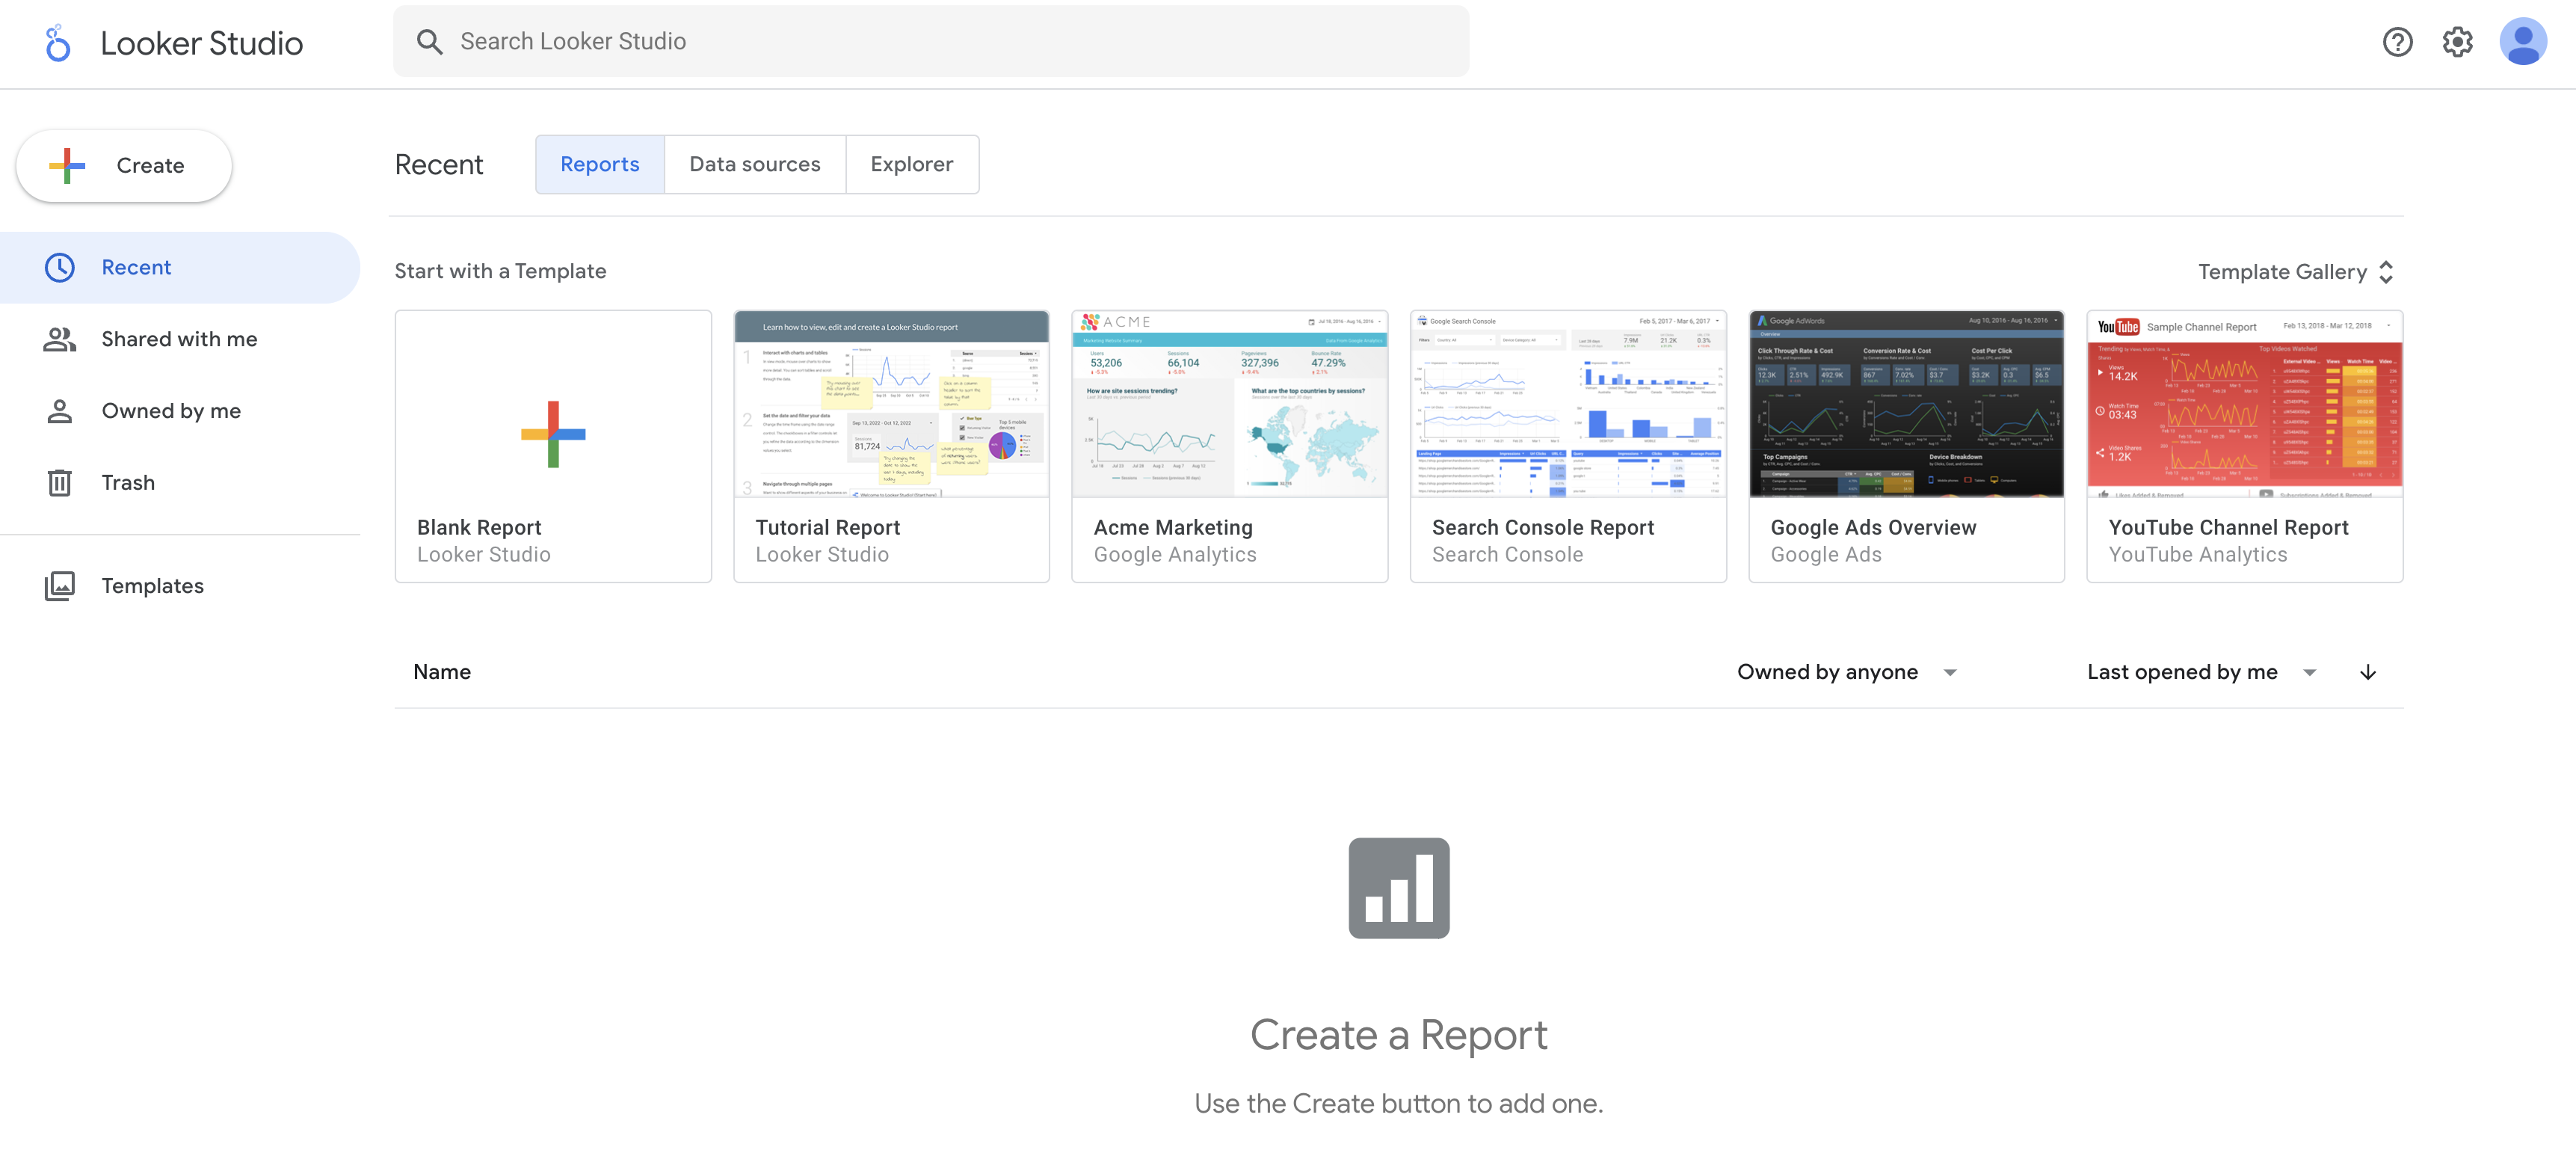
The Looker Studio home page opens.
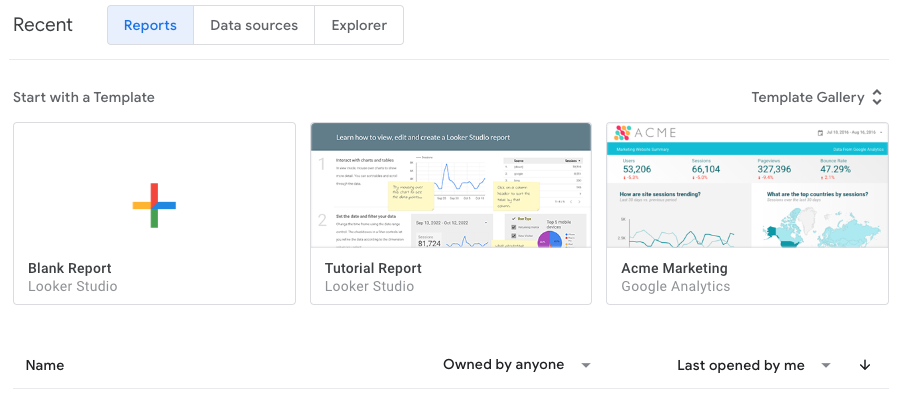
In the Start with a Template section, click the Blank Report template.
Click through the following prompts:
Select your Country and add your Company name.
Check the Terms of service checkbox to acknowledge you have read and agree to the Google Looker Studio Additional Terms, then click Continue.
On Set up your email preferences to get the most out of Google Looker Studio dialog, select No to all options, then click Continue.
Click the Blank Report template again.
A new, untitled report opens.
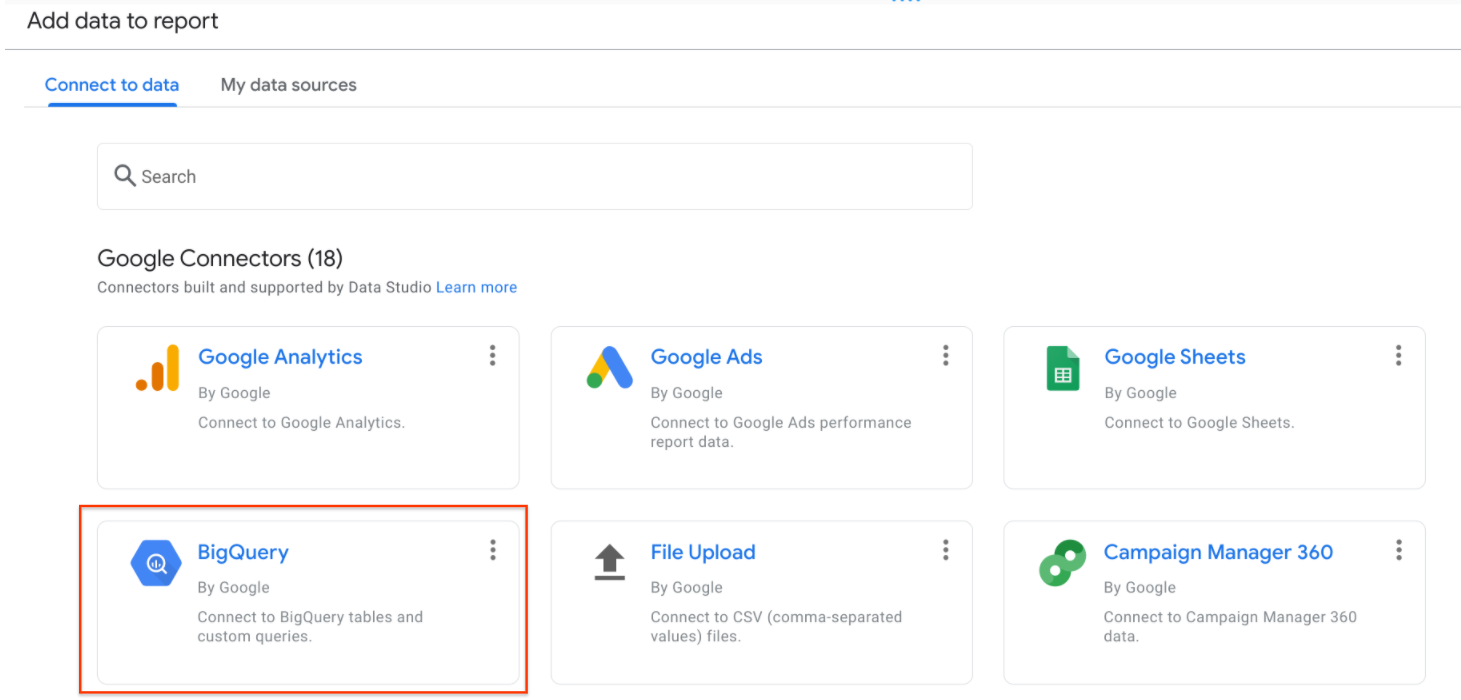
You'll be on the Add data to report > Connect to data tab..
For Google Connectors, select BigQuery.
For Authorization, click Authorize. This allows Looker Studio access to your GCP project.
If prompted, click Allow to give Google Looker Studio access to your Google account, which allows a view to data in BigQuery.
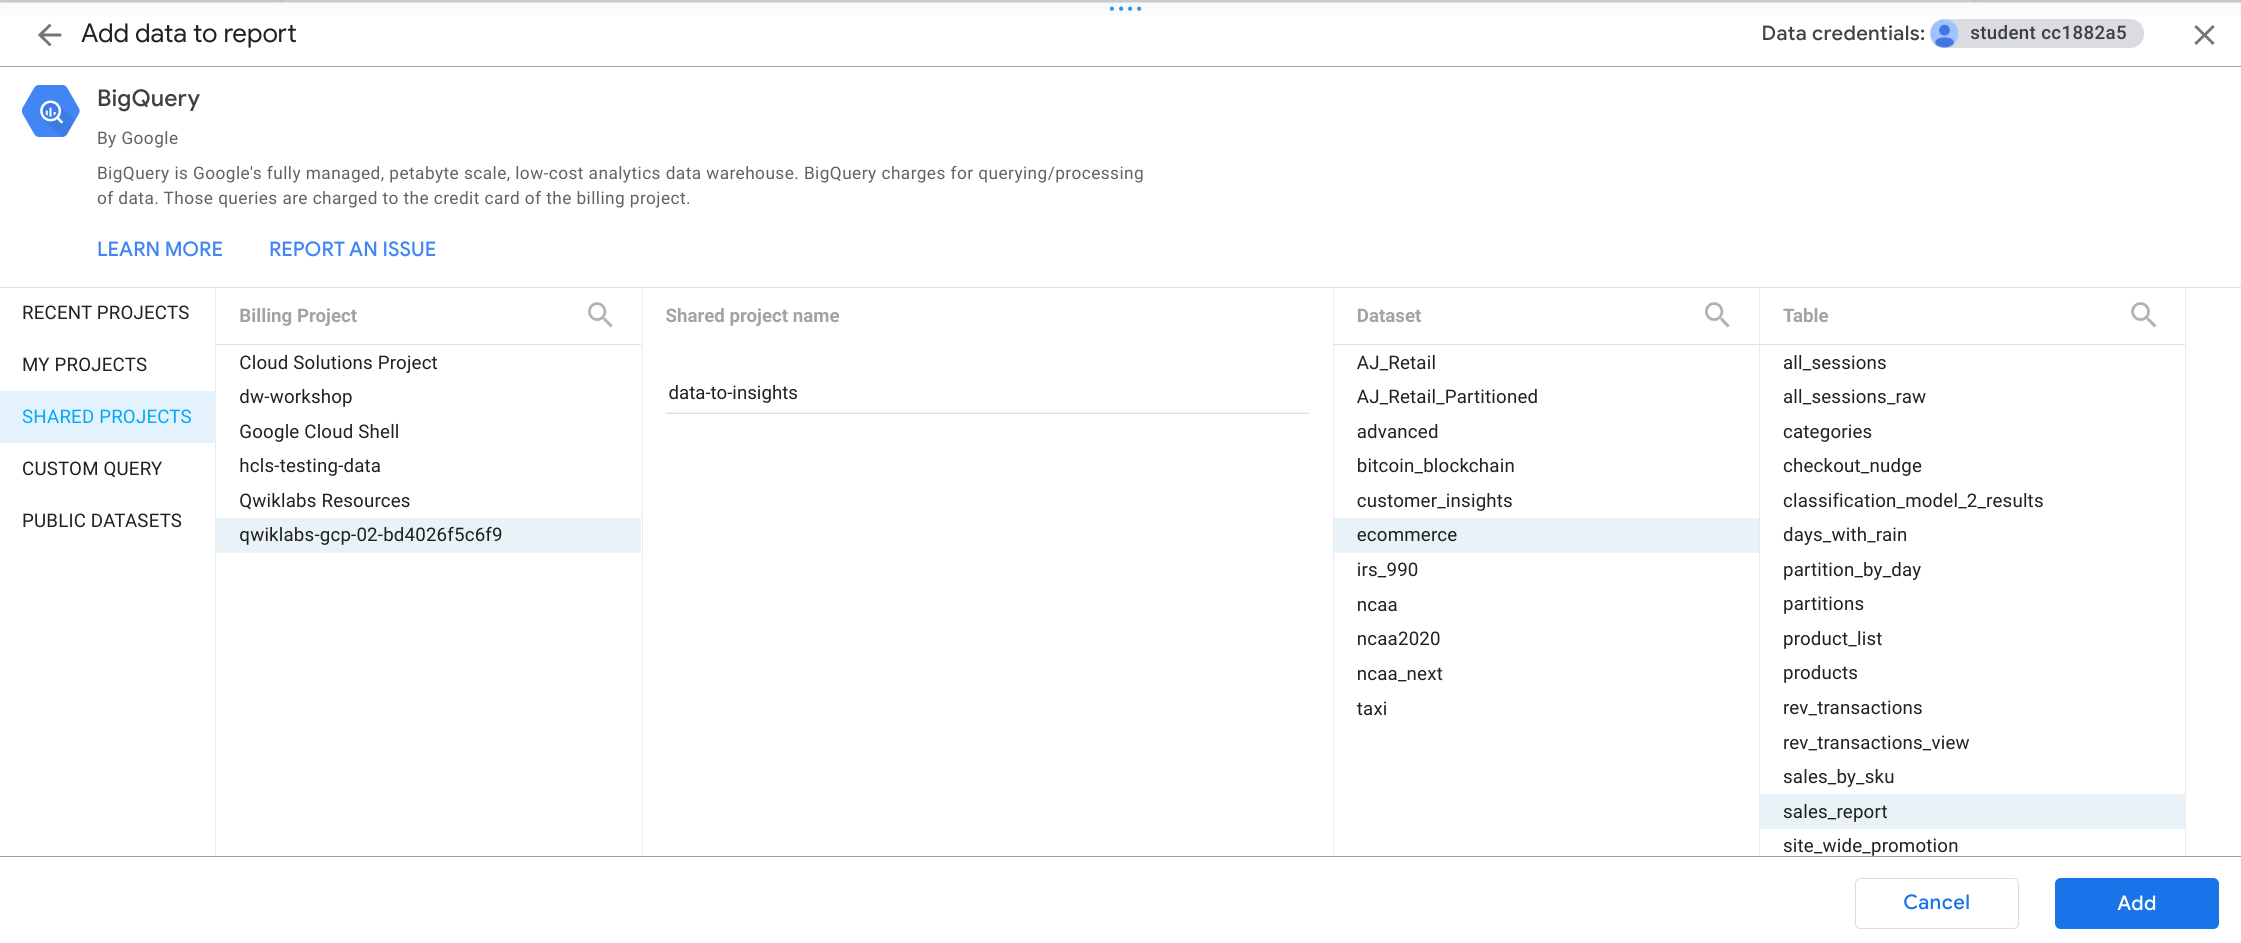
Define your project:
Click on Shared Projects > your GCP Project ID, which is found in the Connection Details panel (begins with qwiklabs-).
For Shared project name type data-to-insights.
For Dataset select ecommerce.
For Table select sales_report.
Click Add in the bottom right corner and then click Add to Report.
A preview of the available fields that you can add to the report opens.
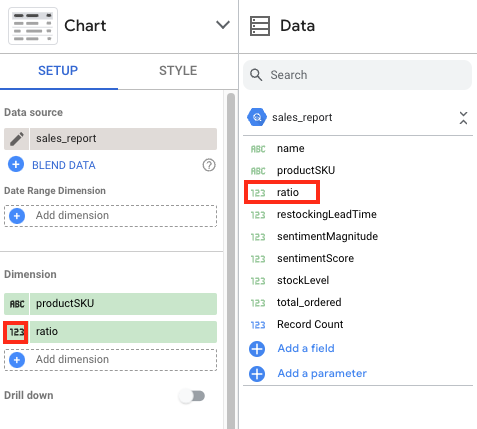
Under Data panel, click on ratio, and drag it into the Dimension section.
Click in the number icon to edit.
Scroll down to the Data type, and use the dropdown menu to select Numeric > Percent.
Verify that the ratio column is added with values as a percentage.
Delete this table. You will now create a report with a customized table.
Task 2. Create a report
You are now viewing a blank canvas where you'll add visuals and interactive filters for your reporting users.
Add a report title and page title
In the top-left, click Untitled Report and rename it to Ecommerce Product Operations Report.
In the reporting tools tray, click on the Text icon (looks like a boxed in A).
Near the top of your blank reporting canvas, click to create a text area.
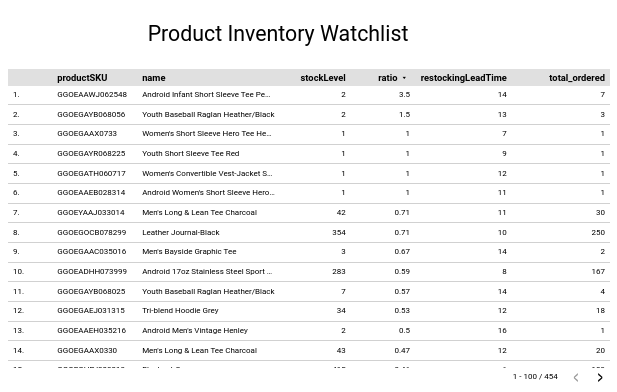
In the text area, type Product Inventory Watchlist.
Highlight the text in the text area and in the Text Properties panel, increase the font size to 32px.
Create a data table
From the menu bar, select Insert > Table.
Beneath your page title drop your table.
In the new Setup and Style panel that opens, specify the following in the Setup tab:
Click productSKU from the Data panel and drag it to the Add dimension field in the Dimension section (this might already be set by default).
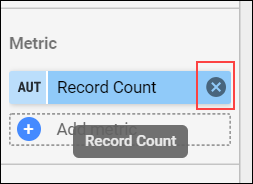
In the Metric section, if present, remove Record Count as a Metric by clicking x.
Drag stockLevel to add it as a new Metric
Drag ratio to add it as a new Metric
Drag restockingLeadTime to add it as a new Metric
Set the Sort field to ratio from the dropdown menu for the new Sort field.
Specify Descending
At the top of the panel, click the Style tab.
Under Table Header, check Wrap Text.
Manually adjust the widths of the table columns by hovering over the vertical border and click and drag.
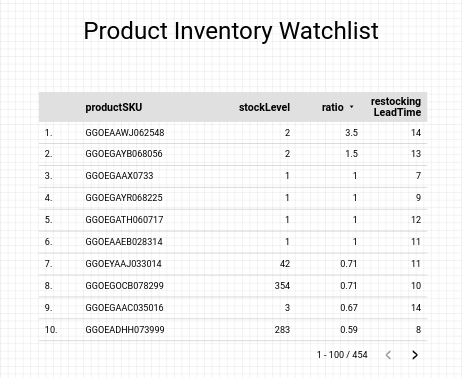
Confirm your report looks visually similar to the report below:
View your report
From the Data panel, drag and add name as the Dimension and total_ordered as the Metric.
In the upper-right, select the View button to preview your report.
Confirm your report looks visually similar to the report below:
Congratulations!
You've successfully created a basic report in Google Looker Studio. Continue exploring new chart types and connect to additional data sources for richer, more visual reporting.
End your lab
When you have completed your lab, click End Lab. Google Cloud Skills Boost removes the resources you’ve used and cleans the account for you.
You will be given an opportunity to rate the lab experience. Select the applicable number of stars, type a comment, and then click Submit.
The number of stars indicates the following:
1 star = Very dissatisfied
2 stars = Dissatisfied
3 stars = Neutral
4 stars = Satisfied
5 stars = Very satisfied
You can close the dialog box if you don't want to provide feedback.
For feedback, suggestions, or corrections, please use the Support tab.
Copyright 2022 Google LLC All rights reserved. Google and the Google logo are trademarks of Google LLC. All other company and product names may be trademarks of the respective companies with which they are associated.
Labs erstellen ein Google Cloud-Projekt und Ressourcen für einen bestimmten Zeitraum
Labs haben ein Zeitlimit und keine Pausenfunktion. Wenn Sie das Lab beenden, müssen Sie von vorne beginnen.
Klicken Sie links oben auf dem Bildschirm auf Lab starten, um zu beginnen
Privates Surfen verwenden
Kopieren Sie den bereitgestellten Nutzernamen und das Passwort für das Lab
Klicken Sie im privaten Modus auf Konsole öffnen
In der Konsole anmelden
Melden Sie sich mit Ihren Lab-Anmeldedaten an. Wenn Sie andere Anmeldedaten verwenden, kann dies zu Fehlern führen oder es fallen Kosten an.
Akzeptieren Sie die Nutzungsbedingungen und überspringen Sie die Seite zur Wiederherstellung der Ressourcen
Klicken Sie erst auf Lab beenden, wenn Sie das Lab abgeschlossen haben oder es neu starten möchten. Andernfalls werden Ihre bisherige Arbeit und das Projekt gelöscht.
Diese Inhalte sind derzeit nicht verfügbar
Bei Verfügbarkeit des Labs benachrichtigen wir Sie per E-Mail
Sehr gut!
Bei Verfügbarkeit kontaktieren wir Sie per E-Mail
Es ist immer nur ein Lab möglich
Bestätigen Sie, dass Sie alle vorhandenen Labs beenden und dieses Lab starten möchten
Privates Surfen für das Lab verwenden
Nutzen Sie den privaten oder Inkognitomodus, um dieses Lab durchzuführen. So wird verhindert, dass es zu Konflikten zwischen Ihrem persönlichen Konto und dem Teilnehmerkonto kommt und zusätzliche Gebühren für Ihr persönliches Konto erhoben werden.
In this lab, you learn how to connect Google Looker Studio to Google BigQuery data tables, create charts, and explore the relationships between dimensions and measures.