Checkpoints
Verify prometheus has been deployed
/ 34
Verify metric filter is applied
/ 33
Check if scrape interval has been changed
/ 33
Reduce Costs for the Managed Service for Prometheus
GSP1027

Overview
The Google Cloud Managed Service for Prometheus charges for the number of samples ingested into Cloud Monitoring and for read requests to the Monitoring API. The number of samples ingested is the primary contributor to your cost.
In this lab, you will explore cost control mechanisms when utilizing the Managed Service for Prometheus on Google Cloud.
Objectives
In this lab, you will learn how to:
- Deploy Google Managed Prometheus (GMP) in a Google Kubernetes Engine (GKE) cluster as well as a python application
- Reduce the number of time series metrics you send to the managed service by filtering the metric data generated
- Reduce the number of samples collected by changing the scraping interval
Setup and requirements
Before you click the Start Lab button
Read these instructions. Labs are timed and you cannot pause them. The timer, which starts when you click Start Lab, shows how long Google Cloud resources will be made available to you.
This hands-on lab lets you do the lab activities yourself in a real cloud environment, not in a simulation or demo environment. It does so by giving you new, temporary credentials that you use to sign in and access Google Cloud for the duration of the lab.
To complete this lab, you need:
- Access to a standard internet browser (Chrome browser recommended).
- Time to complete the lab---remember, once you start, you cannot pause a lab.
How to start your lab and sign in to the Google Cloud console
-
Click the Start Lab button. If you need to pay for the lab, a pop-up opens for you to select your payment method. On the left is the Lab Details panel with the following:
- The Open Google Cloud console button
- Time remaining
- The temporary credentials that you must use for this lab
- Other information, if needed, to step through this lab
-
Click Open Google Cloud console (or right-click and select Open Link in Incognito Window if you are running the Chrome browser).
The lab spins up resources, and then opens another tab that shows the Sign in page.
Tip: Arrange the tabs in separate windows, side-by-side.
Note: If you see the Choose an account dialog, click Use Another Account. -
If necessary, copy the Username below and paste it into the Sign in dialog.
{{{user_0.username | "Username"}}} You can also find the Username in the Lab Details panel.
-
Click Next.
-
Copy the Password below and paste it into the Welcome dialog.
{{{user_0.password | "Password"}}} You can also find the Password in the Lab Details panel.
-
Click Next.
Important: You must use the credentials the lab provides you. Do not use your Google Cloud account credentials. Note: Using your own Google Cloud account for this lab may incur extra charges. -
Click through the subsequent pages:
- Accept the terms and conditions.
- Do not add recovery options or two-factor authentication (because this is a temporary account).
- Do not sign up for free trials.
After a few moments, the Google Cloud console opens in this tab.

Activate Cloud Shell
Cloud Shell is a virtual machine that is loaded with development tools. It offers a persistent 5GB home directory and runs on the Google Cloud. Cloud Shell provides command-line access to your Google Cloud resources.
- Click Activate Cloud Shell
at the top of the Google Cloud console.
When you are connected, you are already authenticated, and the project is set to your Project_ID,
gcloud is the command-line tool for Google Cloud. It comes pre-installed on Cloud Shell and supports tab-completion.
- (Optional) You can list the active account name with this command:
- Click Authorize.
Output:
- (Optional) You can list the project ID with this command:
Output:
gcloud, in Google Cloud, refer to the gcloud CLI overview guide.
Task 1. Deploy GKE cluster
- Deploy a basic GKE cluster to setup lab:
Task 2. Deploy managed collection
Configure a PodMonitoring resource
The following manifest defines a PodMonitoring resource, prom-example, in the gmp-test namespace. The resource uses a Kubernetes label selector to find all pods in the namespace that have the label app with the value prom-example. The matching pods are scraped on a port named metrics, every 30 seconds, on the /metrics HTTP path.
- To apply this resource, run the following command:
Your managed collector is now scraping the matching pods.
Deploy the example application
The managed service provides a manifest for an example application that emits Prometheus metrics on its metrics port. The application uses three replicas.
- To deploy the example application, run the following command:
Task 3. Cloud Monitoring
To view your Managed Service for Prometheus data as Cloud Monitoring time series, use Metrics Explorer. To configure Metrics Explorer to display metrics, do the following:
- From the Cloud console, go to Monitoring.
- In the Monitoring navigation pane, click
Metrics Explorer.
- Specify the data to appear on the chart. You can use the MQL tab or the Configuration tab.
-
To use the MQL tab, do the following:
a. Select the MQL tab.
b. Enter the following query:
fetch prometheus_target::prometheus.googleapis.com/up/gauge c. Click Run Query.
-
To use the Configuration tab, do the following:
a. Select the Configuration tab.
b. In the Metric field, deselect Active and then type "up/" to filter the list, then select Prometheus Target > Up > prometheus/up/gauge.
c. Then select Apply.
-
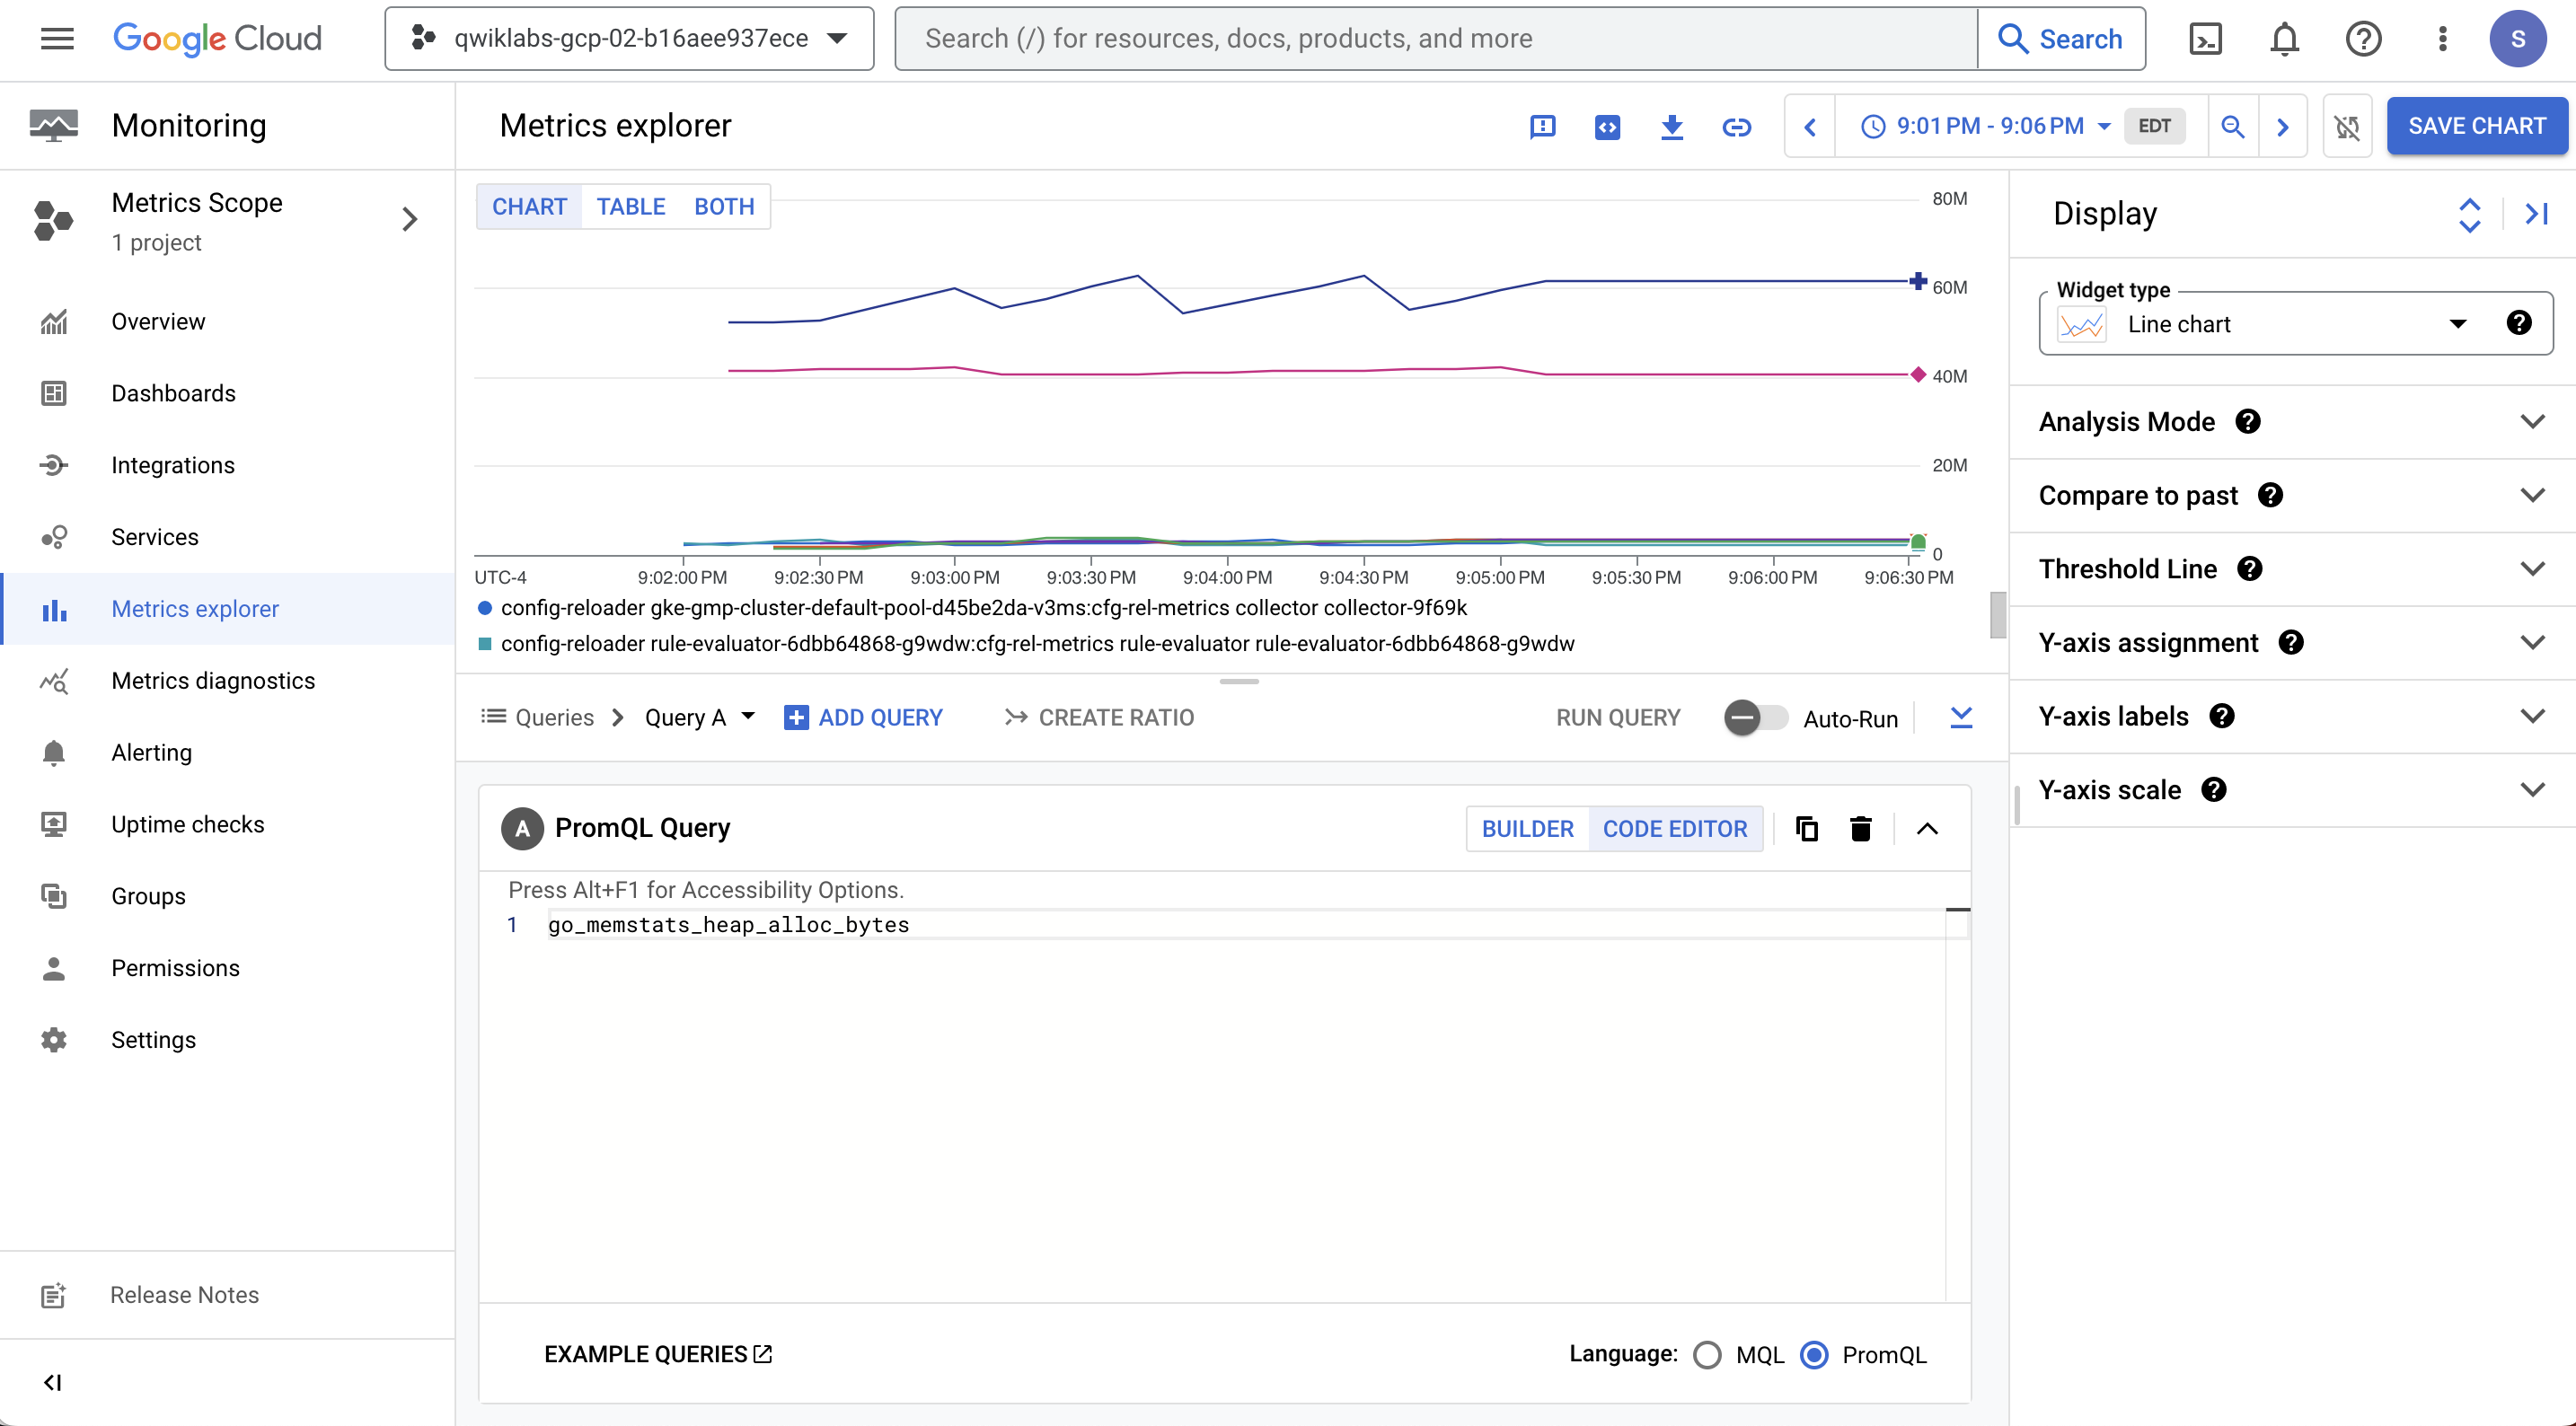
Task 4. Populate a Graph
-
Go to Monitoring > Metrix Explorer and select Code Editor.
-
Choose the syntax mode
PromQLand run the query below by clicking Run Query to see metrics:
This will populate a graph similar to the image below when selected.
Task 5. Filter exported metrics
If you collect a lot of data, you might want to prevent some time series from being sent to Managed Service for Prometheus to keep costs down.
To filter exported metrics, you can configure a set of PromQL series selectors in the OperatorConfig resource. A time series is exported to Managed Service for Prometheus if it satisfies at least one of the selectors.
- Open the
OperatorConfigresource for editing:
- After the apiVersion line, press "i" to go into insert mode. Go to the final line and press enter to go to a new line. Ensure there are no indents at the beginning of the line. Then paste the following:
The file should look like the following:
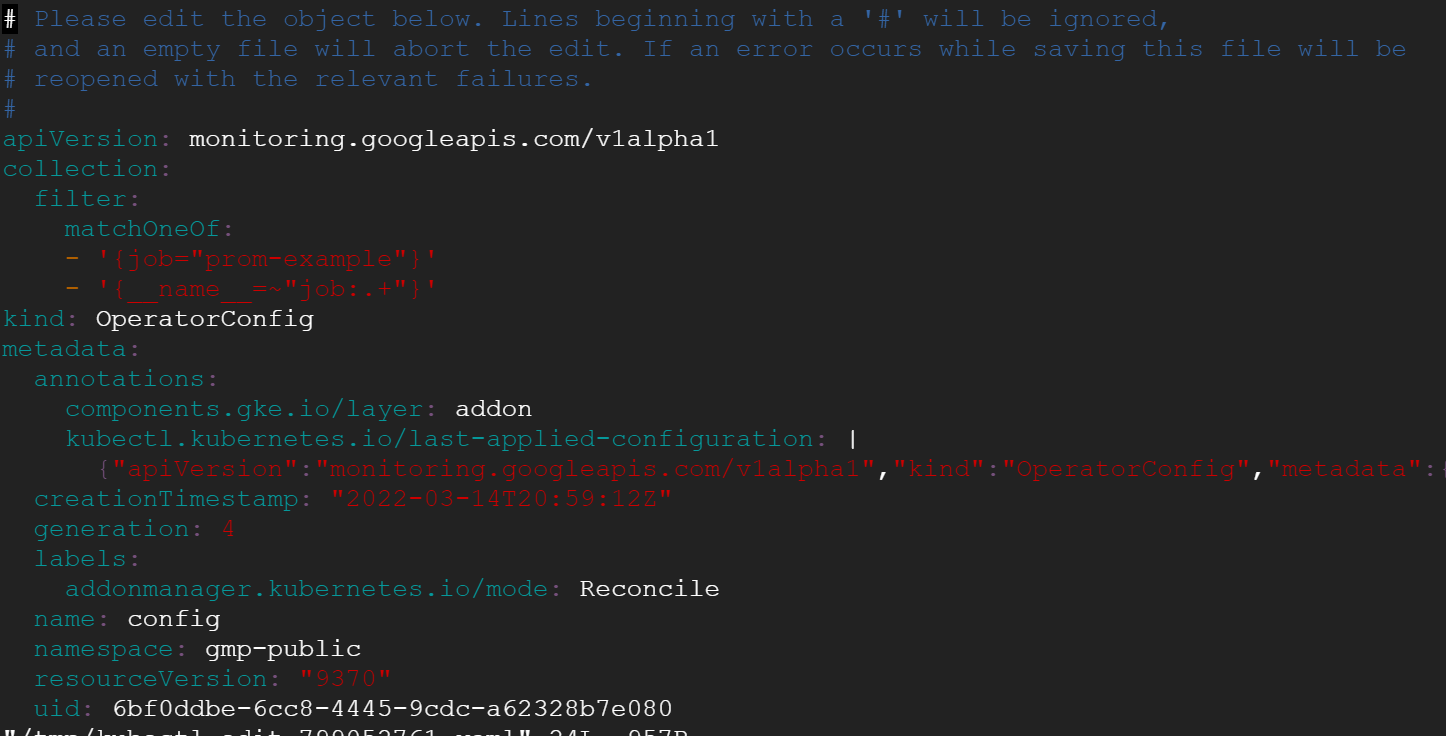
- To save the file and exit press "Esc" then type ":wq" then enter.
This addition causes only metrics for the "prometheus" job as well as metrics produced by recording rules that aggregate to the job level—when following naming best practices—to be exported. Samples for all other time series are filtered out. By default, no selectors are specified and all time series are exported.
The filter.matchOneOf configuration section has the same semantics as the match[] parameters for Prometheus federation.
- Create a
config.yamlfile:
- Copy the following into the
config.yamlfile:
- Upload the config file you created to verify:
Task 6. Run the query
- Go back to the PromQL Query editor. In the top search type "Managed Prometheus" and run the query "up" and select RUN QUERY.
Task 7. Monitor the app
- Increase the scrape interval for the PodMonitoring resource created to monitor the example app:
-
Change the interval in the file to 60s from 30s then save file. Press "Esc" then type ":wq" then enter.
-
Create a prom-example-config.yaml file you created to verify:
- Copy the following into the file:
- Run the below commands in the cloud shell.
This completes the lab.
Congratulations
You have learned how to reduce the costs associated with using the Managed Service for Prometheus. You deployed prometheus and an example application. Then, you applied a metrics filter and changed the scraping interval to reduce the costs associated with ingesting metrics using the Google Managed Prometheus service.
Next steps / Learn more
- You can read more about Google Cloud Managed Service for Prometheus.
Google Cloud training and certification
...helps you make the most of Google Cloud technologies. Our classes include technical skills and best practices to help you get up to speed quickly and continue your learning journey. We offer fundamental to advanced level training, with on-demand, live, and virtual options to suit your busy schedule. Certifications help you validate and prove your skill and expertise in Google Cloud technologies.
Manual Last Updated: April 18, 2024
Lab Last Tested: October 23, 2023
Copyright 2024 Google LLC All rights reserved. Google and the Google logo are trademarks of Google LLC. All other company and product names may be trademarks of the respective companies with which they are associated.