GSP939

Overview
Cloud Error Reporting automatically groups application errors based on stack trace message patterns and shows the frequency of each error group. When investigating an error group, SREs can pinpoint the exact line of code where the error occurred and navigate to the relevant source code.
In this lab, you explore leveraging Cloud Error Reporting to understand the error reports of an application and application issues.
Objectives
In this lab, you learn how to:
- Explore Cloud Error Reporting error group reports to view details about errors.
- Understand how to view errors and service errors.
- Change the resolution status of a noticed error.
- Link Errors to an issue tracker to triage to development teams.
Prerequisites
Familiarity with SRE principles and Cloud Operations tools made available by Google
Cloud Platform
Setup and requirements
Before you click the Start Lab button
Read these instructions. Labs are timed and you cannot pause them. The timer, which starts when you click Start Lab, shows how long Google Cloud resources are made available to you.
This hands-on lab lets you do the lab activities in a real cloud environment, not in a simulation or demo environment. It does so by giving you new, temporary credentials you use to sign in and access Google Cloud for the duration of the lab.
To complete this lab, you need:
- Access to a standard internet browser (Chrome browser recommended).
Note: Use an Incognito (recommended) or private browser window to run this lab. This prevents conflicts between your personal account and the student account, which may cause extra charges incurred to your personal account.
- Time to complete the lab—remember, once you start, you cannot pause a lab.
Note: Use only the student account for this lab. If you use a different Google Cloud account, you may incur charges to that account.
How to start your lab and sign in to the Google Cloud console
-
Click the Start Lab button. If you need to pay for the lab, a dialog opens for you to select your payment method.
On the left is the Lab Details pane with the following:
- The Open Google Cloud console button
- Time remaining
- The temporary credentials that you must use for this lab
- Other information, if needed, to step through this lab
-
Click Open Google Cloud console (or right-click and select Open Link in Incognito Window if you are running the Chrome browser).
The lab spins up resources, and then opens another tab that shows the Sign in page.
Tip: Arrange the tabs in separate windows, side-by-side.
Note: If you see the Choose an account dialog, click Use Another Account.
-
If necessary, copy the Username below and paste it into the Sign in dialog.
{{{user_0.username | "Username"}}}
You can also find the Username in the Lab Details pane.
-
Click Next.
-
Copy the Password below and paste it into the Welcome dialog.
{{{user_0.password | "Password"}}}
You can also find the Password in the Lab Details pane.
-
Click Next.
Important: You must use the credentials the lab provides you. Do not use your Google Cloud account credentials.
Note: Using your own Google Cloud account for this lab may incur extra charges.
-
Click through the subsequent pages:
- Accept the terms and conditions.
- Do not add recovery options or two-factor authentication (because this is a temporary account).
- Do not sign up for free trials.
After a few moments, the Google Cloud console opens in this tab.
Note: To access Google Cloud products and services, click the Navigation menu or type the service or product name in the Search field.

Activate Cloud Shell
Cloud Shell is a virtual machine that is loaded with development tools. It offers a persistent 5GB home directory and runs on the Google Cloud. Cloud Shell provides command-line access to your Google Cloud resources.
-
Click Activate Cloud Shell  at the top of the Google Cloud console.
-
Click through the following windows:
- Continue through the Cloud Shell information window.
- Authorize Cloud Shell to use your credentials to make Google Cloud API calls.
When you are connected, you are already authenticated, and the project is set to your Project_ID, . The output contains a line that declares the Project_ID for this session:
Your Cloud Platform project in this session is set to {{{project_0.project_id | "PROJECT_ID"}}}
gcloud is the command-line tool for Google Cloud. It comes pre-installed on Cloud Shell and supports tab-completion.
- (Optional) You can list the active account name with this command:
gcloud auth list
- Click Authorize.
Output:
ACTIVE: *
ACCOUNT: {{{user_0.username | "ACCOUNT"}}}
To set the active account, run:
$ gcloud config set account `ACCOUNT`
- (Optional) You can list the project ID with this command:
gcloud config list project
Output:
[core]
project = {{{project_0.project_id | "PROJECT_ID"}}}
Note: For full documentation of gcloud, in Google Cloud, refer to the gcloud CLI overview guide.
Error Reporting overview
Cloud Error Reporting (documentation) automatically groups errors depending on stack trace message patterns and shows the frequency of each error group. The error groups are generated automatically, based on stack traces.
When investigating an error group, operators can pinpoint the exact line of code where the error occurred and understand the cause by navigating to the relevant source code.
Task 1. Using Error Reporting
- You can access Error Reporting by selecting Error Reporting from the Google Cloud navigation menu (
 ).
).
Note: Please wait for few minutes to see the errors in the Error field. Error Reporting can also let you know when new errors are received; for more information, refer to Notifications for Error Reporting.
- To get started, select any open error by clicking on the error in the Error field:
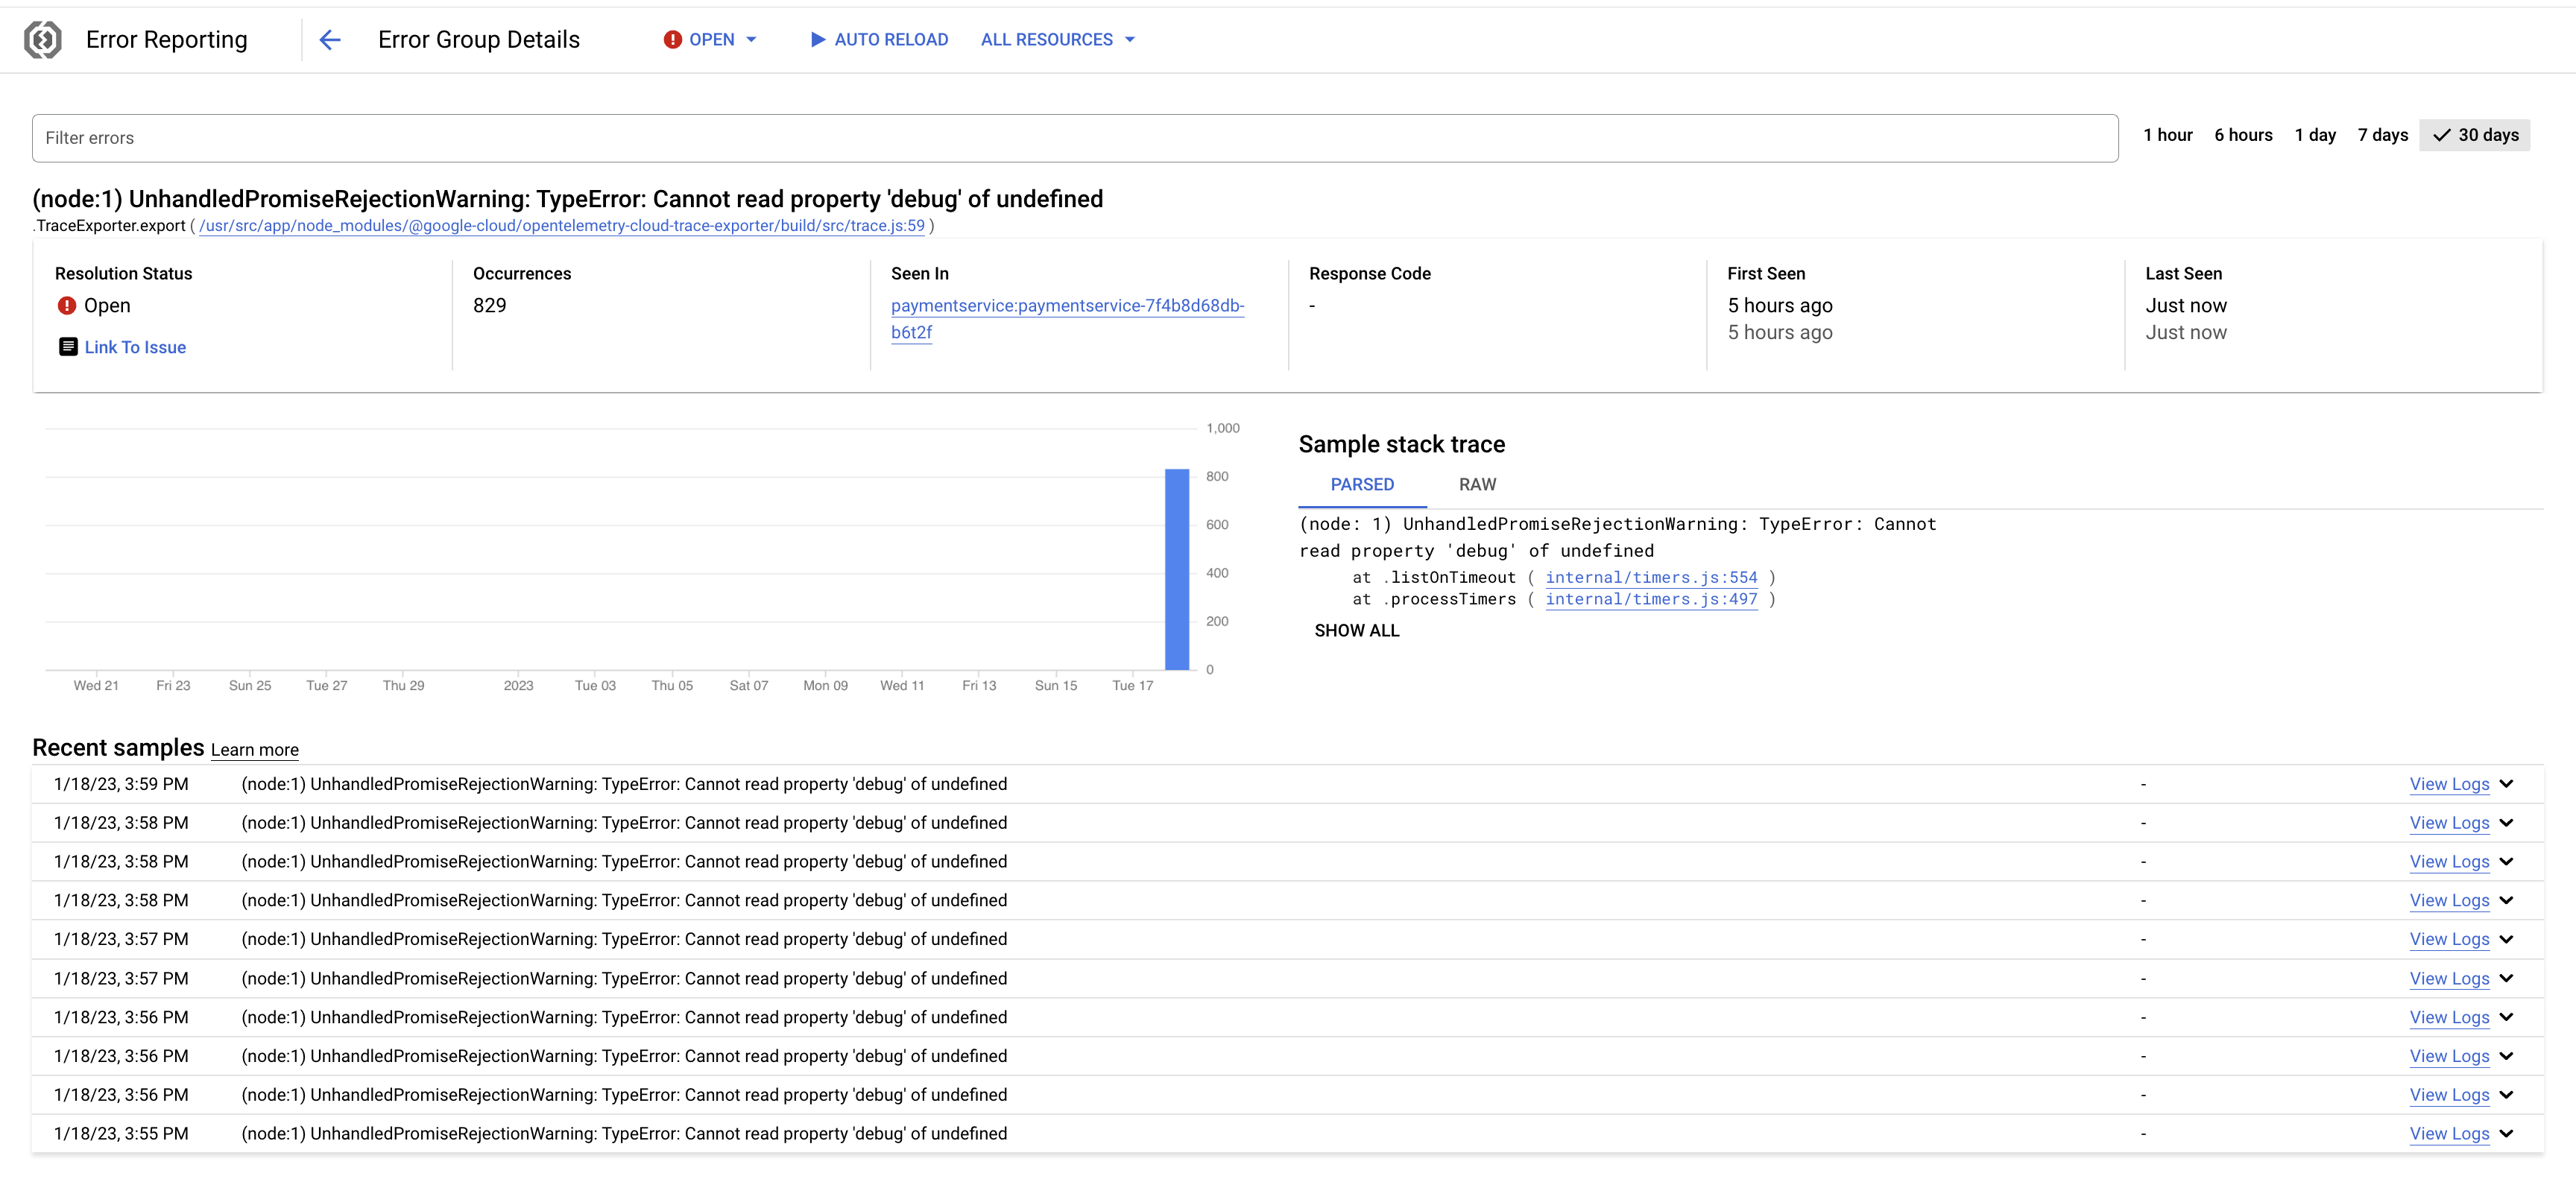
The Error Group Details screen shows you when the error has been occurring in the timeline and provides the stack trace that was captured with the error.
- Scroll down to see samples of the error:
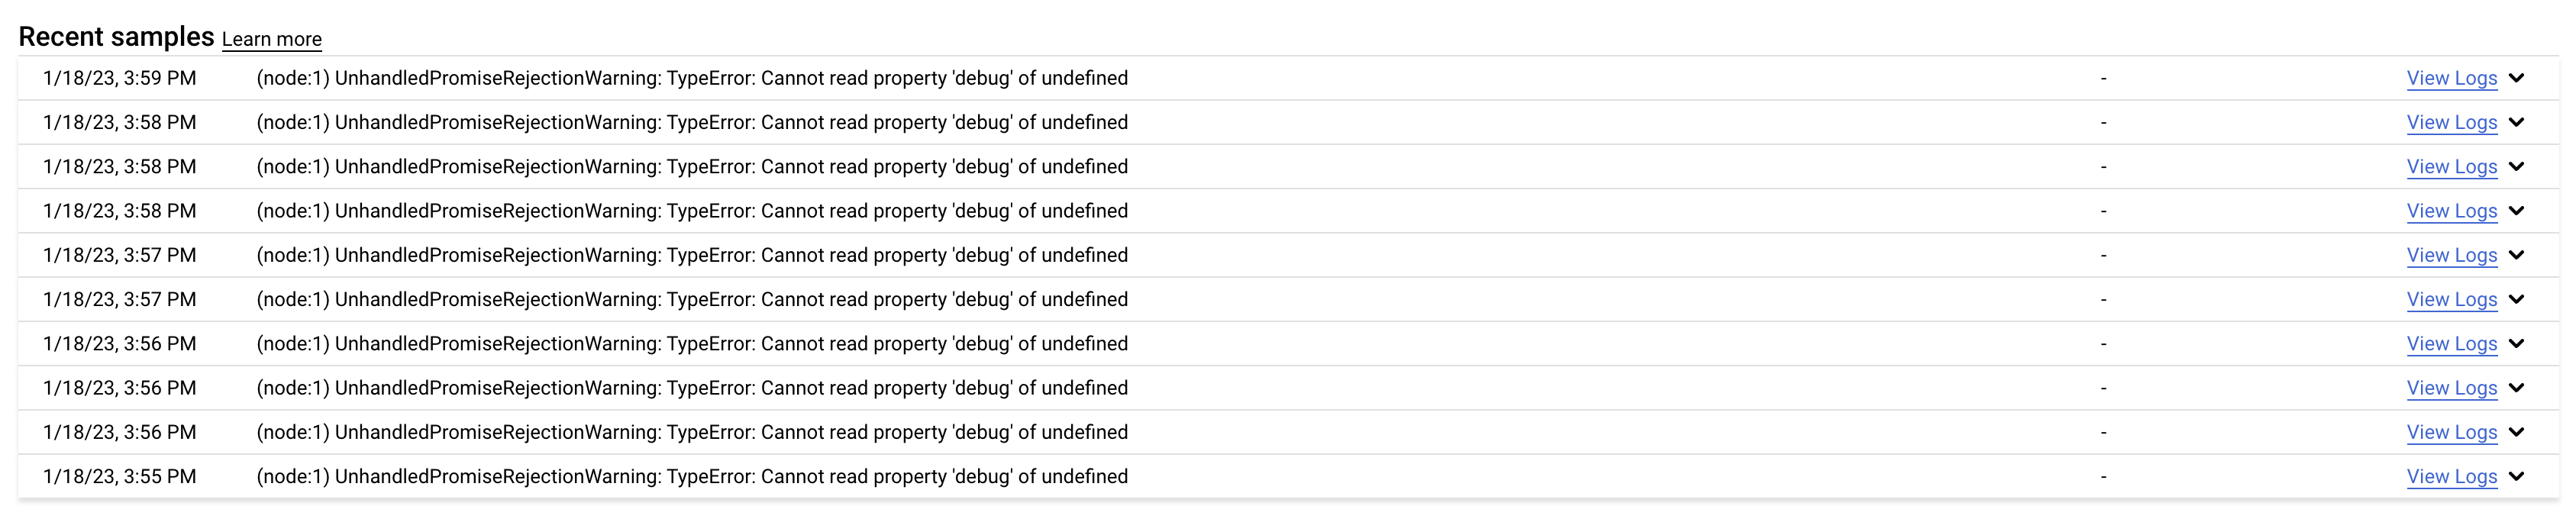
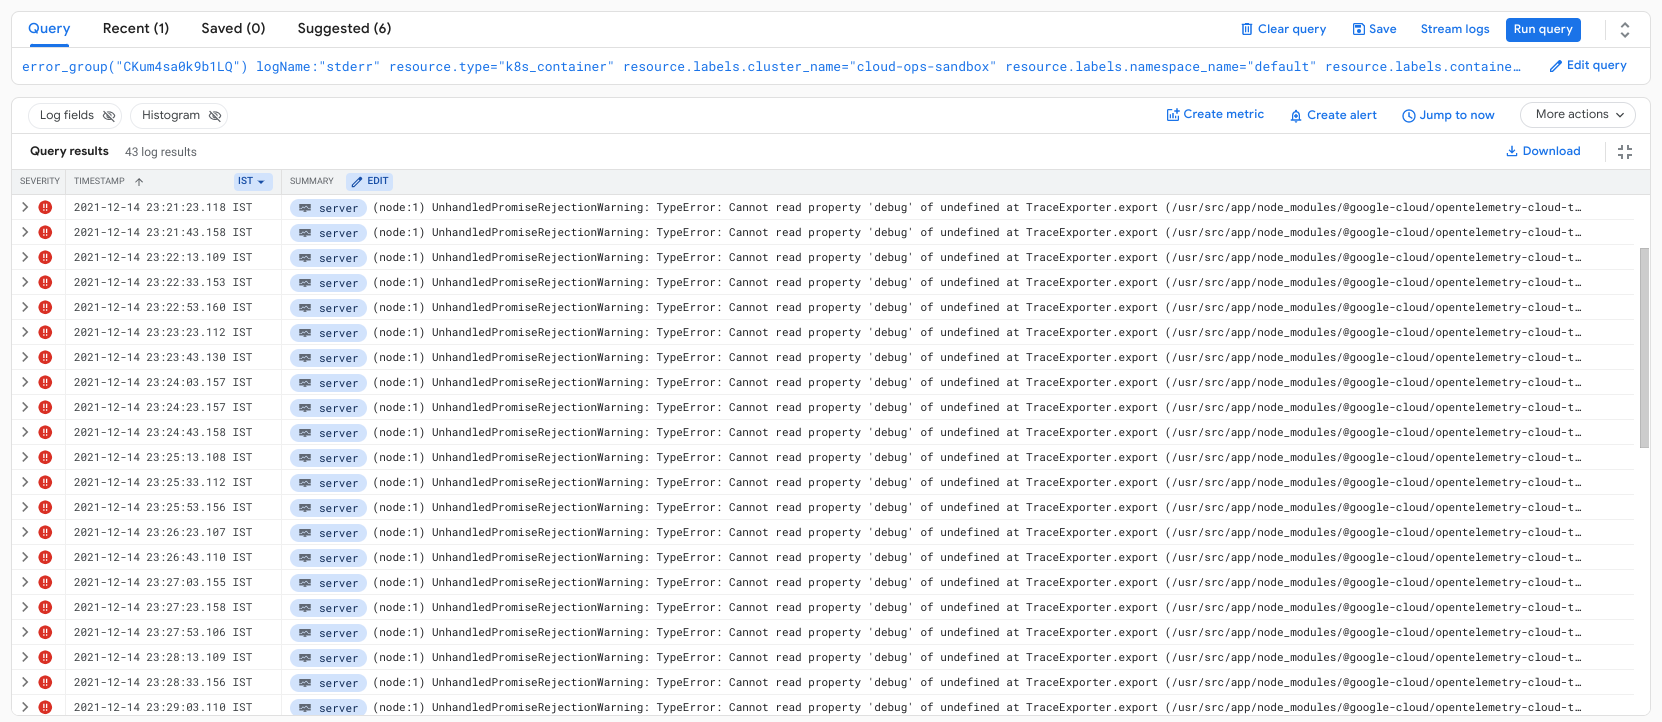
- Open View Logs in another tab for one of the samples to see the log messages that match this particular error:
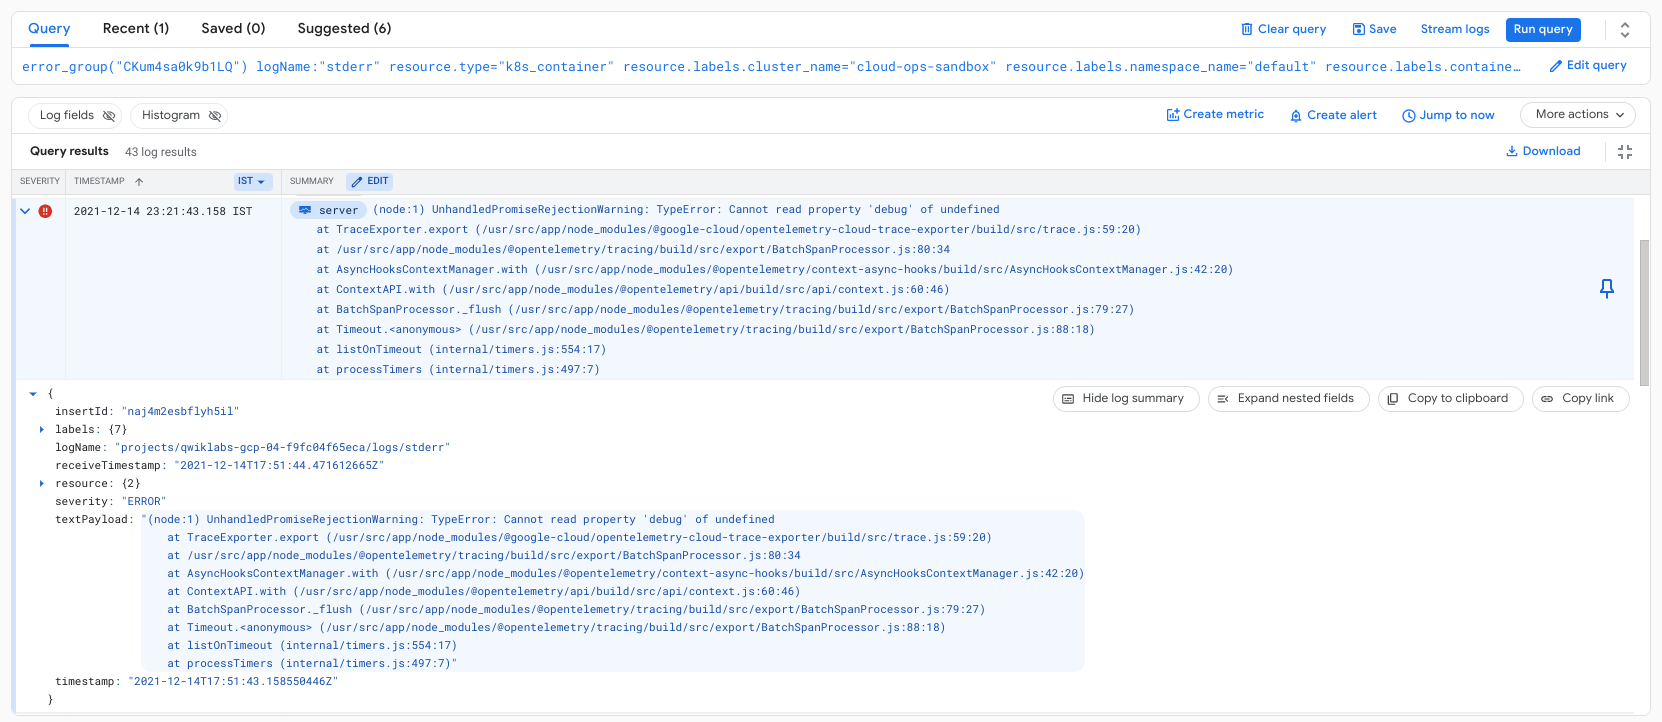
- You can expand any of the messages that matches the filter to see the full stack trace:
- Navigate back to Error reporting page, from the topbar click on the Open dropdown and select Acknowledged to change the resolution status of the error group manually.

Check if Error group was marked as Acknowledged
When you acknowledge an error group you can add a url to your issue tracker. Then you can go directly to your issue tracker from the error group.
- Click on Link to issue and enter the following as a sample issue tracker url:
https://my-issue-tracker.com/my-first-issue
Check if linked to issue tracker
Congratulations!
In this lab, you explored Cloud Error Reporting error group reports to view details about errors,
understand how to view errors and service errors, change the resolution status of a noticed error, link Errors to an issue tracker to triage to development teams.
Finish your quest
This self-paced lab is part of the Cloud Architecture, and DevOps Essentials quests. A quest is a series of related labs that form a learning path. Completing a quest earns you a badge to recognize your achievement. You can make your badge or badges public and link to them in your online resume or social media account. Enroll in any quest that contains this lab and get immediate completion credit. Refer to the Google Cloud Skills Boost catalog for all available quests.
Take your next lab
Continue your quest with Cloud Logging on Kubernetes Engine, or check out these suggestions:
Next steps
Google Cloud training and certification
...helps you make the most of Google Cloud technologies. Our classes include technical skills and best practices to help you get up to speed quickly and continue your learning journey. We offer fundamental to advanced level training, with on-demand, live, and virtual options to suit your busy schedule. Certifications help you validate and prove your skill and expertise in Google Cloud technologies.
End your lab
When you have completed your lab, click End Lab. Your account and the resources you've used are removed from the lab platform.
You will be given an opportunity to rate the lab experience. Select the applicable number of stars, type a comment, and then click Submit.
The number of stars indicates the following:
- 1 star = Very dissatisfied
- 2 stars = Dissatisfied
- 3 stars = Neutral
- 4 stars = Satisfied
- 5 stars = Very satisfied
You can close the dialog box if you don't want to provide feedback.
For feedback, suggestions, or corrections, please use the Support tab.
Manual Last Updated: May 08, 2024
Lab Last Tested: May 08, 2024
Copyright 2025 Google LLC. All rights reserved. Google and the Google logo are trademarks of Google LLC. All other company and product names may be trademarks of the respective companies with which they are associated.


