Checkpoints
Create a dimension to identify users associated with email traffic
/ 10
Create a numeric dimension from a date difference calculation
/ 10
Create a tiered dimension for age groups
/ 10
Create a filtered measure for the total revenue for email users
/ 10
Create a measure for the percentage of revenue attributed to email users
/ 10
Creating Dimensions and Measures with LookML
- Overview
- Setup
- Task 1. Create a new dimension to identify users associated with email traffic
- Task 2. Create a new dimension for the number of days since users joined the website
- Task 3. Create a new tiered dimension for age groups
- Task 4. Create a new filtered measure for the total revenue for email users
- Task 5. Create a new measure for the percentage of revenue attributed to email users
- End your lab
Overview
Looker is a modern data platform in Google Cloud that lets business users analyze and visualize data interactively. LookML developers curate the data used by business users by creating new fields, tables, and views to customize and organize data.
In Looker, each dimension defines a unique attribute of the data; for example, a customer dataset may have different dimensions for user cities and user ages. These dimensions are used to organize and describe the data within the dataset. Measures are aggregations, such as a count or an average, of the data in one or more dimensions. Measures allow calculations about key performance indicators (KPIs) and help business users analyze data using different aggregated attributes.
In this lab, you learn how to create different types of dimensions and measures in LookML as a Looker developer. You also learn how to modify how data is modeled in Explores, which are data views that serve as the foundation for self-service exploration by the business users in Looker.
For this lab, a project called qwiklabs-ecommerce has been created for you in LookML. This project is based on a mock ecommerce dataset containing information on orders, products, and users. As the LookML developer for this project, your goal is to create new dimensions and measures that will enable business users to easily identify and analyze attributes for customers associated with email as the traffic source, such as the breakdown of these users by number of days since signup and the total percentage of revenue attributed to these users.
You can learn more about LookML modeling in the Write LookML section of the Looker documentation.
Objectives
In this lab, you will practice creating dimensions and measures in LookML and learn about the different data types that LookML supports.
-
Modify an existing LookML project (qwiklabs-ecommerce) published by a Looker admin.
-
Create different types of dimensions and measures in LookML to address business users' questions.
-
Test your LookML changes in development mode.
-
Use the Explore interface to view the dimensions and measures that you have created in the modified LookML project.
-
Send LookML changes from a development branch to production.
Setup
For each lab, you get a new project and set of resources for a fixed time at no cost.
-
Make sure you have signed into Qwiklabs using an incognito window.
-
Note the lab's access time (for example, 2:00:00 hrs) and make sure you can finish in that time block.
- When ready, click
.
A new panel will appear with the temporary credentials that you must use for this lab.
If you need to pay for the lab, a pop-up will open for you to select your payment method.
- Note your lab credentials. You will use them to sign in to the Looker instance for this lab.
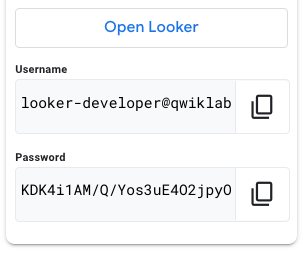
- Click Open Looker.
- Enter the provided username and password.
- Click Log In.
After a successful login, you will see the Looker instance for this lab.
- On the bottom left of the Looker User Interface, click the toggle button to enter Development mode.

Task 1. Create a new dimension to identify users associated with email traffic
Using LookML, you can create different dimensions to analyze key performance indicators (KPIs) using dimension types such as tier, time, numeric, yesno, and string to slice and dice your data.
In this first task, you create a new yesno dimension named is_email_source that determines whether the traffic source that brought in a given user was "Email". With this new dimension, each user is assigned a value of "Yes" or "No", depending on whether the user is associated with email as the traffic source.
Create a new yesno dimension
-
If it is not already enabled, enable development mode. On the bottom left of the Looker User Interface, click the toggle button to enter Development mode.
-
On the left side navigation menu of the Looker User Interface, click Develop.
-
Under Projects, click on qwiklabs-ecommerce.
-
Click the arrow next to views to see a list of view names.
-
Click users.view.
-
In users.view, locate the dimension for traffic_source.
-
On a new line under the dimension for traffic source, define a new dimension for is_email_source using the following code:
-
Click Save Changes.
Test the new yesno dimension
-
Open a new Looker window in a new tab.
-
On the left side navigation menu of the Looker User Interface, click Explore.
-
Under E-Commerce Training, click Order Items.
-
Click the arrow next to Users.
The available dimensions and measures will be listed in the data panel for Users.
-
Under Users > Dimensions, click Is Email Source (Yes / No).
-
Under Users > Measures, click Count.
-
Click Run to see the count of users by email association.
-
Close the browser tab that you opened in step 1 to review the Explore.
Send LookML changes from development branch to production
-
Navigate back to the users.view file.
-
Click Validate LookML.
-
Then click Commit Changes & Push.
-
In the Commit window, add a message to specify the changes you made.
-
Click Commit.
-
Click Deploy to Production.
Click Check my progress to verify the objective.
Task 2. Create a new dimension for the number of days since users joined the website
With LookML, you can also create numeric dimensions that store the results of date difference calculations. In this task, you create a new numeric dimension named days_since_signup that calculates the number of days between the current date and the created date for a user (i.e., the number of days since the user signed up).
This dimension can be combined with the yesno dimension identifying email users to analyze the longevity of email users.
Create a new numeric dimension from a date difference calculation
-
On the left side navigation menu of the Looker User Interface, click Develop.
-
Under Projects, click on qwiklabs-ecommerce.
-
Click the arrow next to views to see a list of view names.
-
Click users.view.
-
In users.view, locate the dimension group for created.
-
On a new line under the dimension group for created, define a new dimension for days_since_signup using the following code:
-
Click Save Changes.
Test the new numeric dimension from the date difference calculation
-
Open a new Looker window in a new tab.
-
On the left side navigation menu of the Looker User Interface, click Explore.
-
Under E-Commerce Training, click Order Items.
-
Click the arrow next to Users.
The available dimensions and measures will be listed in the data panel for Users.
-
Under Users > Dimensions, click Is Email Source (Yes / No).
-
Under Users > Dimensions, click Days Since Signup.
-
Under Users > Measure, click Count.
-
Click Run to see the count of users by email association and days since signup.
-
In the query results, click on the Days Since Signup column name to sort the rows.
You can click on the column name again to change the sort order.
-
Close the browser tab that you opened in step 1 to review the Explore.
Send LookML changes from development branch to production
-
Navigate back to the users.view file.
-
Click Validate LookML.
-
Then click Commit Changes & Push.
-
In the Commit window, add a message to specify the changes you made.
-
Click Commit.
-
Click Deploy to Production.
Click Check my progress to verify the objective.
Task 3. Create a new tiered dimension for age groups
LookML also supports the creation of tiered dimensions that group data into specified bins. In this task, you create a new dimension named age_tier that groups individuals' ages into the following age group tiers, so that business users can analyze customer data by age group: 18, 25, 35, 45, 55, 65, 75, 90.
This age tier dimension can be combined with the yesno dimension identifying email users to produce a breakdown of email users by age tier.
Create a new tiered dimension
-
On the left side navigation menu of the Looker User Interface, click Develop.
-
Under Projects, click on qwiklabs-ecommerce.
-
Click the arrow next to views to see a list of view names.
-
Click users.view.
-
In users.view, locate the dimension for age.
-
On a new line under the dimension for age, define a new dimension for age_tier using the following code:
-
Click Save Changes.
Test the new tiered dimension
-
Open a new Looker window in a new tab.
-
On the left side navigation menu of the Looker User Interface, click Explore.
-
Under E-Commerce Training, click Order Items.
-
Click the arrow next to Users.
The available dimensions and measures will be listed in the data panel for Users.
-
Under Users > Dimensions, click Is Email Source (Yes / No).
-
Under Users > Dimensions, click Age Tier.
-
Under Users > Measure, click Count.
-
Click Run to see the count of users by age tier and email association.
-
Close the browser tab that you opened in step 1 to review the Explore.
Send LookML changes from development branch to production
-
Navigate back to the users.view file.
-
Click Validate LookML.
-
Then click Commit Changes & Push.
-
In the Commit window, add a message to specify the changes you made.
-
Click Commit.
-
Click Deploy to Production.
Click Check my progress to verify the objective.
Task 4. Create a new filtered measure for the total revenue for email users
Using LookML, you can define new measures to aggregate dimensions and calculate values such as count, average, or sum. You can also filter these measures to calculate aggregations based on a subselection of the data.
The qwiklabs-ecommerce project already contains a sum measure named total_revenue in the order_items view. In this task, you will create a new filtered measure named total_revenue_email_users that uses LookML code similar to total__revenue, but also includes a filter to calculate the total revenue for only those users who came to the website via the email traffic source.
Create a new filtered measure
-
On the left side navigation menu of the Looker User Interface, click Develop.
-
Under Projects, click on qwiklabs-ecommerce.
-
Click the arrow next to views to see a list of view names.
-
Click order_items.view.
-
In order_items.view, locate the measure for total_revenue.
-
On a new line under the measure for total_revenue, define a new measure for total_revenue_email_users using the following code:
Notice that the code for the existing measure named total_revenue looks similar to the new measure named total_revenue_email_users, as they both calculate a sum of sale_price.
The difference is that the new measure named total_revenue_email_users includes a filters parameter to select only users with the value "Yes" for Is Email Source.
-
Click Save Changes.
Test the new filtered measure
-
Open a new Looker window in a new tab.
-
On the left side navigation menu of the Looker User Interface, click Explore.
-
Under E-Commerce Training, click Order Items.
-
Click the arrow next to Order Items.
The available dimensions and measures will be listed in the data panel for Order Items.
-
Under Order Items > Measures, click Total Revenue.
-
Under Order Items > Measures, click Total Revenue Email Users.
-
Click Run to see the total revenue and total revenue from email users.
-
Close the browser tab that you opened in step 1 to review the Explore.
Send LookML changes from development branch to production
-
Navigate back to the order_items.view file.
-
Click Validate LookML.
-
Then click Commit Changes & Push.
-
In the Commit window, add a message to specify the changes you made.
-
Click Commit.
-
Click Deploy to Production.
Click Check my progress to verify the objective.
Task 5. Create a new measure for the percentage of revenue attributed to email users
In this final task, you create a new measure named percent_revenue_email_source that calculates the percentage of revenue attributed to users coming from the email traffic source.
Create a new percentage measure
-
On the left side navigation menu of the Looker User Interface, click Develop.
-
Under Projects, click on qwiklabs-ecommerce.
-
Click the arrow next to views to see a list of view names.
-
Click order_items.view.
-
In order_items.view, locate the measure for total_revenue_email_users.
-
On a new line under the measure for total_revenue_email_users, define a new measure for percent_revenue_email_source using the following code:
-
Click Save Changes.
Test the new percentage measure
-
Open a new Looker window in a new tab.
-
On the left side navigation menu of the Looker User Interface, click Explore.
-
Under E-Commerce Training, click Order Items.
-
Click the arrow next to Order Items.
The available dimensions and measures will be listed in the data panel for Order Items.
-
Under Order Items > Measures, click Total Revenue.
-
Under Order Items > Measures, click Total Revenue Email Users.
-
Under Order Items > Measures, click Percent Revenue Email Source.
-
Click Run to see the total revenue, total revenue from email users, and the percentage of revenue from the email source.
-
Close the browser tab that you opened in step 1 to review the Explore.
Send LookML changes from development branch to production
-
Navigate back to the order_items.view file.
-
Click Validate LookML.
-
Then click Commit Changes & Push.
-
In the Commit window, add a message to specify the changes you made.
-
Click Commit.
-
Click Deploy to Production.
Click Check my progress to verify the objective.
End your lab
When you have completed your lab, click End Lab. Google Cloud Skills Boost removes the resources you’ve used and cleans the account for you.
You will be given an opportunity to rate the lab experience. Select the applicable number of stars, type a comment, and then click Submit.
The number of stars indicates the following:
- 1 star = Very dissatisfied
- 2 stars = Dissatisfied
- 3 stars = Neutral
- 4 stars = Satisfied
- 5 stars = Very satisfied
You can close the dialog box if you don't want to provide feedback.
For feedback, suggestions, or corrections, please use the Support tab.
Copyright 2022 Google LLC All rights reserved. Google and the Google logo are trademarks of Google LLC. All other company and product names may be trademarks of the respective companies with which they are associated.