Checkpoints
Create an incremental persistent derived table
/ 40
Create an aggregate table
/ 30
Join the minimal amount of views new Explores
/ 30
Optimizing Performance of LookML Queries
- GSP985
- Overview
- Setup
- Key recommendations for optimizing query performance
- Task 1. Create an incremental persistent derived table that will auto-update without rebuilding the entire table
- Task 2. Create an incremental aggregate table to summarize order data across multiple time periods
- Task 3. Join views in a performant manner to optimize Explore queries
- Task 4. Monitor the builds of persistent derived tables in a Looker instance
- Congratulations!
GSP985

Overview
Looker is a modern data platform in Google Cloud that you can use to analyze and visualize your data interactively. You can use Looker to do in-depth data analysis, integrate insights across different data sources, build actionable data-driven workflows, and create custom data applications.
Big, complex queries can be costly, and running them repeatedly strains your database, thereby reducing performance. Ideally, you want to avoid re-running massive queries if nothing has changed, and instead, append new data to existing results to reduce repetitive requests. Although there are many ways to optimize performance of LookML queries, this lab focuses on the most commonly used methods to optimize query performance in Looker: persistent derived tables, aggregate awareness, and performantly joining views.
Objectives
In this lab, you will:
- Understand when and how to add persistence and incremental updates to derived tables.
- Use aggregate awareness to optimize queries on rolled up or summarized data.
- Create a refinement of an existing Explore.
- Join views in a performant manner to optimize Explore queries.
- Monitor the builds of persistent derived tables in a Looker instance.
Setup
Before you click the Start Lab button
Read these instructions. Labs are timed and you cannot pause them. The timer, which starts when you click Start Lab, shows how long Google Cloud resources will be made available to you.
This hands-on lab lets you do the lab activities yourself in a real cloud environment, not in a simulation or demo environment. It does so by giving you new, temporary credentials that you use to sign in and access Google Cloud for the duration of the lab.
To complete this lab, you need:
- Access to a standard internet browser (Chrome browser recommended).
- Time to complete the lab---remember, once you start, you cannot pause a lab.
How to start your lab and sign in to Looker
-
When ready, click
.
A new panel will appear with the temporary credentials that you must use for this lab.
If you need to pay for the lab, a pop-up will open for you to select your payment method.
-
Note your lab credentials in the left pane. You will use them to sign in to the Looker instance for this lab.
Note: If you use other credentials, you will get errors or incur charges. -
Click Open Looker.
-
Enter the provided Username and Password in the Email and Password fields.
Important: You must use the credentials from the Connection Details panel on this page. Do not use your Google Cloud Skills Boost credentials. If you have your own Looker account, do not use it for this lab. -
Click Log In.
After a successful login, you will see the Looker instance for this lab.
Key recommendations for optimizing query performance
In this section, you learn about the commonly used methods for query performance optimization in Looker. In this lab, you get hands-on experience with the first three methods.
Persistent derived tables (PDTs)
The first solution is persistent derived tables, or PDTs. Looker allows you to write SQL and LookML queries to your database as a temporary table. When this table is cached or persisted, it's called a PDT. This allows you to repeatedly run complex or commonly used queries and cache the results for quick access.
By saving these queries as a table, you have control over when or how they are built. Tables can rebuild every morning, once a month, or only when new data is added. Ideally, you configure your derived tables to reflect the nature of your data.
Derived tables are useful for creating new structures or aggregations that are not already available in your underlying database tables, but not all derived tables need to be persisted to be useful. Persistence is commonly applied to complex queries that are costly to run or for queries that are used frequently by a large number of users or applications.
You can also create incremental PDTs to append new data without rebuilding the entire table. Applying incremental changes works well for large tables in which existing (older) data is not frequently updated because the primary update to the table is new records.
Aggregate awareness
For very large tables in your database, Looker's aggregate awareness can create smaller aggregate tables of data grouped by various combinations of attributes. The aggregate tables act as "rollups" or summary tables that Looker can use instead of the original large table for queries whenever possible. Aggregate awareness allows Looker to find the smallest, most efficient table available in your database to run a query while still maintaining accuracy. When implemented strategically, aggregate awareness can speed up the average query by orders of magnitude. Consider a table of online orders for a busy ecommerce store, which has new rows added every few seconds.
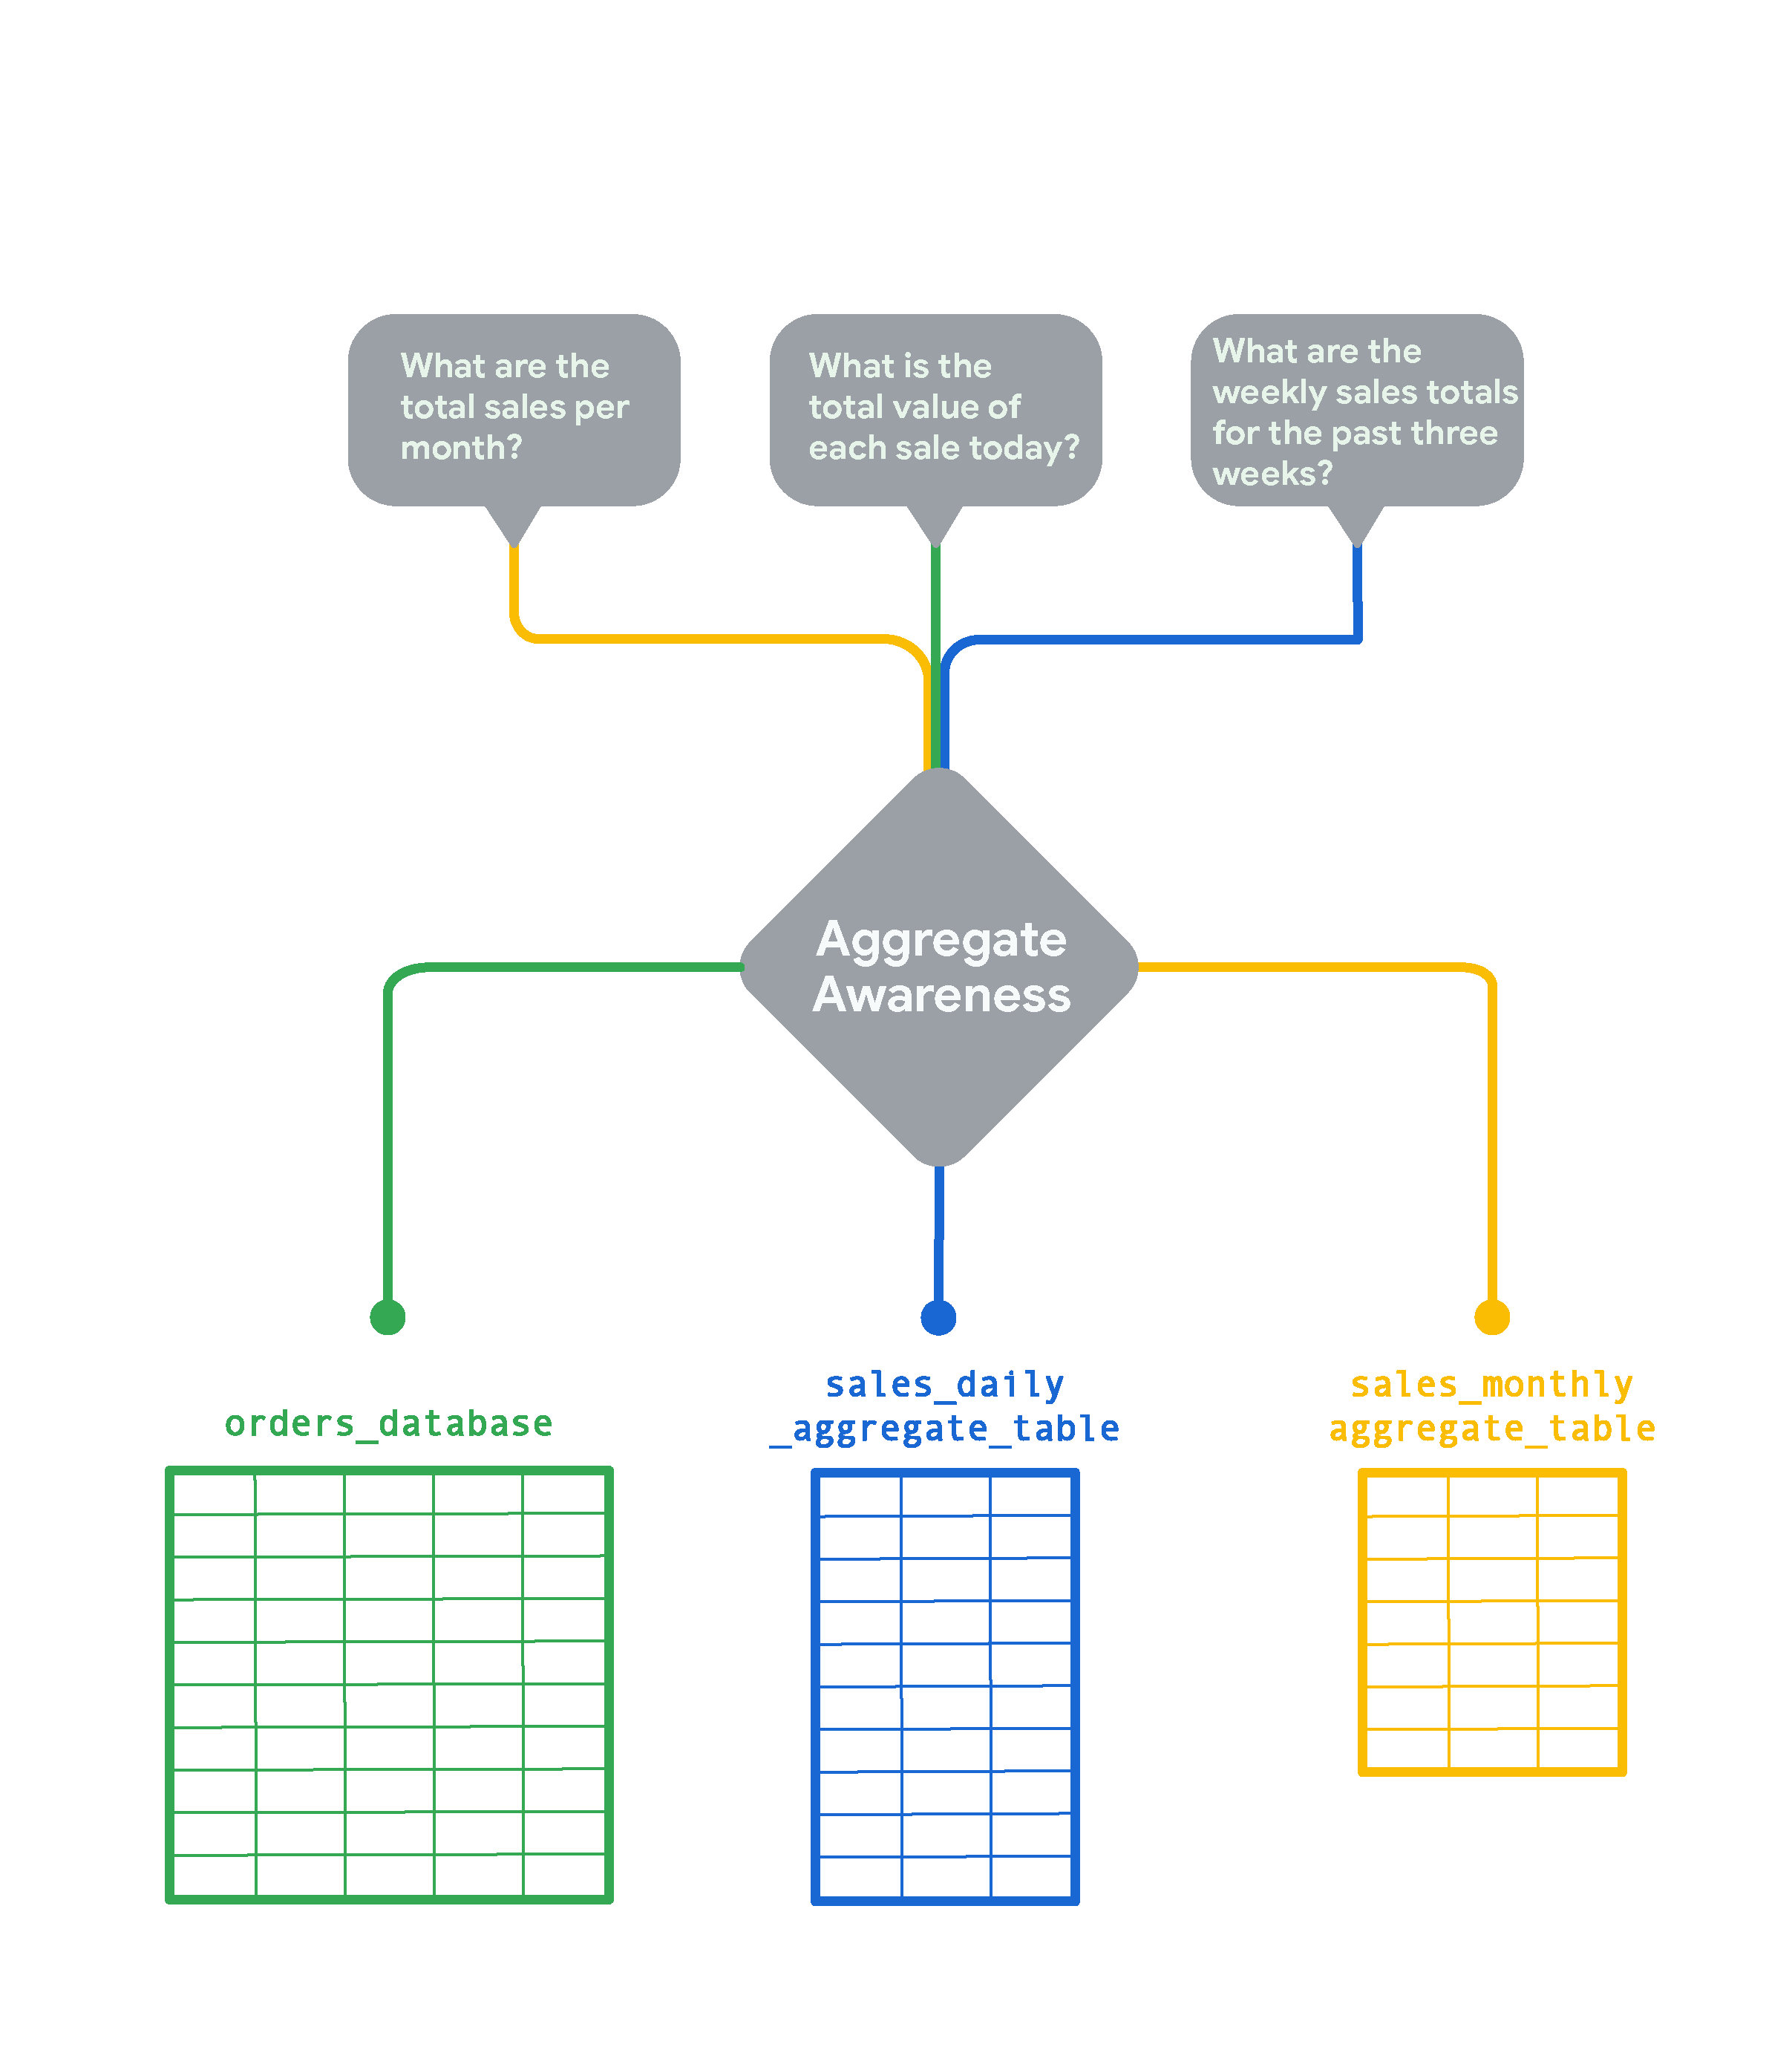
If you want to track realtime orders a higher amount of detail is required, but if you want to look at monthly trends like “Total sales per month,” looking at a monthly rollup of the data is much faster and more cost-effective. In this case, Looker creates and queries the sales_monthly_aggregate_table.
For a question like “What is the total value of each sale today,” you need granular, row-level order data. In this case, Looker will query the original orders_database table without any aggregation. If you want to look at weekly sales totals for the past three weeks, Looker creates and selects a sales daily aggregate table. This table is more granular than the monthly sales table, but is a rollup of the raw orders_database.
Aggregate awareness in Looker is commonly used to roll up or summarize data across multiple time periods. Additionally, aggregate tables must be persisted in a Looker instance in order to be leveraged for aggregate awareness.
Join views in a performant manner
Another way to optimize performance is to join only the views that you need while defining a new Explore. To minimize joins, you can define multiple Explores for different purposes (for example, query data by user, query aggregate sales data). Additionally, you should use base fields instead of concatenated fields as the primary keys. When possible, use many_to_one joins: joining views from the most granular level to the highest level of detail (many_to_one) typically provides the best query performance in Looker.
Include filters on Explore definitions
Including filters in Explore definitions can optimize performance by avoiding returning a large amount of data by default. There are many filter options, including filters that are visible to and modifiable by users, such as the always_filter and conditionally_filter. You can also modify filter suggestions for fields in an Explore. For more information and practice with Explore filters, try the lab Filtering Explores with LookML.
Implement caching policies
To reduce database query traffic, you should maximize caching to sync with your extract, load, and transform (ETL) policies wherever possible. By default, Looker caches queries for one hour. You can control the caching policy and sync Looker data refreshes with your ETL process by using the persist_with parameter to apply datagroups within Explores. This enables Looker to integrate more closely with the backend data pipeline so that cache usage can be maximized without the risk of analyzing stale data.
For example, some data tables might be updated only once per day, so refreshing the cache every hour for those tables does not add value. You use various options for customizing caching in Looker, include datagroups, or caching policies, in this lab to persist derived tables. For more information and practice with caching policies, try the lab Caching and Datagroups with LookML.
Additional query optimization
Depending on your specific database dialect, you can explore additional query optimization features, such as cluster_keys and indexes.
Task 1. Create an incremental persistent derived table that will auto-update without rebuilding the entire table
As described earlier, a persistent derived table (PDT) is a derived table that is written into a scratch schema on your database and regenerated on the schedule that you specify with a persistence strategy. PDTs are helpful because, when the user requests data from the table, the table will often already exist, which reduces query time and database load.
In a standard PDT, the entire table is rebuilt according to a schedule set in its caching policy. In contrast, PDTs that are built incrementally will append fresh data to an existing table. This can greatly reduce the size of the query you are sending to the database.
In this task, you create a native derived table (NDT) to aggregate order data by time frame or state. You also enable persistence with a daily refresh and incremental updates that go back 3 days to retrieve late data.
Use an Explore to create a native derived table
-
Click the toggle button to enter Development mode.
-
Navigate to Explore > Order Items.
-
Under Order Items > Dimensions, select the following:
- Order ID
- Sale Price
- Created Date > Date
- Created Date > Week
- Created Date > Month
-
Under Users > Dimensions, select State.
-
Click Run.
-
Click Settings (
).
-
Select Get LookML.
-
On the tab for Derived Table, copy the LookML code to a text editor.
You'll use this code to create a new view for the native derived table.
Create a view file for a derived table
-
Open a new Looker window in a new browser tab.
-
On the Develop menu, click qwiklabs_ecommerce.
-
Click the plus icon (+) next to File Browser, and select Create View.
-
Name the new file
incremental_pdt, and click Create. -
In the File Browser, click on incremental_pdt.view and drag it under the views folder.
-
Replace the default LookML code in incremental_pdt.view with the code that you copied previously for the native derived table.
-
Update line 4 with the correct view name (
incremental_pdt). -
Update the
order_iddimension to define it as theprimary_keyfor the view:
This is because each record represents an order with unique order_id.
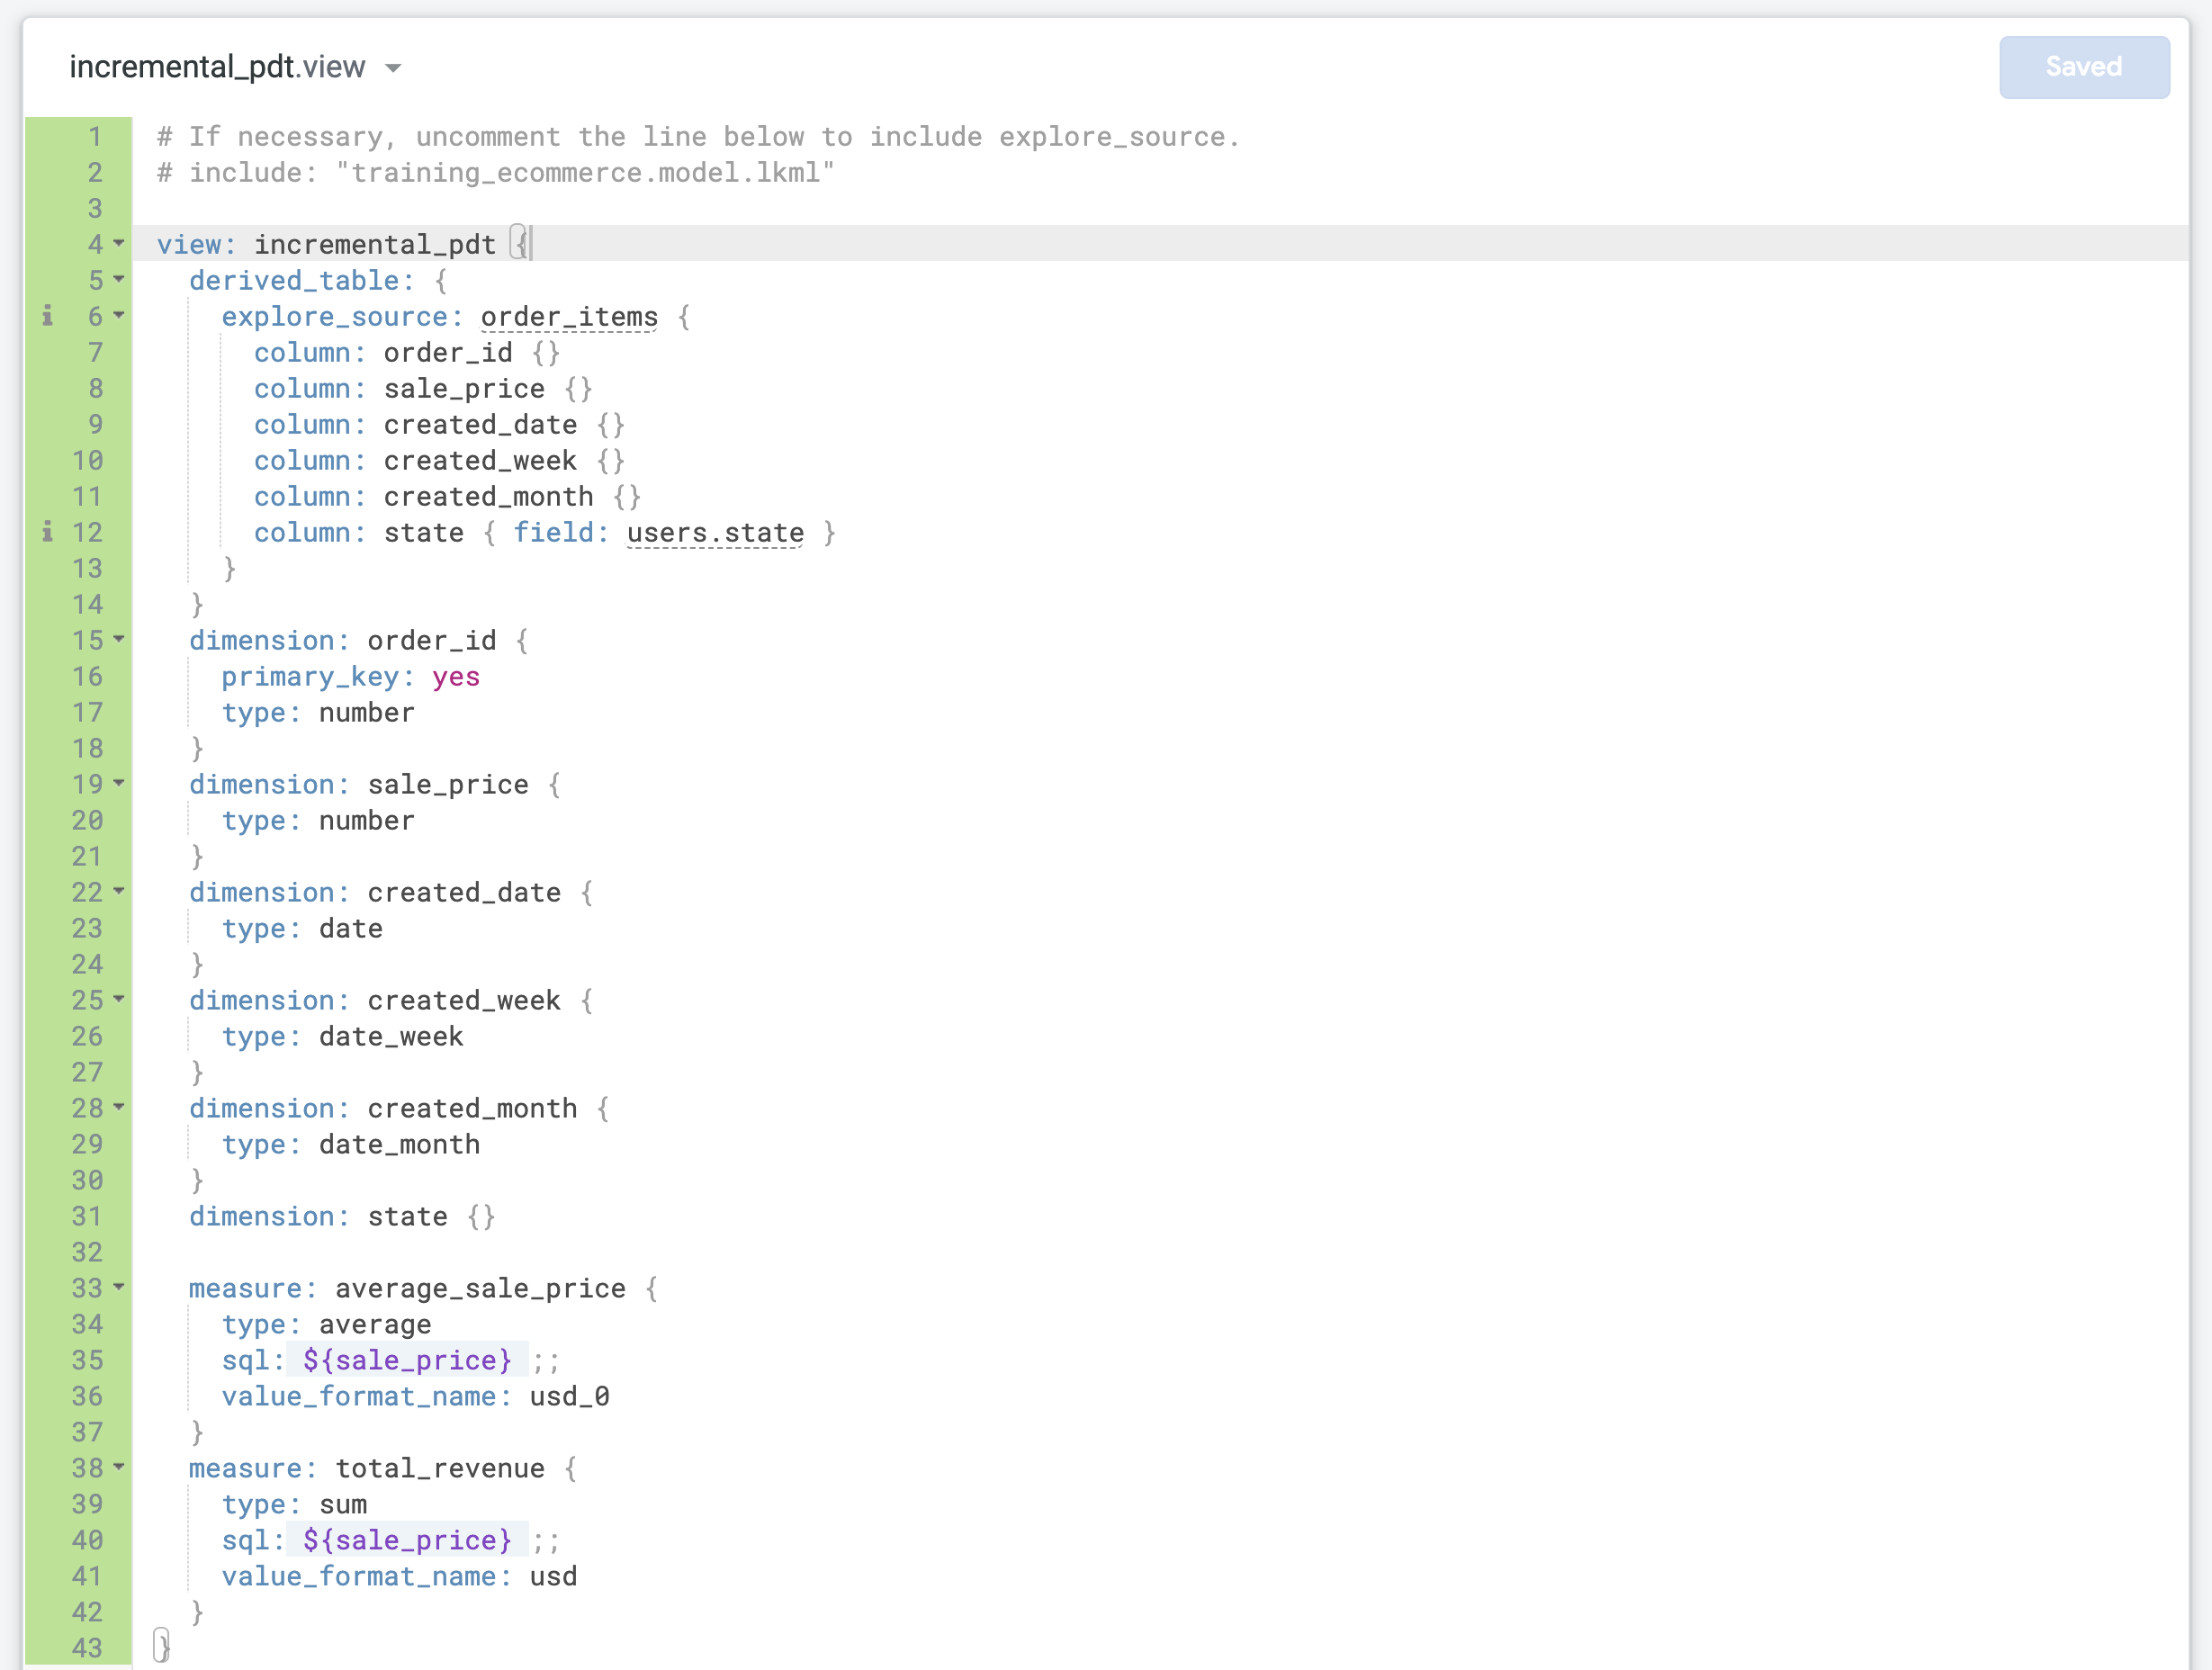
- Find the last dimension, and add two new measures before the final closing curly bracket (
}) in the file:
- Click Save Changes. You file should resemble the following:
Add persistence and incremental updates to a derived table
-
Open training_ecommerce.model.
-
Find the default datagroup named
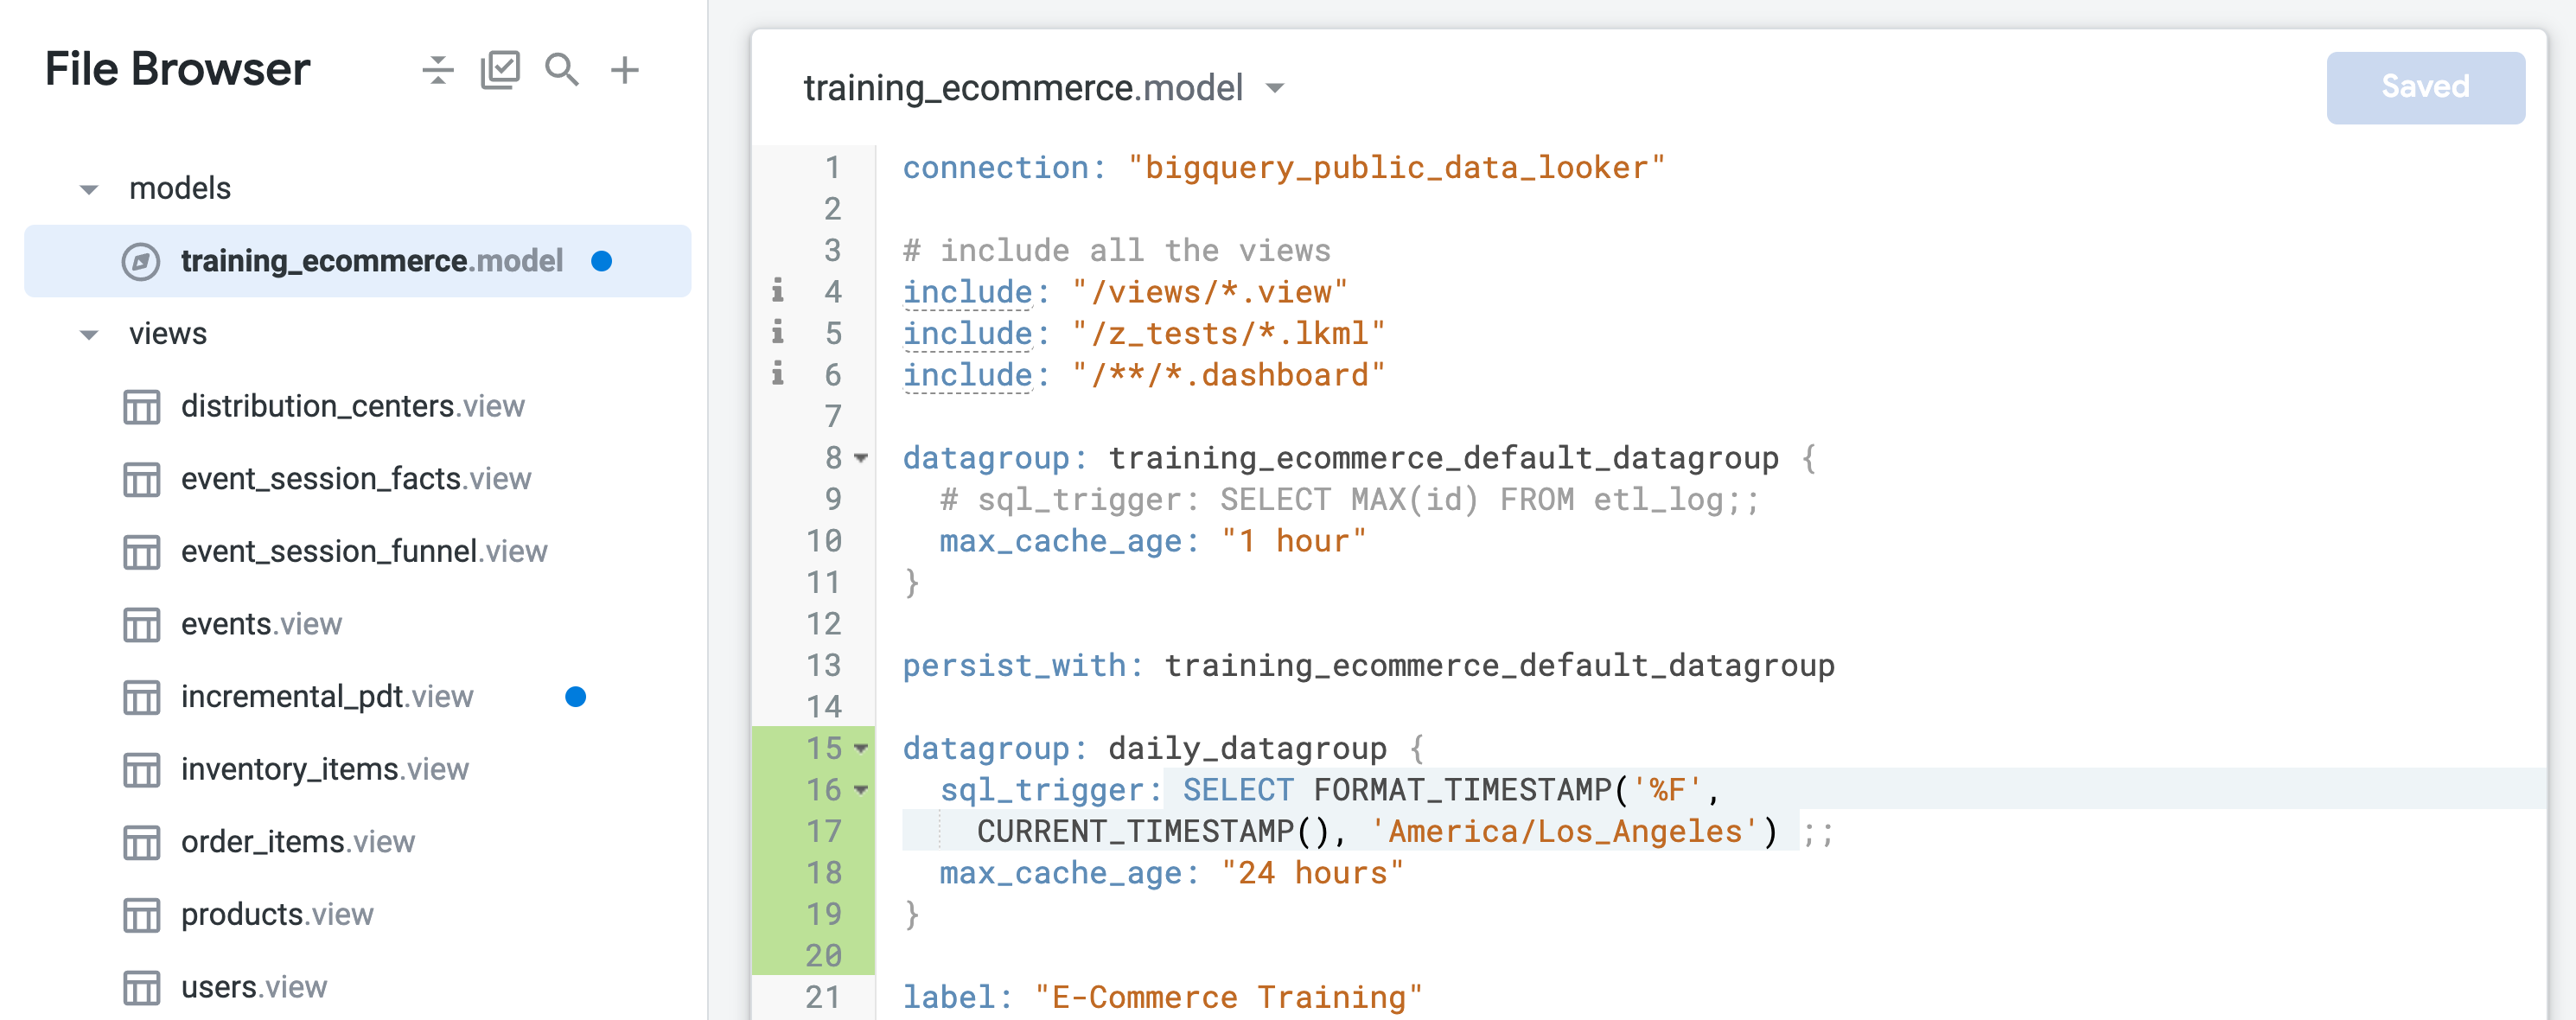
training_ecommerce_default_datagroup, and add a new line (line 13). -
Define a new datagroup to persist objects with daily refresh (max time of 24 hours):
The sql_trigger checks the current date and triggers a refresh when the date changes, and max_cache_age ensures that the table will rebuild after 24 hours, even if the sql_trigger fails to run successfully.
- At the end of
training_ecommerce.model(around line 67), define a new Explore that contains only theincremental_pdtview so that you can test it in subsequent steps:
- Click Save Changes.
- Open incremental_pdt.view, and add persistence by including the daily datagroup in the derived table definition at line 6:
- Add incremental updates by including the following parameters in the derived table definition at lines 7 and 8:
- Click Save Changes. Your file should resemble the following:
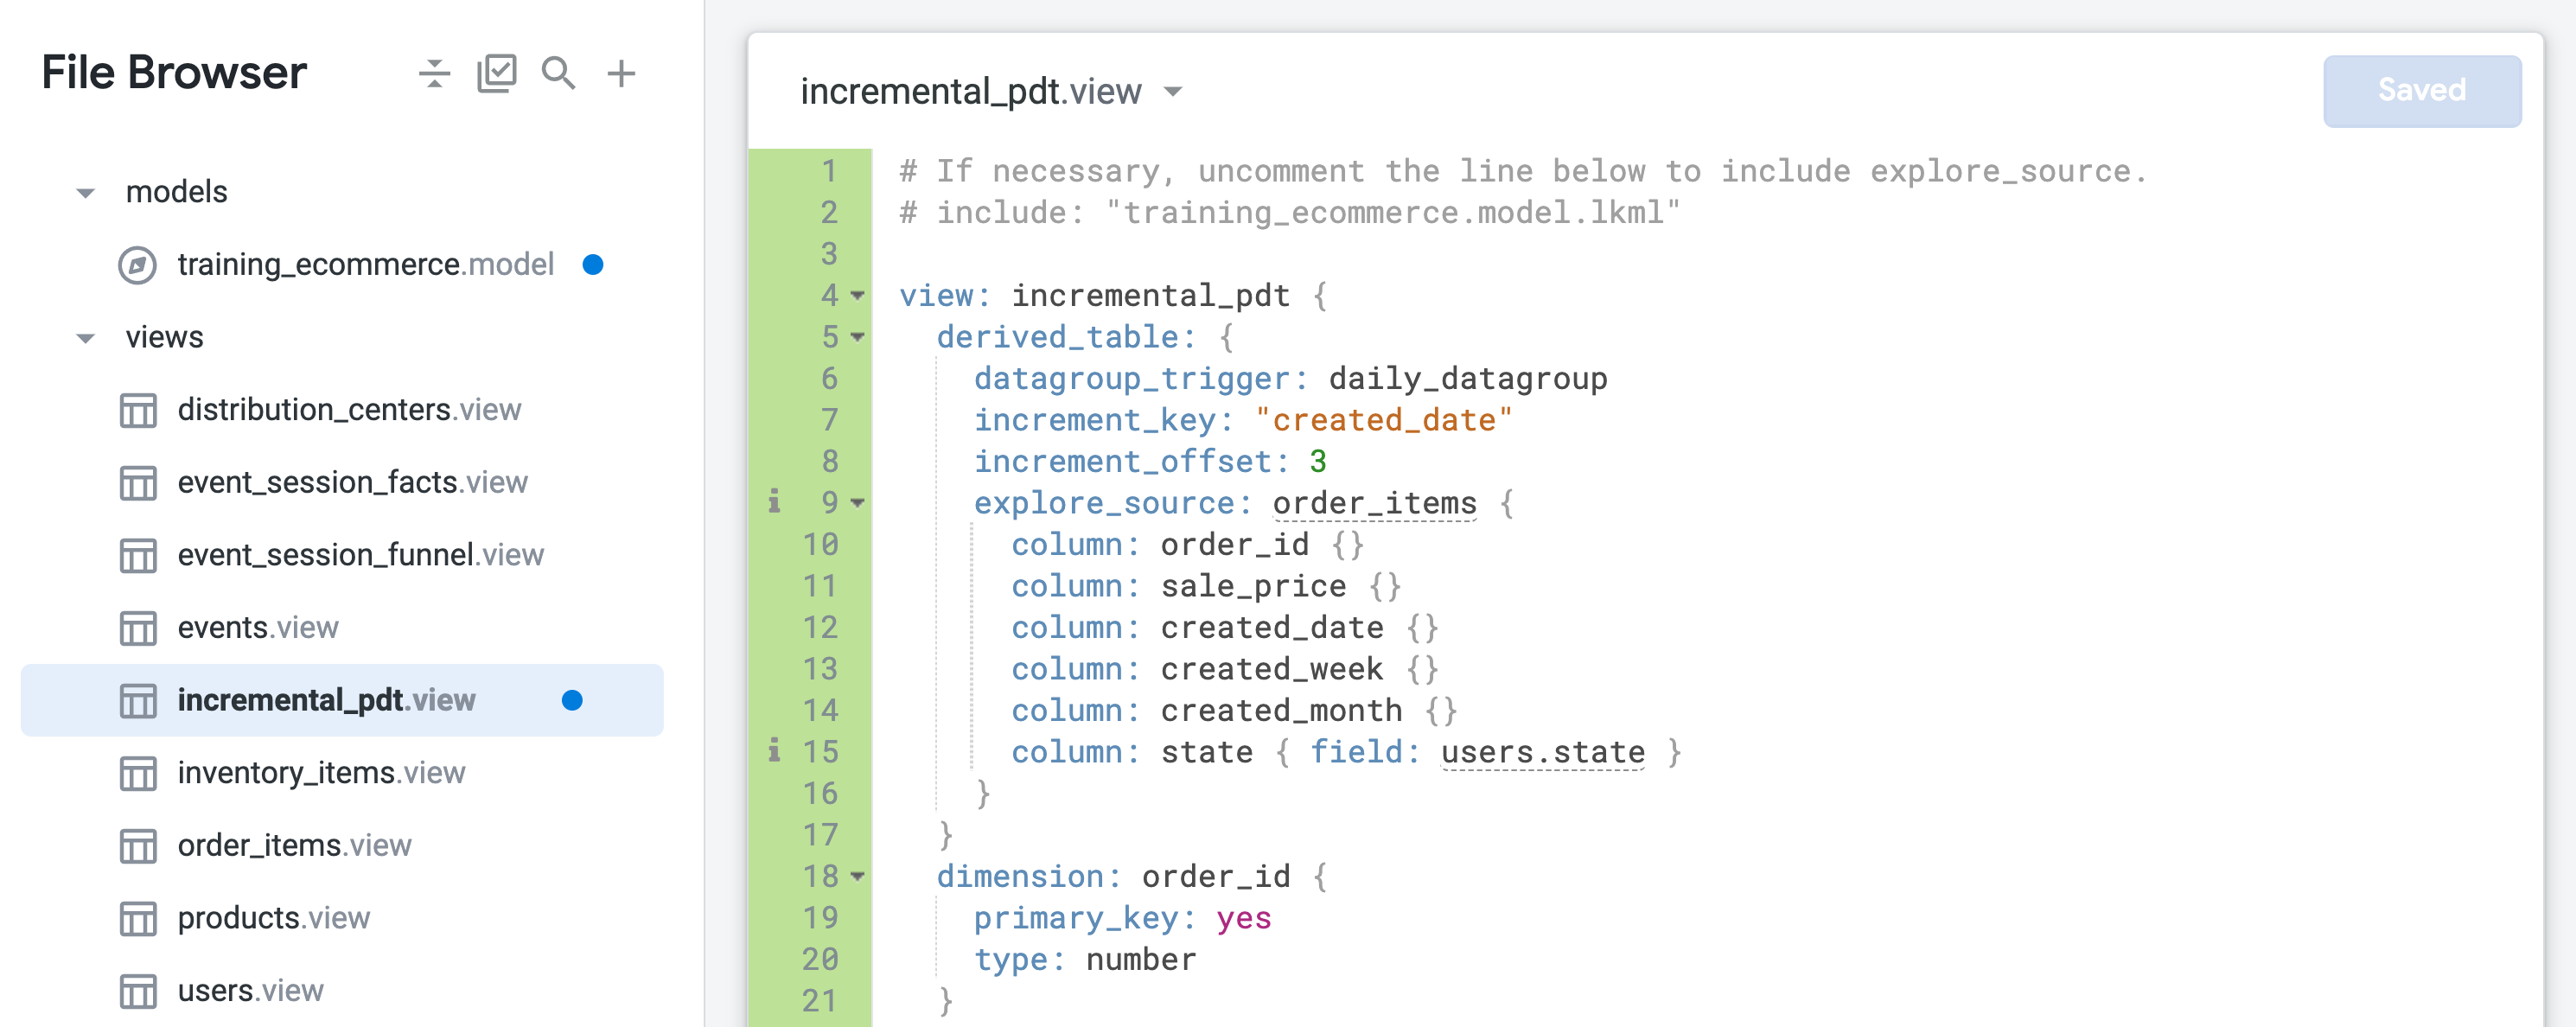
The persistent derived table will now be persisted and will rebuild once a day, going back 3 days to capture any orders that may have arrived late.
- Close the browser tab for the original Explore query, but leave the tab open for the Looker IDE.
Test Explore queries on a persistent incremental derived table
-
Open a new Looker window in a browser tab.
-
Navigate to Explore > Incremental Pdt.
-
In the Data pane, open the SQL tab.
-
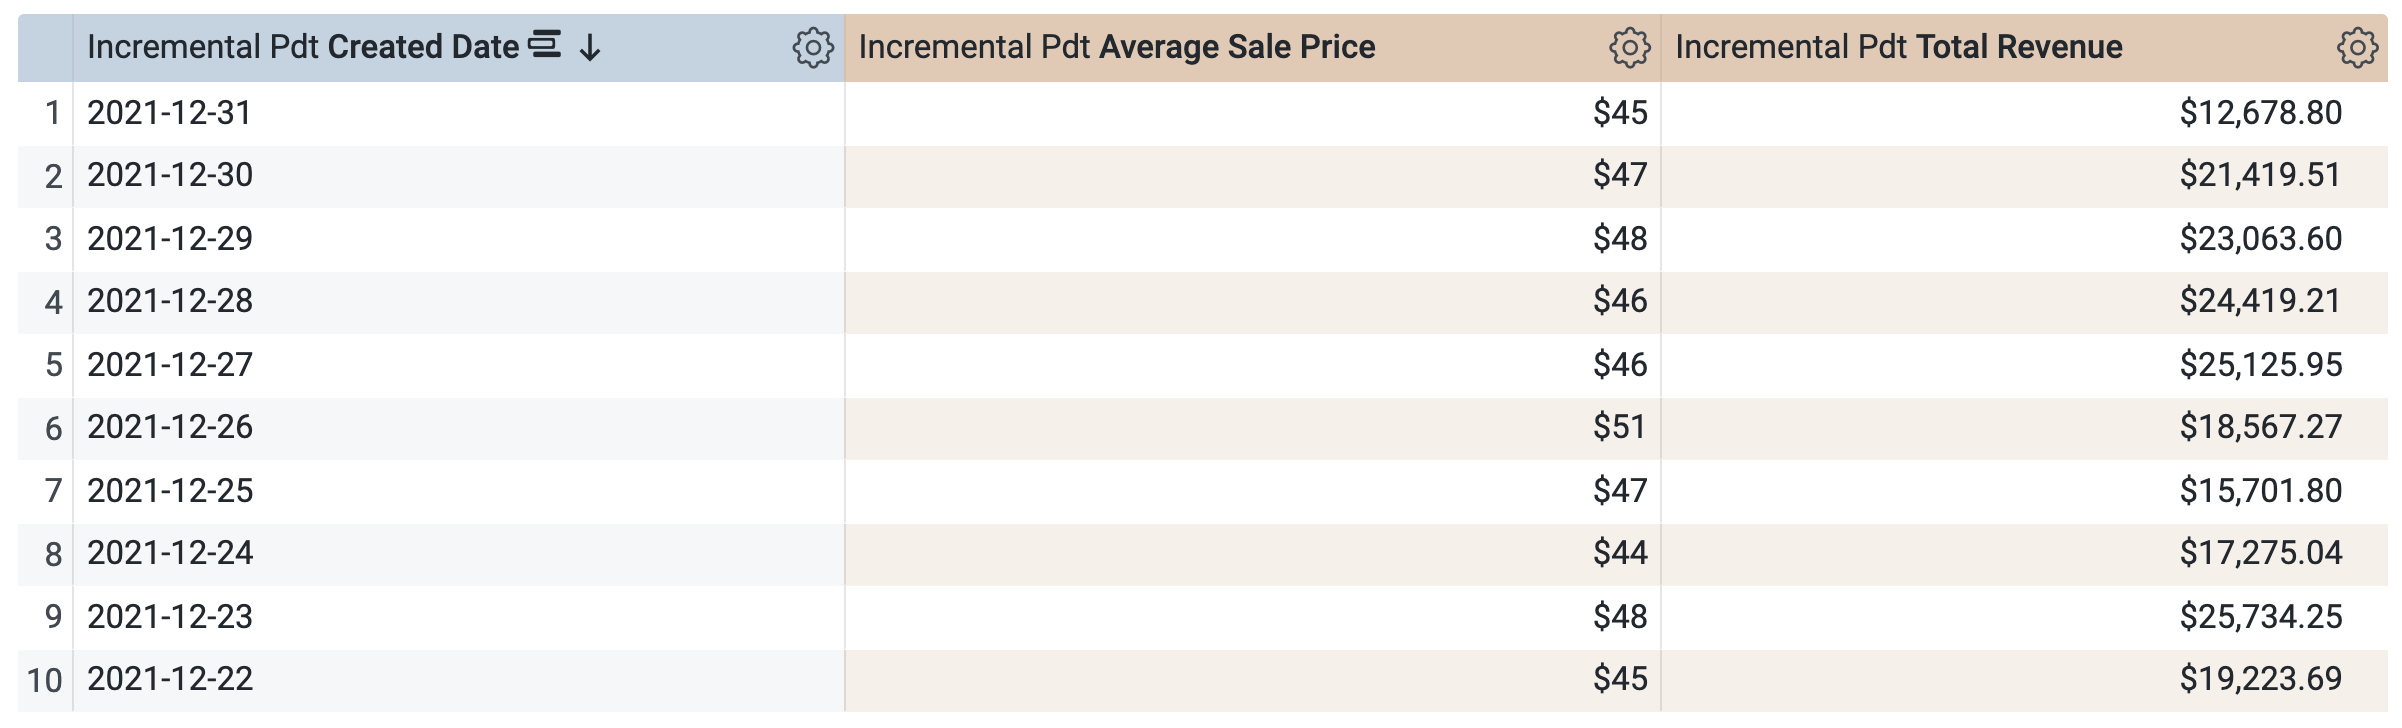
Under Incremental Pdt > Dimensions, select Created Date.
-
Under Incremental Pdt > Measures, select Average Sale Price and Total Revenue.
Before running the query, notice that there are two queries in the SQL window (which may take a few seconds to load). The first query generates the PDT named incremental_pdt, and the second query retrieves the results from the newly created PDT.
-
Click Run.
-
Open the Results tab to see the results.
-
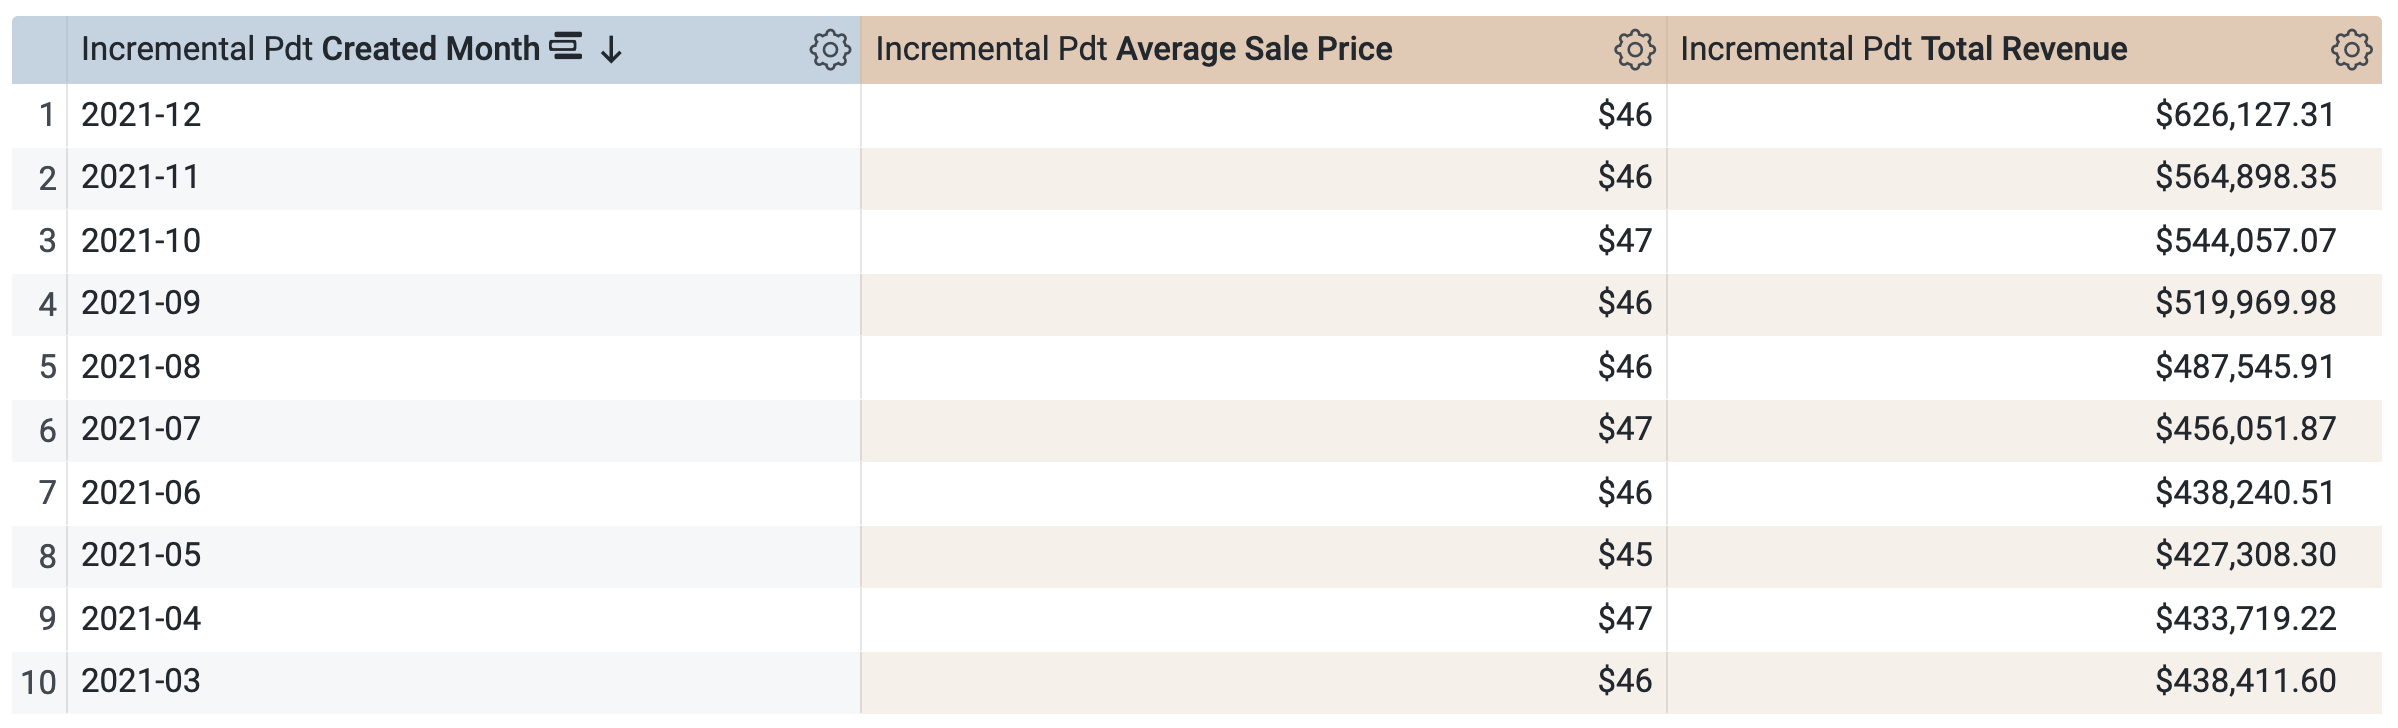
Under Incremental Pdt > Dimensions:
- Clear Created Date.
- Select Created Month.
-
In the Data pane, open the SQL tab.
Notice that the query will use the same PDT to retrieve the results, which makes sense because you requested a time frame that is already defined (and cached) in the PDT. However, notice that you cannot select and run a query on a different time frame that is not already included in the PDT, such as Quarter or Year.
-
Click Run.
-
Open the Results tab to see the results.
Challenge
- Run a new query using only the State dimension and the Average Sale Price and Total Revenue measures. Answer the following question.
-
Close the browser tab for the Explore query, and return to the browser tab with the Looker IDE.
-
Click Validate LookML.
There should be no LookML errors.
Commit changes and deploy to production
-
Click Validate LookML and then click Commit Changes & Push.
-
Add a commit message and click Commit.
-
Lastly, click Deploy to Production.
Remain in the browser tab for the Looker IDE as you begin the next task.
Click Check my progress to verify the objective.
Task 2. Create an incremental aggregate table to summarize order data across multiple time periods
In Looker, you can create strategic aggregate tables that will minimize the number of queries required on the large tables in a database. Aggregate tables must be persisted to your database so that they can be accessible for aggregate awareness. Aggregate tables are therefore a type of persistent derived table (PDT).
An aggregate table is defined using the aggregate_table parameter under an Explore parameter in your LookML project. After you create your aggregate tables, you can run queries in the Explore to see which aggregate tables Looker uses. Looker uses aggregate awareness logic to find the smallest, most efficient aggregate table available in your database to run a query while still maintaining correctness.
In this task, you recreate the incremental PDT from the previous task as a new incremental aggregate table. You also make the new aggregate table available to users by using a refinement of the existing Order Items Explore.
Create an aggregate table within a refinement of an existing Explore
-
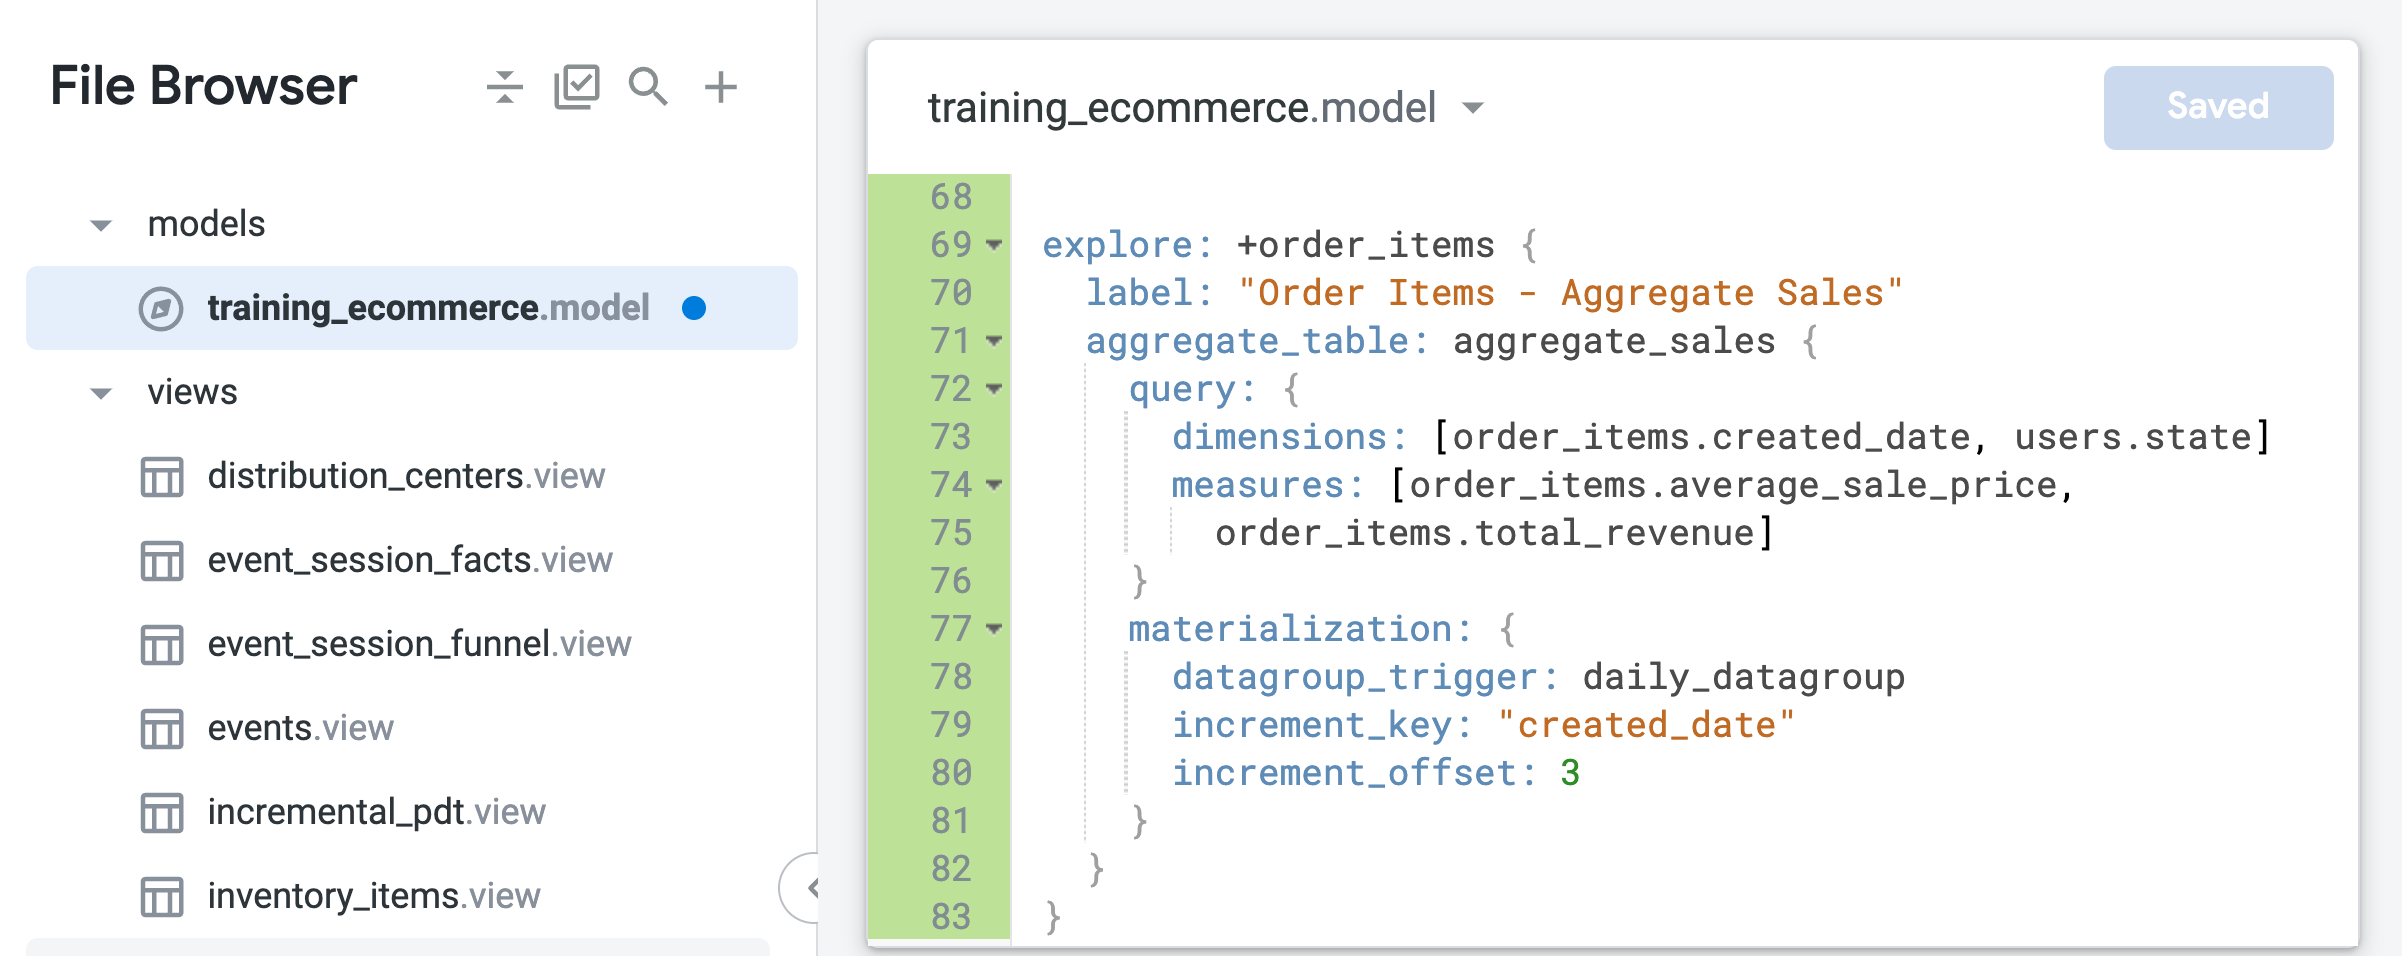
From the Looker IDE page, open training_ecommerce.model.
-
At the end of the file (around line 69), add the following code to create a refinement of the order_items Explore:
This refinement builds on the existing order_items Explore defined in the model file and adds any modifications specified in the new LookML code, such as the label or the aggregate table that you will add in the next steps.
- Expand the LookML code for the refinement to include an aggregate table that summarizes order data by time frame or state:
Notice that, unlike the native derived table that you created in the previous task, the only time dimension specified in the aggregate table is created_date. With aggregate awareness, Looker can leverage this single table for Explore queries that request time-aggregated Average Sale Price or Total Revenue, regardless of which timeframe is requested (day, month, year).
- Click Save Changes.
Leave this tab open for the Looker IDE.
Test Explore queries on a persistent incremental aggregate table
-
Open a new Looker window in a browser tab.
-
Navigate to Explore > Order Items - Aggregate Sales.
-
In the Data pane, open the SQL tab.
-
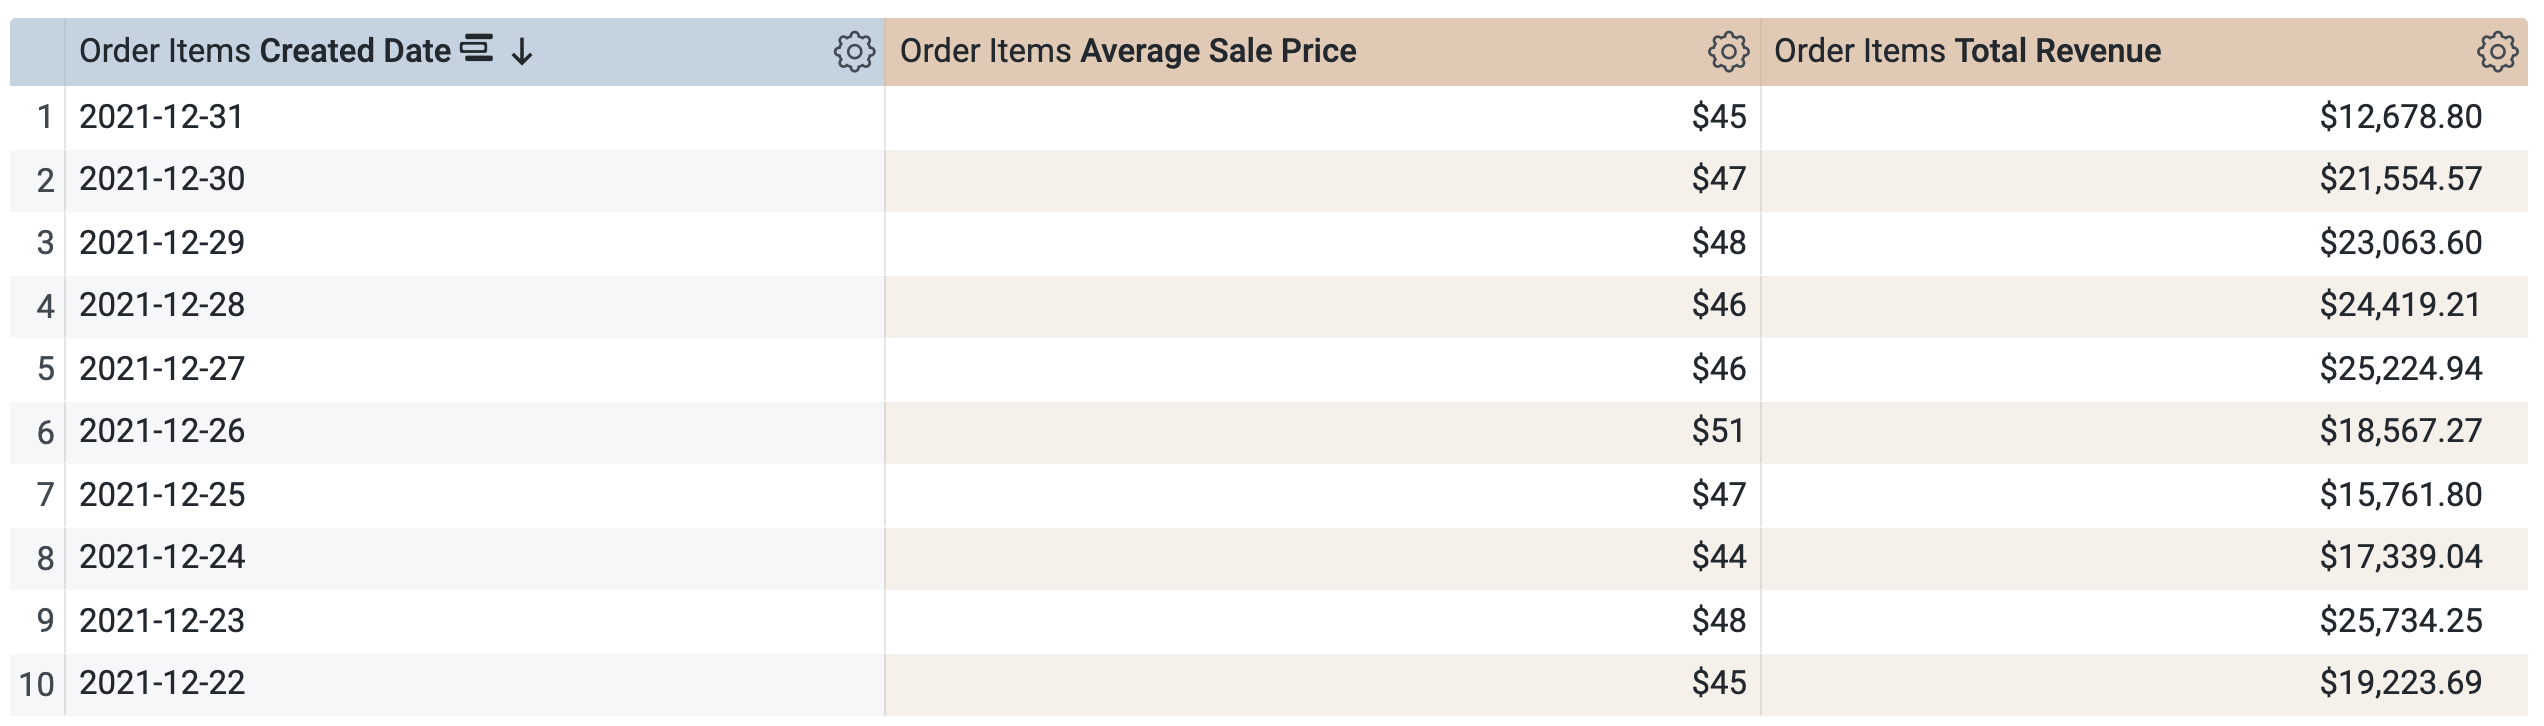
Under Order Items > Dimensions, select Created Date > Date.
-
Under Order Items > Measures, select Average Sale Price and Total Revenue.
Before running the query, notice that there are two queries, similar to the SQL window in Task 1. The first query generates the PDT named aggregate_sales, and the second query retrieves the results from this new PDT.
-
Click Run.
-
Open the Results tab to see the results.
-
Under Order Items > Dimensions > Created Date:
- Clear Date.
- Select Quarter.
-
In the Data pane, open the SQL tab.
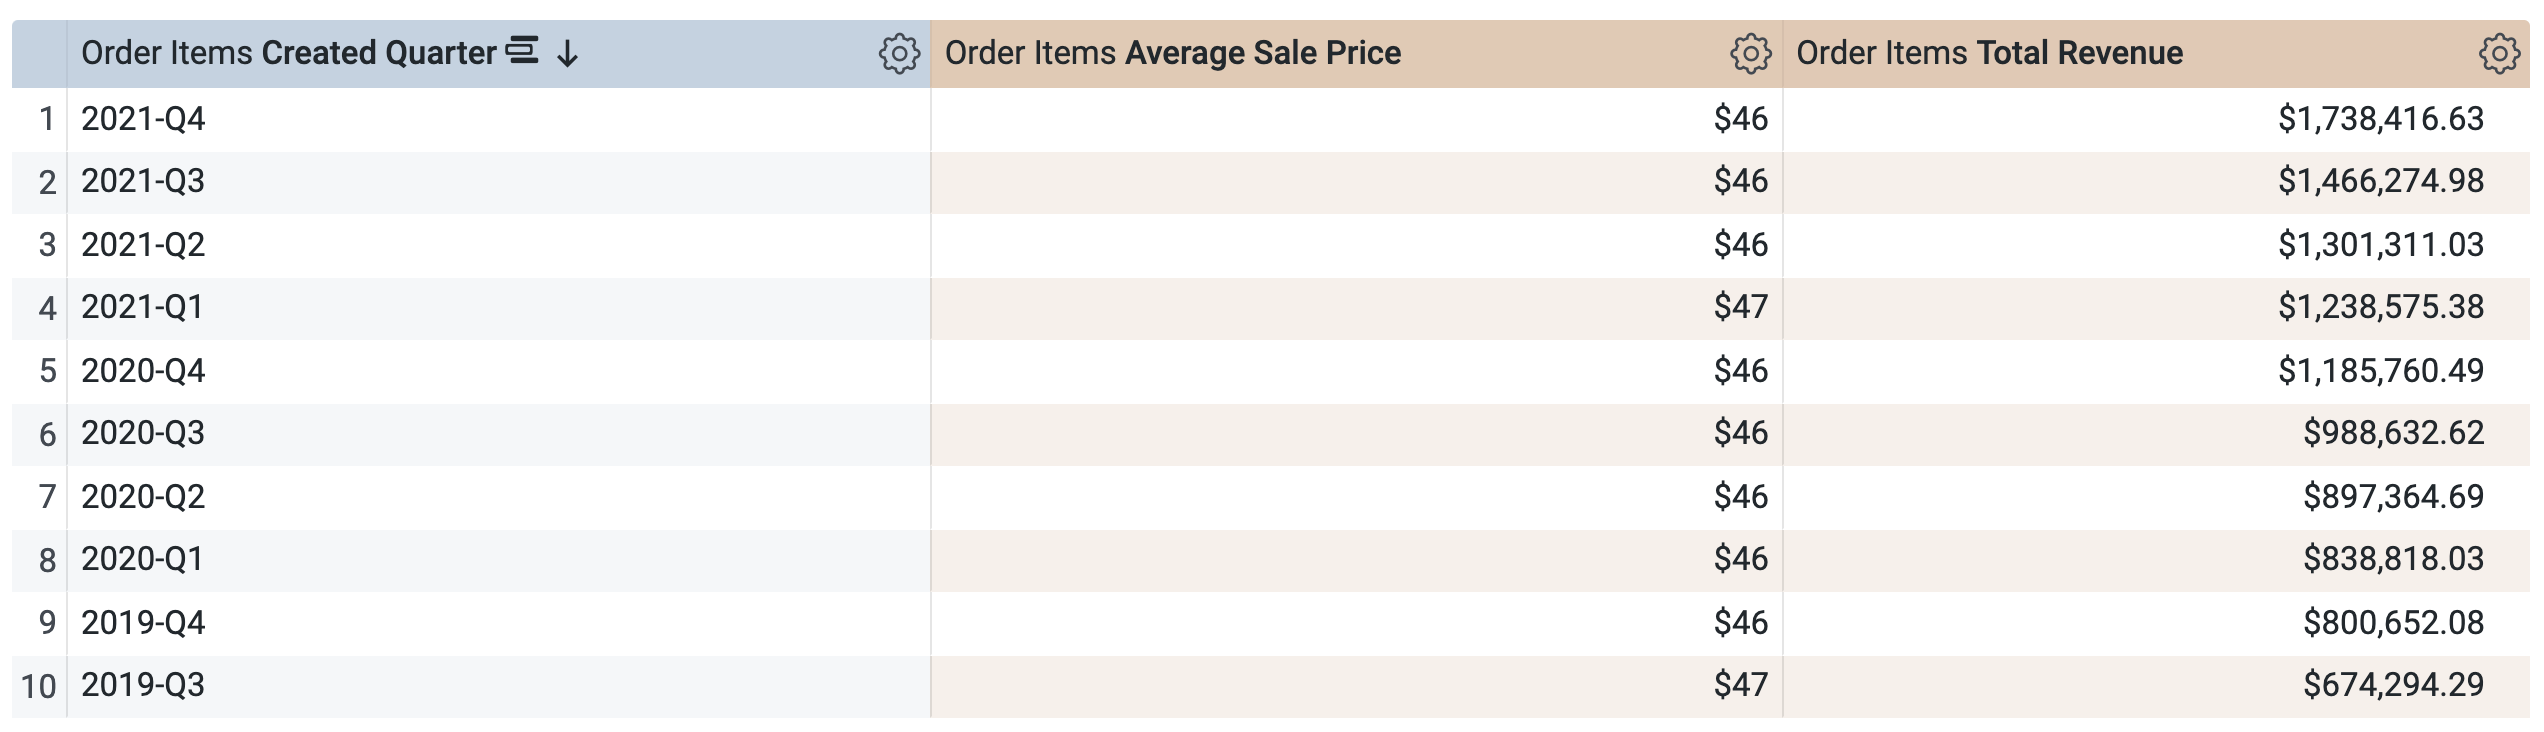
Notice that the query will use the same PDT (aggregate_sales) to retrieve the results by quarter. Looker is applying aggregate awareness to roll up Average Sale Price and Total Revenue to the requested time frames available under Created Date.
-
Click Run.
-
Open the Results tab to see the results.
Challenge
- Run a new query using only the State dimension (under Users) and the Average Sale Price and Total Revenue measures. Answer the following question.
- Run a new query using only the Country dimension (under Users) and the Average Sale Price and Total Revenue measures. Answer the following question.
-
Close the browser tab for the Explore query, and return to the browser tab with the Looker IDE.
-
Click Validate LookML. There should be no LookML errors.
Commit changes and deploy to production
-
Click Validate LookML and then click Commit Changes & Push.
-
Add a commit message and click Commit.
-
Lastly, click Deploy to Production.
Remain in the browser tab for the Looker IDE as you begin the next task.
Click Check my progress to verify the objective.
Task 3. Join views in a performant manner to optimize Explore queries
Efficient joins are key components of defining performant Explores in Looker. To improve efficiency of joins, be sure to join only the views that are needed to define the Explore, use base fields (instead of concatenated fields) as the primary keys for the views, and use many_to_one joins whenever possible.
As described in the documentation, primary keys provide a unique identifier for records within a view and are essential for accurate aggregations and relationships in Looker. The primary key for a view is a field containing unique values (such as an ID column) and is identified in the view file with the parameter primary_key: yes.
In this section, you first identify the most appropriate column to use a primary key for a view. You then define a new Explore for the aggregate table with only the users view joined, use the from parameter to specify order_items as the base view of the Explore, and then join the users view. Finally, you omit the extra joins that are included in the existing Order Items Explore and use the many_to_one join relationship to support query efficiency.
Identify the most appropriate field to use as the primary key of a view
- Open the users.view file. Answer the following question.
In users.view, the IDd column is already identified as the primary key using primary_key: yes. It is a base field that contains unique values (one ID for each user) and is not a concatenated field created from multiple columns. Therefore, ID is the best choice for the primary key of the users view and can support efficient joins.
- Open the order_items.view file. Answer the following question.
The order_item_id is based on the ID column in the order_items table and is identified as the primary key. However, other ID fields in this view could potentially be the unique key of the table, including order_id, which is based on the order_id column in the order_items table.
In the next steps, you explore the order_items table in SQL Runner to identify why order_item_id is the best field to use the primary_key.
-
Open a new Looker window in a new browser tab.
-
Navigate to Develop > SQL Runner.
-
Click Settings (
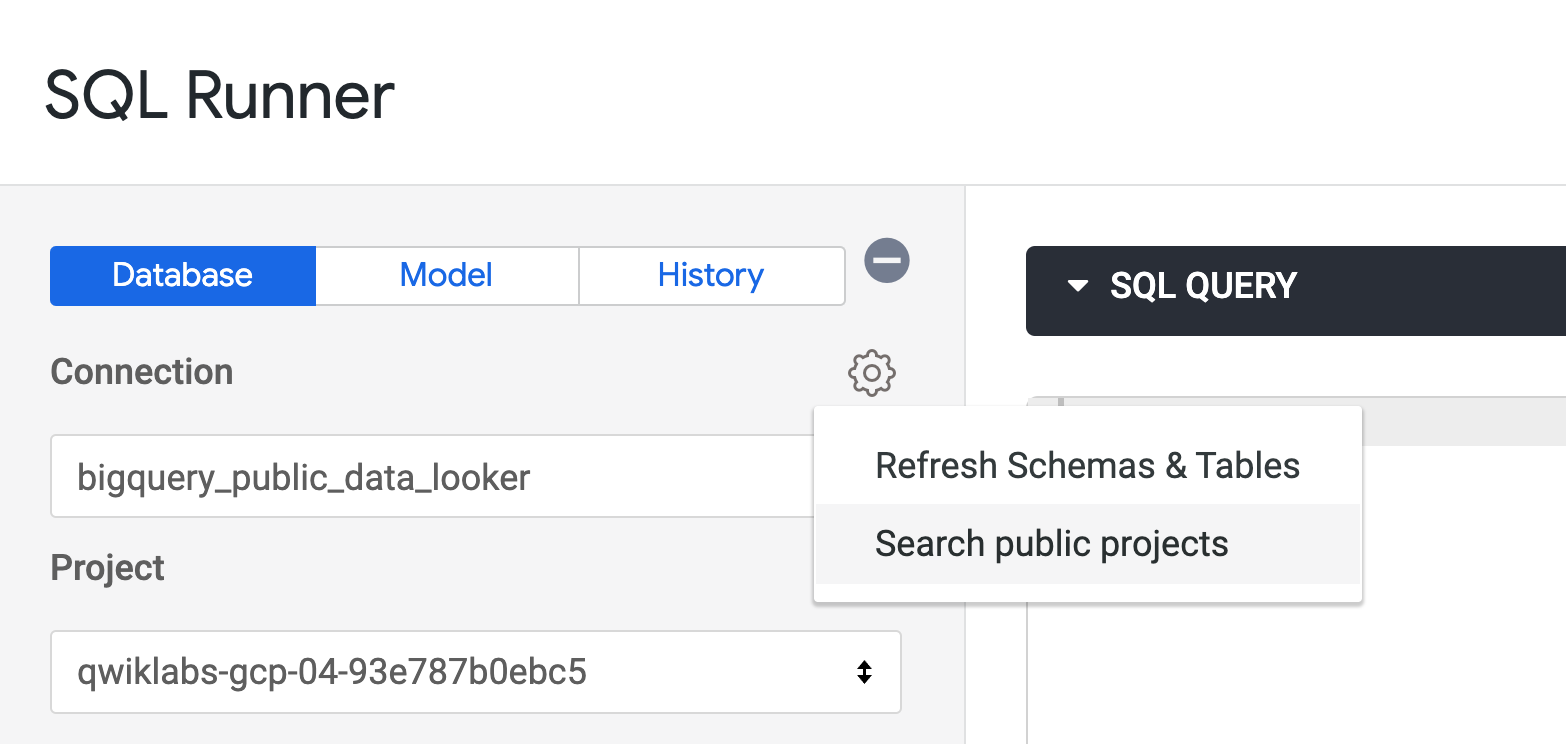
-
The box for Project will now be empty. Type
cloud-training-demos, and press ENTER. -
For Dataset, select
looker_ecomm.
A list of the available tables in this BigQuery dataset is displayed.
A fast and easy method to check whether a column is an appropriate primary key is to compare the count of records in the table to the count of distinct values in the column. If the two counts match, the column contains unique values and is an appropriate primary key for the table.
- To check whether the
user_idcolumn would make an appropriate primary key, add the following query to the SQL Query window, and click Run:
- Repeat the query for the
order_id,inventory_item_id, andidcolumns.
In this case, both id and inventory_item_id matched the count of records in the table because they are different IDs for the same item within an order. Thus, either could potentially be used as the primary key.
The id column was chosen as the primary key for order_items because it is the generated id for an item in the order_items table, but inventory_item_id is the id of the same item in the inventory_items table.
- Close the browser tab for SQL Runner, and return to the browser tab with the Looker IDE.
Join the minimal amount of views to define new Explores
-
Open training_ecommerce.model.
-
Review the existing
order_itemsExplore.
Notice that it includes four different joins that each use the relationship type many_to_one. Depending on your use case, all of these joins may be needed. However, what if you only needed the user and order data rolled up by state or timeframe? If so, these extra joins would actually never be used and would slow down queries in the Explore.
In the next steps, you create a new Explore that joins only the order and user data, based on user_id in order_items view and id in the users view.
- At the end of the file (around line 85) add the following code to define a new Explore with
order_itemsas the base view and only the users view joined:
- Click Save Changes.
Your file should resemble the following:
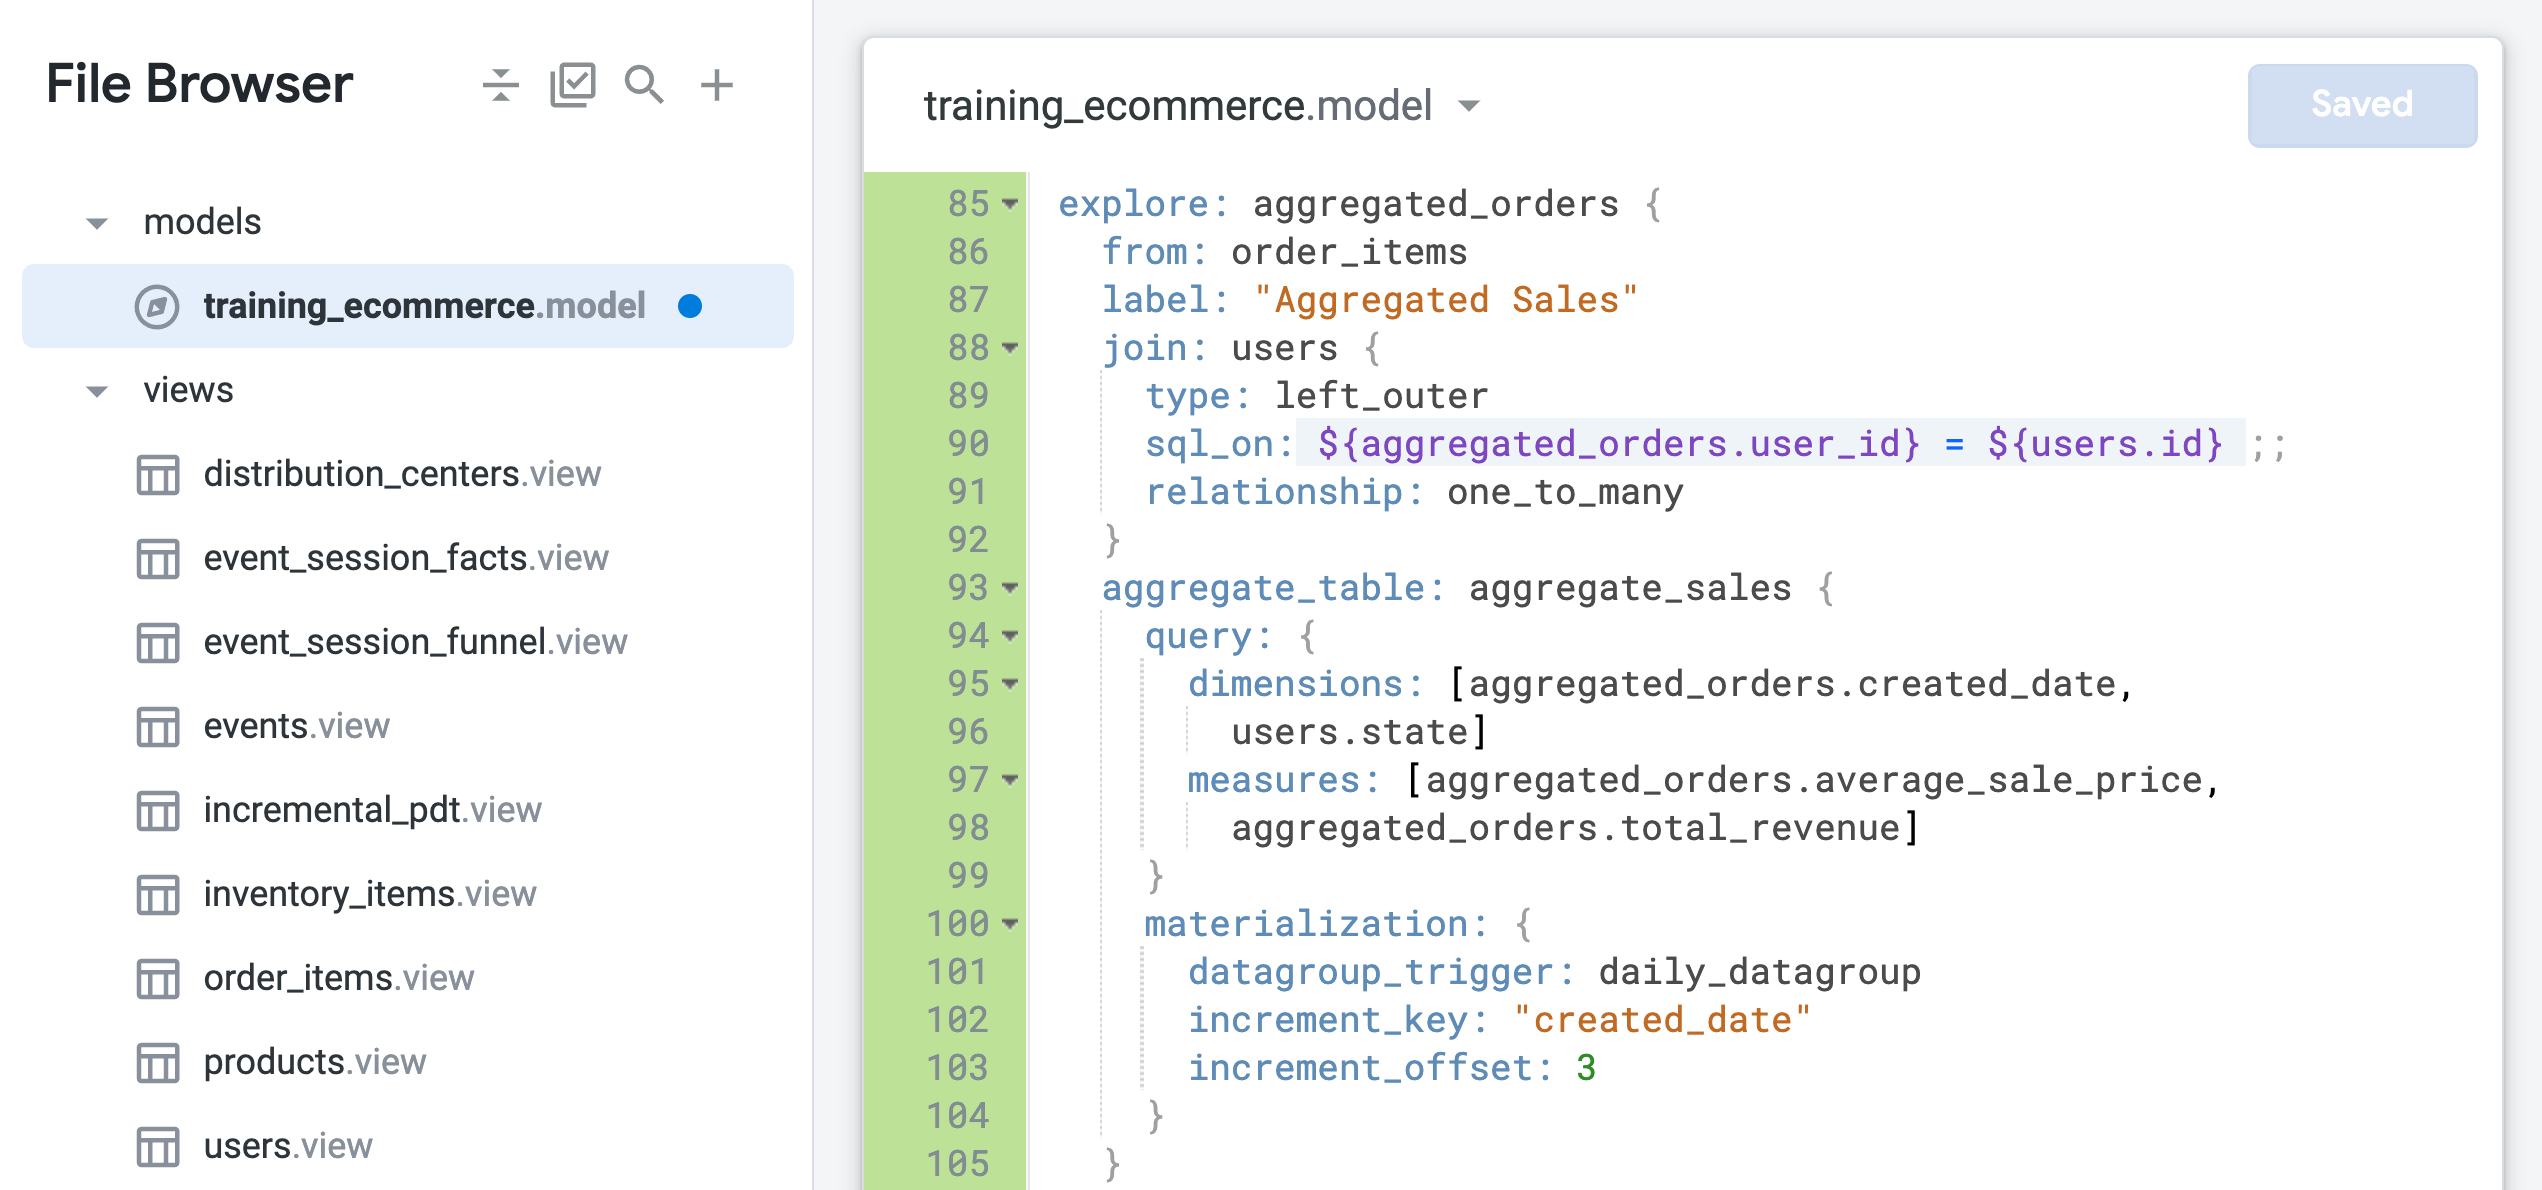
The from parameter is used to specify order_items as the base view of the Explore, to which the users view is joined. The fields in order_items view are now identified using the new Explore name as aggregated_orders.fieldname.
Notice also that the relationship between the users view and the order_items view is currently identified as one_to_many. In the next steps, you test whether this join based on a one_to_many relationship is the most optimal configuration for this Explore.
Define performant join relationships for efficient Explore queries
-
Open a new Looker window in a new browser tab.
-
Navigate to Explore > Aggregated Sales.
-
In the Data pane, open the SQL tab.
-
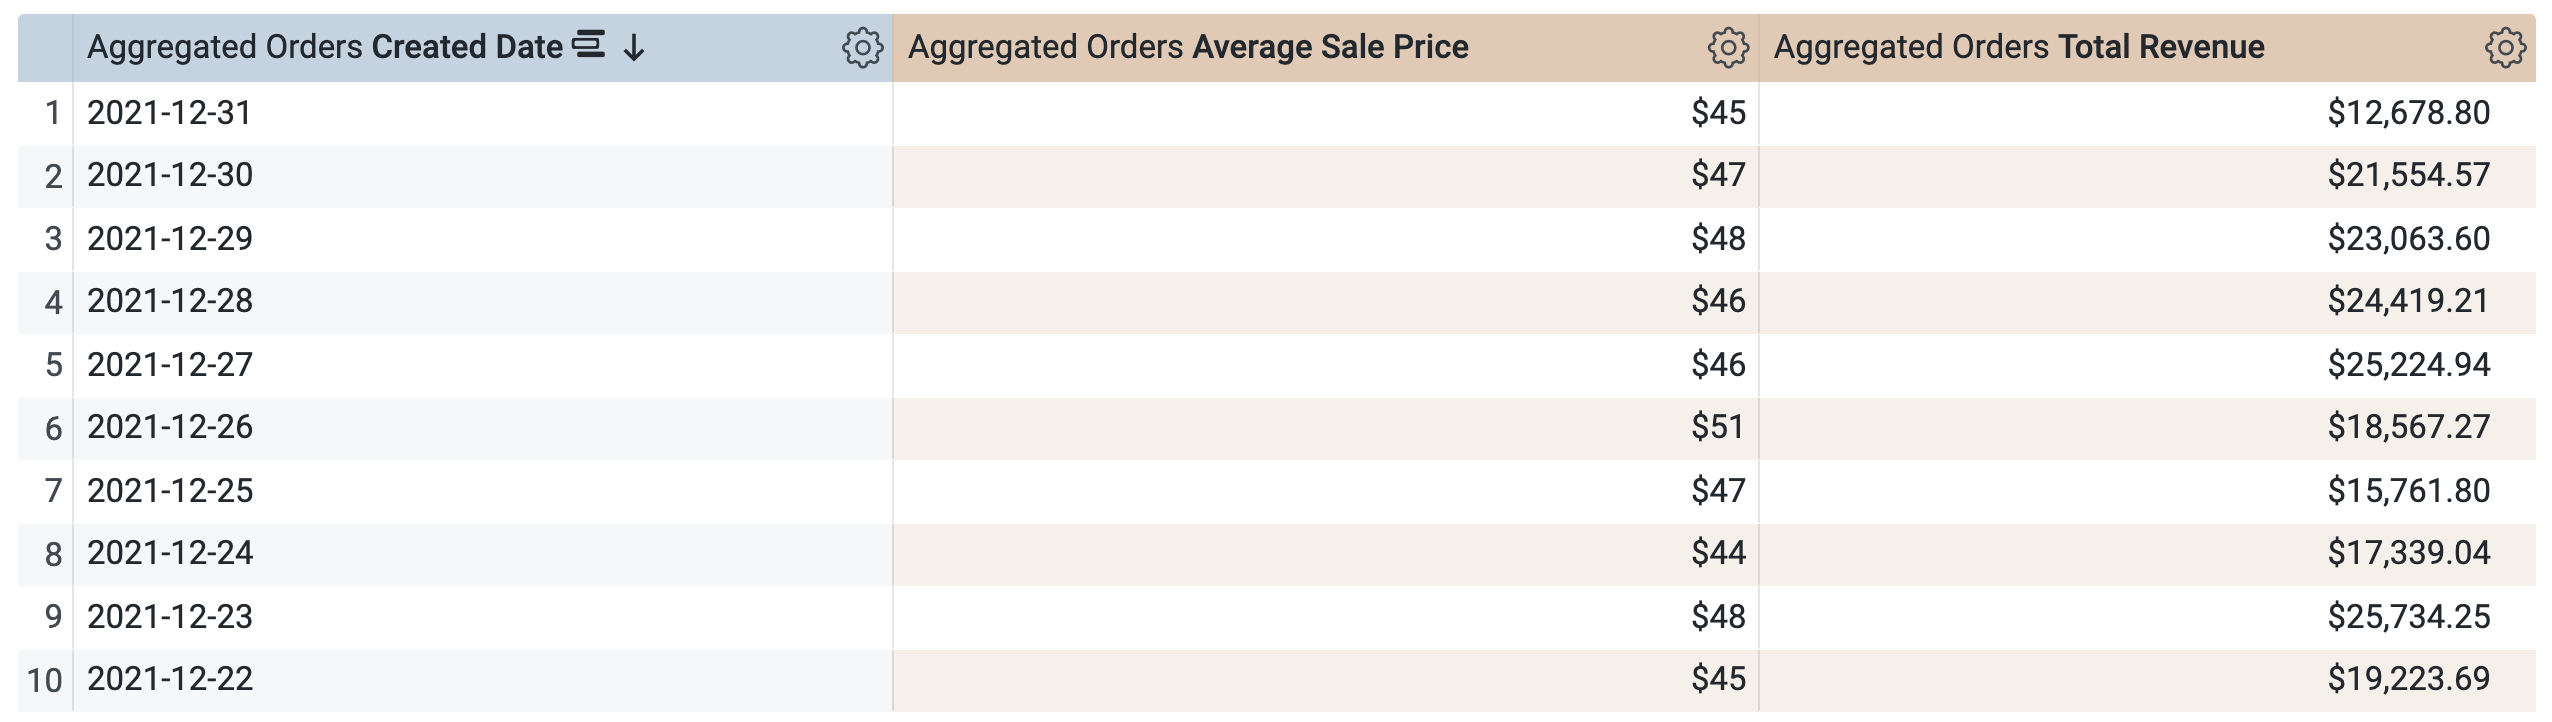
Under Aggregated Orders > Dimensions, select Created Date > Date.
-
Under Aggregated Orders > Measures, select:
- Average Sale Price
- Total Revenue
Before running the query, notice that the aggregate table is not being used due to an issue with a join fanout:
An unintended fanout can occur when the relationship between two tables is not identified correctly for a join. In this case, the base view of the Explore is order_items, which can contain many orders for one user. However, the users view contains only one record for each user.
Therefore, this join should actually be defined as many_to_one, or many orders to one user, instead of one order to many users. (Learn more about the problem of fanouts in the Looker Help Center.)
-
Click Run.
-
Open the Results tab.
The results are returned, but Looker did not use the efficient aggregate table to retrieve the results. -
Leave this browser tab for the Explore open, and return to the browser tab with the Looker IDE.
-
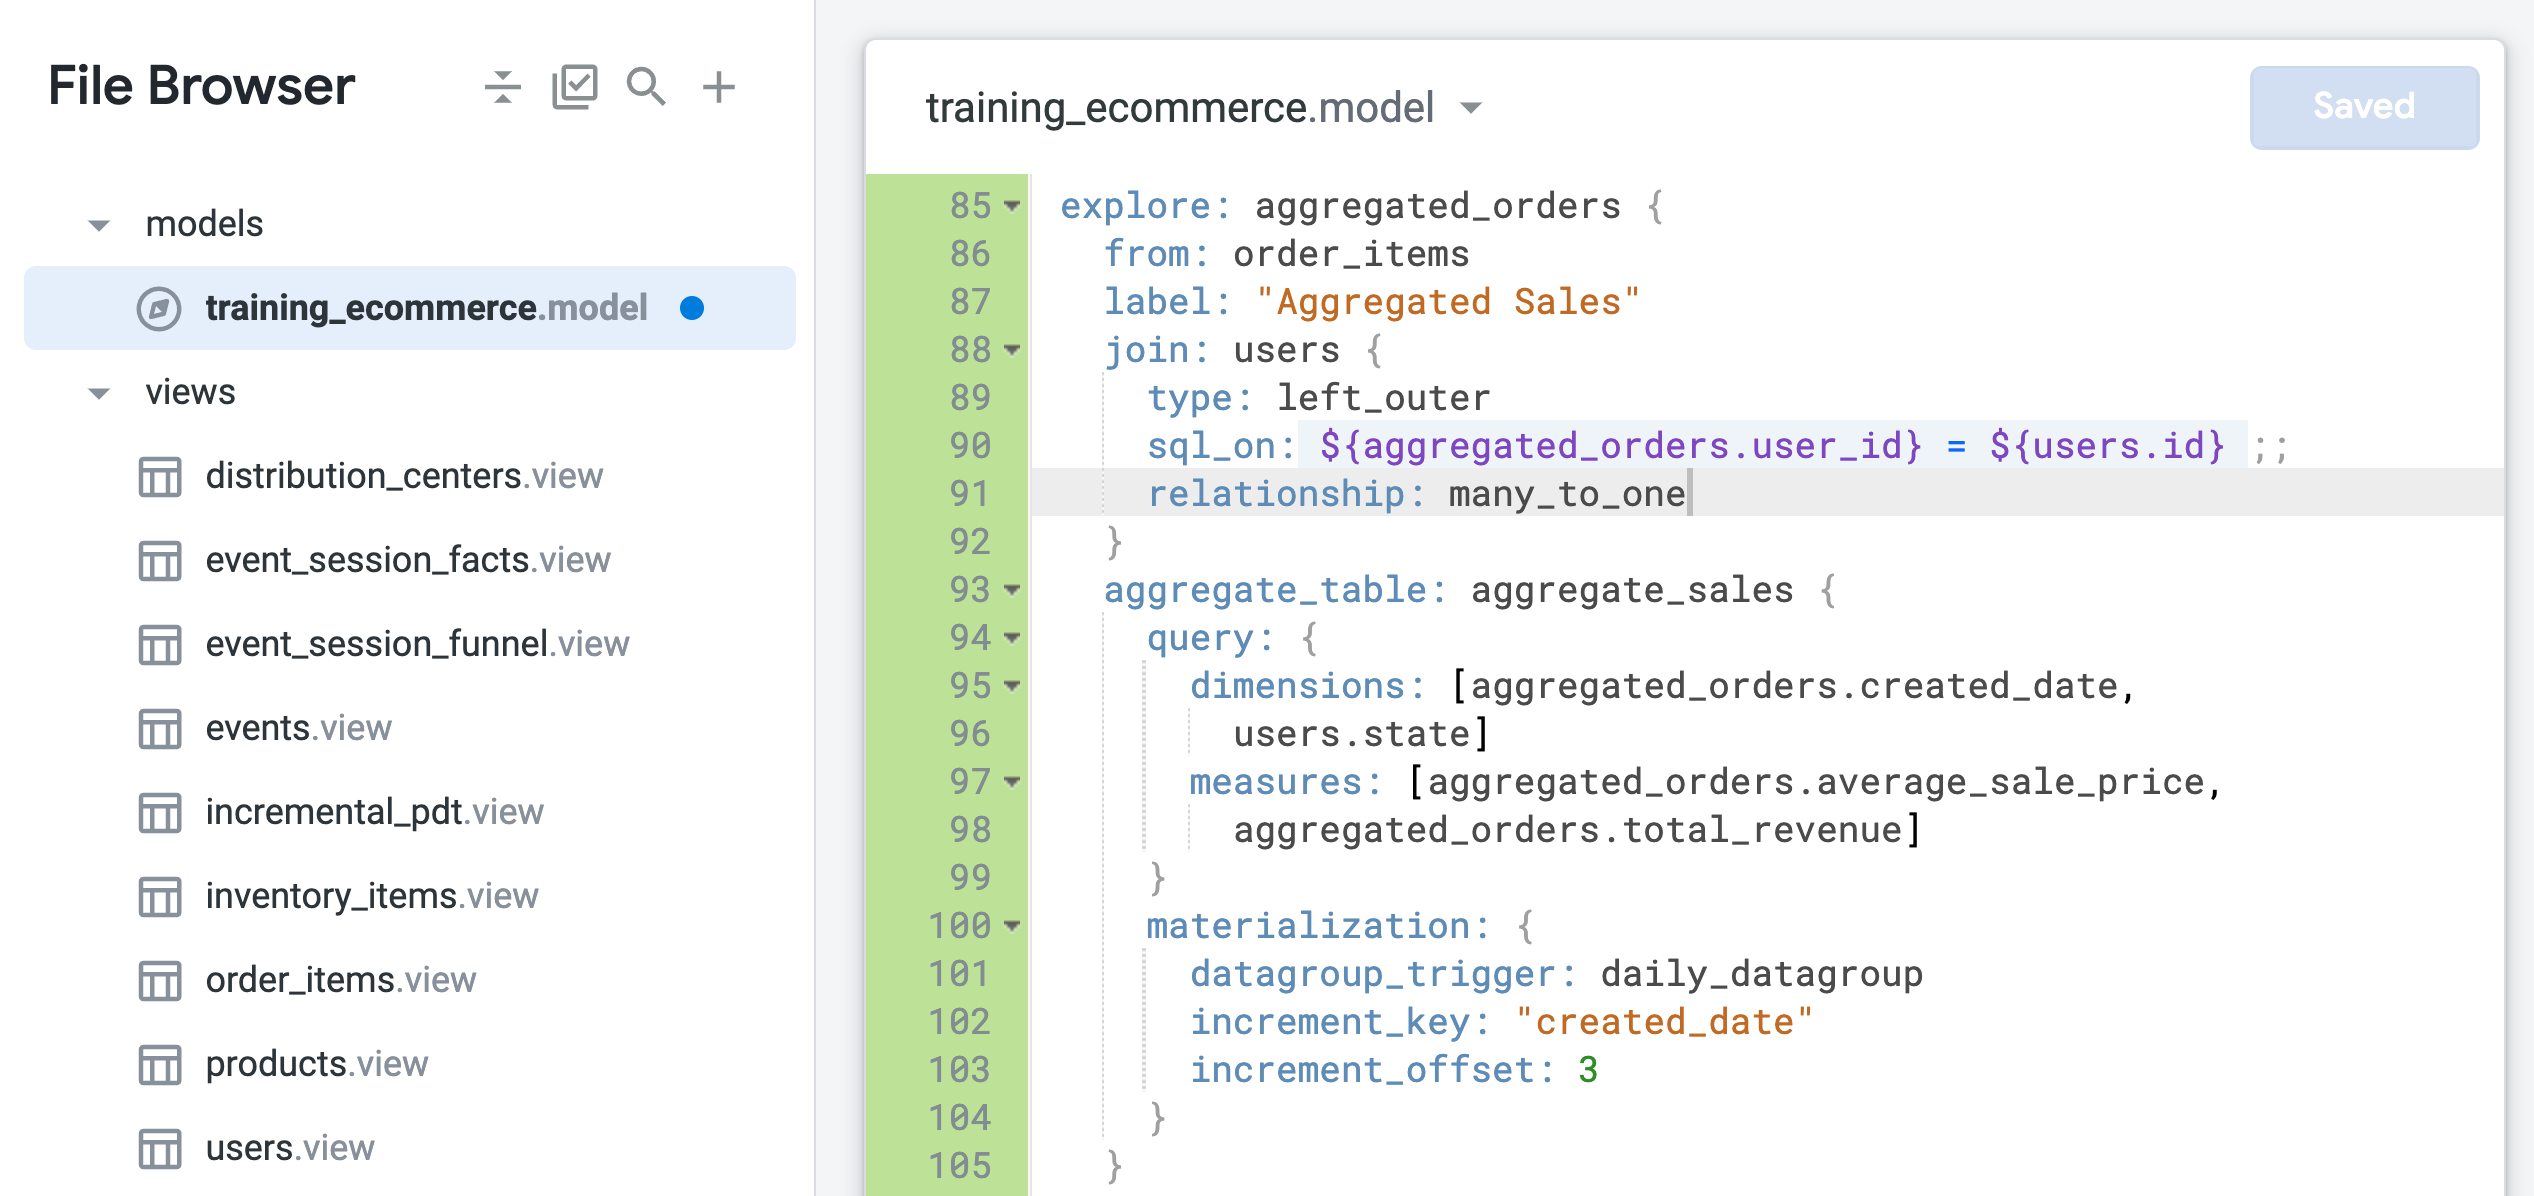
Update the relationship parameter to
many_to_one(line 91) in the aggregated_orders explore:
- Click Save Changes.
Your file should resemble the following:
-
Return to the browser tab for the Explore query, and refresh the page.
-
In the Data pane, open the SQL tab.
Similar to the SQL tab for Tasks 1 and 2, there are now two queries: the first to generate the PDT and the second to retrieve results from the PDT.
- Open the Results tab to see the results.
-
Close the browser tab for the Explore query, and return to the browser tab with the Looker IDE.
-
Click Validate LookML.
There should be no LookML errors.
Commit changes and deploy to production
-
Click Validate LookML and then click Commit Changes & Push.
-
Add a commit message and click Commit.
-
Lastly, click Deploy to Production.
Remain in the browser tab for the Looker IDE as you begin the next task.
Click Check my progress to verify the objective.
Task 4. Monitor the builds of persistent derived tables in a Looker instance
Looker provides the ability to monitor the builds of PDTs in a Looker instance via the Persistent Derived Tables page of the Admin menu. Depending on the Looker configuration, Looker users with privileges to persist tables can view this page even without access to the full Admin menu. You can check the status, build times, and caching of PDTs in both your development and production environments so that you can easily test and monitor PDTs in your Looker instance.
In this task, you monitor the PDTs created in this lab with respect to status, build time, caching, and production versus development. The incremental PDT created from NDT (Task 1) should have the longest build time, and aggregate tables (Tasks 2 and 3) should have the shortest build times. This is because they use the same table definition but are included in differently configured Explores. You also modify a PDT in development and monitor its status before and after pushing to production.
Review the status of PDTs in production
-
Open a new Looker window in a new browser tab.
-
Navigate to Admin > Persistent Derived Tables.
No PDTs are listed in the Development tab because all of your PDTs have been pushed to production. -
Open the Production tab to see the PDTs you created in Tasks 1-3.
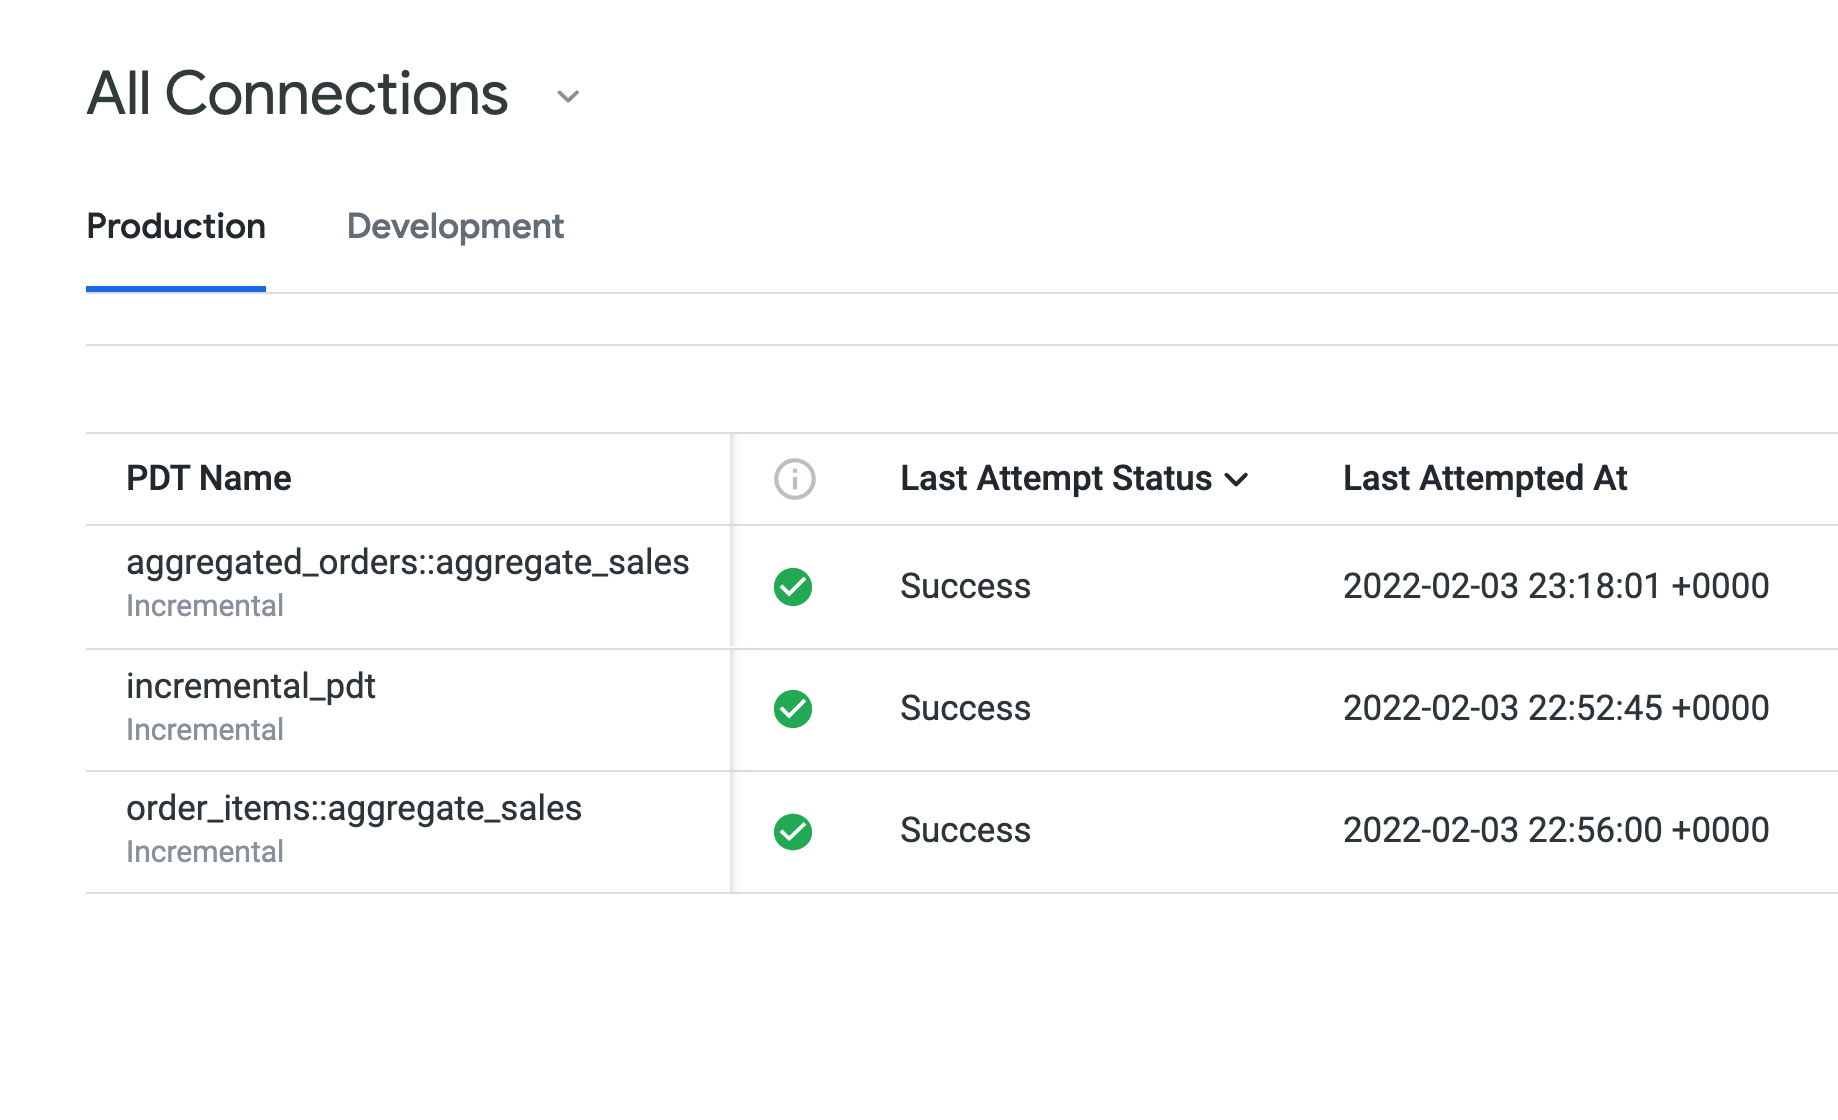
The Last Attempt Status displays Success for all the PDTs, and they are all using the same persistence rule (daily_datagroup). For the build time under the Last Build Duration, the incremental_pdt probably has a slightly longer build than the two aggregate tables.
Leave this Persistent Derived Tables page open as you begin the next steps.
Modify and review PDTs in development
-
Return to the browser tab with the Looker IDE.
-
Open training_ecommerce.model.
-
Add a new dimension for
users.countryto the aggregated_orders Explore (around line 96):
-
Click Save Changes.
-
Return to the Persistent Derived Tables page, and refresh the page.
In the Production tab, aggregated_orders::aggregate_sales PDT is still listed as built, even though you modified the LookML code for the PDT in development mode.
Looker allows developers to test changes to PDTs in development mode, similar to how developers would work with other Looker objects in development mode. For example, when developers create new dimensions and measures in development mode, these new objects do not show up in production until the developer commits the changes and deploys them to production.
- Open the Development tab.
-
Leave this Persistent Derived Tables page open, and open a new Looker window in a new browser tab.
-
Navigate to Explore > Aggregate Sales.
-
In the Data pane, open the SQL tab.
-
Under Users > Dimensions, select Country.
-
Under Aggregated Orders > Measures, select:
- Average Sale Price
- Total Revenue
There are two queries in the SQL tab: the first generates the PDT, and the second retrieves the results from the newly built PDT.
-
Click Run.
-
Open the Results tab to see the results.
-
Close the browser tab for the Explore query, return to the browser tab with the Persistent Derived Tables page, and refresh the page.
The Development tab now shows that aggregated_orders::aggregate_sales has been built successfully.
-
Leave the browser tab for the Persistent Derived Tables page open, and return to the browser tab with the Looker IDE.
-
Click Validate LookML.
There are no LookML errors.
Commit changes and deploy to production
-
Click Validate LookML and then click Commit Changes & Push.
-
Add a commit message and click Commit.
-
Lastly, click Deploy to Production.
Return to the browser tab with the Persistent Derived Tables page, and refresh the page. Now that the changes to production have been deployed, the aggregated_orders::aggregate_sales PDT is no longer listed in the Development tab and instead is listed only in the Production tab.
Congratulations!
In this lab, you learned when and how to add persistence and incremental updates to derived tables, use aggregate awareness, join views in a performant manner, and monitor the builds of PDTs to optimize Looker queries.
Finish your quest
This self-paced lab is part of the Manage Data Models in Looker quest. A quest is a series of related labs that form a learning path. Completing this quest earns you a badge to recognize your achievement. You can make your badge or badges public and link to them in your online resume or social media account. Enroll in any quest that contains this lab and get immediate completion credit. See the Google Cloud Skills Boost catalog to see all available quests.
Next steps/ Learn more
- For more information about PDTs, see the Persistent Derived Tables Documentation.
- For more information about Incremental PDTs, see the Incremental PDT Documentation.
- Learn more about Aggregate Awareness.
Google Cloud training and certification
...helps you make the most of Google Cloud technologies. Our classes include technical skills and best practices to help you get up to speed quickly and continue your learning journey. We offer fundamental to advanced level training, with on-demand, live, and virtual options to suit your busy schedule. Certifications help you validate and prove your skill and expertise in Google Cloud technologies.
Manual Last Updated October 6, 2023
Lab Last Tested October 6, 2023
Copyright 2024 Google LLC All rights reserved. Google and the Google logo are trademarks of Google LLC. All other company and product names may be trademarks of the respective companies with which they are associated.