In this exercise, you generate log entries from an application, filter and analyze logs in Cloud Logging, and export logs to a BigQuery log sink.
Objectives
In this lab, you learn how to perform the following tasks:
Set up and deploy a test application.
Explore the log entries generated by the test application.
Create and use a logs-based metric.
Export application logs to BigQuery.
Setup and requirements
In this task, you use Qwiklabs and perform initialization steps for your lab.
For each lab, you get a new Google Cloud project and set of resources for a fixed time at no cost.
Sign in to Qwiklabs using an incognito window.
Note the lab's access time (for example, 1:15:00), and make sure you can finish within that time.
There is no pause feature. You can restart if needed, but you have to start at the beginning.
When ready, click Start lab.
Note your lab credentials (Username and Password). You will use them to sign in to the Google Cloud Console.
Click Open Google Console.
Click Use another account and copy/paste credentials for this lab into the prompts.
If you use other credentials, you'll receive errors or incur charges.
Accept the terms and skip the recovery resource page.
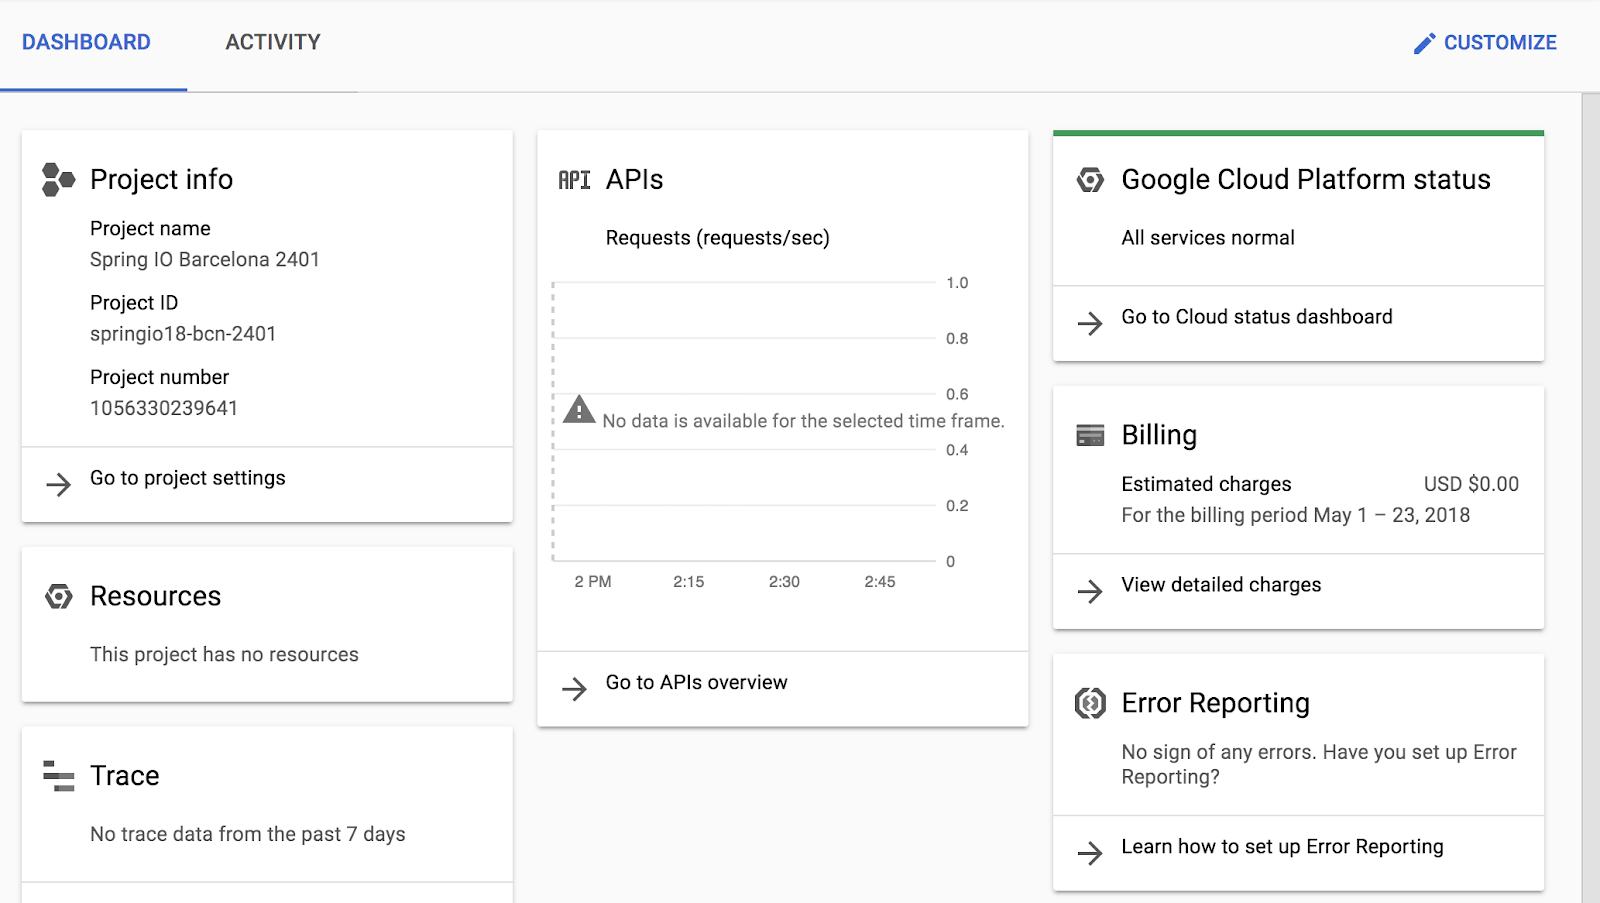
After you complete the initial sign-in steps, the project dashboard appears.
Activate Google Cloud Shell
Google Cloud Shell is a virtual machine that is loaded with development tools. It offers a persistent 5GB home directory and runs on the Google Cloud.
Google Cloud Shell provides command-line access to your Google Cloud resources.
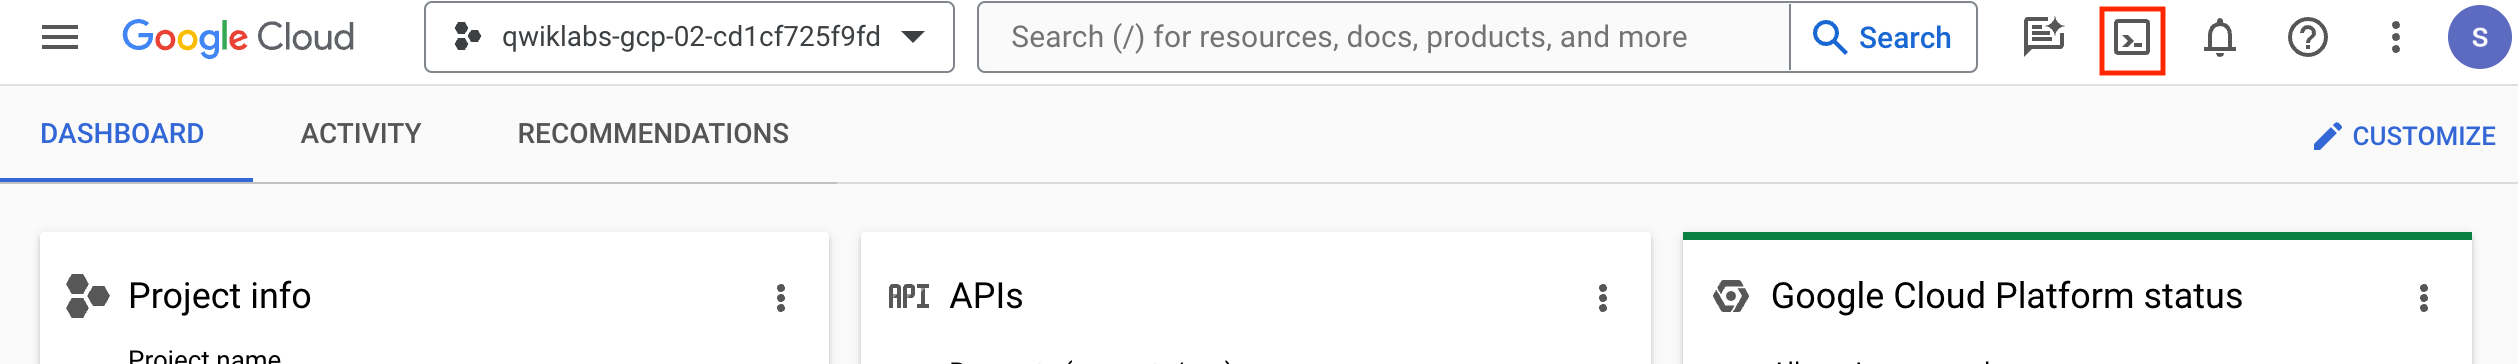
In Cloud console, on the top right toolbar, click the Open Cloud Shell button.
Click Continue.
It takes a few moments to provision and connect to the environment. When you are connected, you are already authenticated, and the project is set to your PROJECT_ID. For example:
gcloud is the command-line tool for Google Cloud. It comes pre-installed on Cloud Shell and supports tab-completion.
You can list the active account name with this command:
[core]
project = qwiklabs-gcp-44776a13dea667a6
Note:
Full documentation of gcloud is available in the
gcloud CLI overview guide
.
Task 1. Set up a test application, deploy it, and set up a load test VM
To experiment with logging, log exporting, and Error Reporting, we will deploy the HelloLoggingNodeJS application we used in a previous exercise to Cloud Run.
Make sure the Cloud Build, Compute Engine, and Cloud Run APIs are enabled, as it is needed in later steps:
This repository contains a basic Node.js application used for testing.
Change into the HelloLoggingNodeJS folder and open the index.js in the Cloud Shell editor:
cd HelloLoggingNodeJS
edit index.js
If an error indicates that the code editor could not be loaded because third-party cookies are disabled, click Open in New Window and switch to the new tab.
Take a few minutes to peruse the code. You may recognize this code from some of the examples in the lecture module.
Notice that it loads the Google Error Reporting library as well as the debugging library.
Scroll lower and there are several methods that generate logs, errors, and error logs.
Pay special attention to /random-error. It generates an error approximately every 1000 requests. In the next step you change this to 20 requests to increase the frquency of seeing an error.
To increase the uncaught exception /random-error from 1 in 1000 to 1 in 20. Open the index.js in the Cloud Shell editor.
In the index.js file, replace line 125 - 135 with the following:
//Generates an uncaught exception every 20 requests
app.get('/random-error', (req, res) => {
error_rate = parseInt(req.query.error_rate) || 20
let errorNum = (Math.floor(Math.random() * error_rate) + 1);
if (errorNum==1) {
console.log("Called /random-error, and it's about to error");
doesNotExist();
}
console.log("Called /random-error, and it worked");
res.send("Worked this time.");
});
In the editor, also take a look at the rebuildService.sh file. This file uses Cloud Build to create a Docker container, then it creates (or updates) a Cloud Run application using the container. The Cloud Run service supports anonymous access, has a couple of labels on it for stage and department, and only allows a maximum of 5 concurrent connections to any one execution instance.
Return to the Cloud Shell window. If the Cloud Shell is not visible, click Open Terminal.
Build the container and start the Cloud Run application by executing the file:
sh rebuildService.sh
It takes a minute or two for this to complete.
In Cloud Shell, the final message contains the URL to your new service. Click the link to test the application in a new tab. It returns a simple Hello World! response.
In the Cloud Shell terminal window, create a new URL environmental variable and set its value to the URL to your application:
URL=$(gcloud run services list --platform managed --format="value(URL)" | grep hello-logging)
Test that the variable was created correctly by echoing its value:
echo $URL
Use a bash while loop to generate load on the application's random-error route. Make sure you see the mostly "Worked this time" messages start to appear. If they don't, then double check that your application is running and that the URL property is properly set:
while true; \
do curl -s $URL/random-error \
-w '\n' ;sleep .1s;done
Task 2. Explore the log files for a test application
You have an application now deployed to Cloud Run which, depending on the URL, can simply log, log through Winston, or generate error reports. Take a few minutes to explore those logs.
In the Google Cloud Console, use the Navigation menu () to navigate to Logging > Log Explorer.
Enable Show query and erase if any query is there by default.
Use the Resource drop-down menu to select the Cloud Run Revision > hello-logging Cloud Run service. Don't forget to Apply your selection, or it won't actually filter by that resource.
Click Run query.
Most likely you see nothing but successful 200 messages. How can you find the errors? One way is to exclude all of the 200 responses and see what's left.
To do that, click one of the 200 status codes and select Hide matching entries.
While not perfect, you are able to find log messages tied to the error, and the stack traces generated by the error happening.
Use the Log fields to filter the display to only messages with a Severity of Error.
Now you see the responses when an error was thrown.
Expand and explore one of the entries. Note which log file contains the 500 errors, and when you are finished, Clear the Error severity filter.
To see the stack traces, which is what a developer might be most interested in, use the Log fields to filter on the run.googleapis.com/stderr standard error log.
That does show the exceptions, but where does each one start?
It is nice to see both the stderr log with the stack traces, and the requests log with the 500 status errors, to do so:
Click the Query builderand select Log name.
Select both the Cloud Run requests and stderr logs, and then Apply them to the query.
Select Run Query.
Note: You need to wait for 10-12 minutes for the 500 status errors to appear.
Take a moment to explore the displayed logs. Now you see the response returning the error to the client request, and the subsequent stack trace sent to stderr.
Task 3. Create and use a logs-based metric
You just looked at the log file for the Cloud Run service and examined an error entry, but what if you were doing some custom logging, not necessarily error related, and wanted to create a custom metric based on it? In this portion of the exercise, you change the loop to call the /score route, and then create a metric from the scores that are coming through.
In this task, you:
Generate some load on the /score endpoint.
Explore the logs generated by the load.
Tweak the code to put the message in a more usable format.
Create a new logs-based metric.
Generate some load on the /score endpoint
Switch to or reopen Cloud Shell.
Use CTRL+C to break your test loop.
Modify the while loop to call the /score route, and restart the loop. Verify that the new messages are displaying random scores:
while true; \
do curl -s $URL/score \
-w '\n' ;sleep .1s;done
Explore the logs generated by the load
Switch to your Google Cloud Console and reopen the Logging > Logs Explorer page.
Clear any existing query and use the Resource to display your Cloud Run Revision > hello-logging logs.
Click Apply.
Select Run Query.
All of the 200 status code entries should be from this latest test run. If not, refresh your logs view by clicking Jump to Now.
Expand one of the 200 status code entries.
How can you tell if it's from a /score request? Why isn't the score displaying in the log entry?
Use the Logs field explorer to filter on the run.googleapis.com/stdout log.
Now you should see all of the messages printed by the code itself. Why would it be difficult to build a metric displaying the scores for this entry?
It would be better if the messages were generated as structured JSON, rather than unstructured text. That way you could easily access and extract just the scores in our logs-based metric.
In the Cloud Shell terminal window, use CTRL+C to break the test while loop.
Tweak the log format to make the score easier to access
Open the index.js file in the Cloud Shell editor and locate the code for the /score route (around line 90).
Replace the /score route with the below code:
//Basic NodeJS app built with the express server
app.get('/score', (req, res) => {
//Random score, the contaierID is a UUID unique to each
//runtime container (testing was done in Cloud Run).
//funFactor is a random number 1-100
let score = Math.floor(Math.random() * 100) + 1;
let output = {
message: '/score called',
score: score,
containerID: containerID,
funFactor: funFactor
};
console.log(JSON.stringify(output));
//Basic message back to browser
res.send(`Your score is a ${score}. Happy?`);
});
Notice how the message contents are now properties of the output object, and how the printed message is the JSON object stringified.
Since you modified the code, make sure you didn't introduce any errors by starting the application locally in Cloud Shell.
In the Cloud Shell terminal window, install the dependencies and start the application. Make sure you are in the HelloLoggingNodeJS folder:
export GCLOUD_PROJECT=$DEVSHELL_PROJECT_ID
cd ~/HelloLoggingNodeJS/
npm i
npm start
If you see a "Hello world listening on port 8080 message," use CTRL+C to stop the application and move on to the next step. If you see any errors, fix them and make sure the application starts before continuing.
Rebuild and redeploy the application by rerunning rebuildService.sh:
sh rebuildService.sh
Wait for the application to finish rebuilding and redeploying, then restart the test loop:
while true; \
do curl -s $URL/score \
-w '\n' ;sleep .1s;done
Make sure you see the score messages appearing once again.
Switch to your browser tab showing the Logs Explorer and display the latest logs by clicking Jump to Now.
You should still have the entries filtered to display the Cloud Run stdout logs for hello-logging.
Expand one of the entries and examine the new format.
Create a score logs-based metric
Click Create Metric and set the following fields with the mentioned values:
Metric Type: Distribution
Log metric name: score_averages
Units: 1
Field name: jsonPayload.score
Click ADVANCED link and set the following fields with the mentioned values:
Type : Linear
Start value: 0
Number of buckets: 20
Bucket width: 5
Click Create Metric.
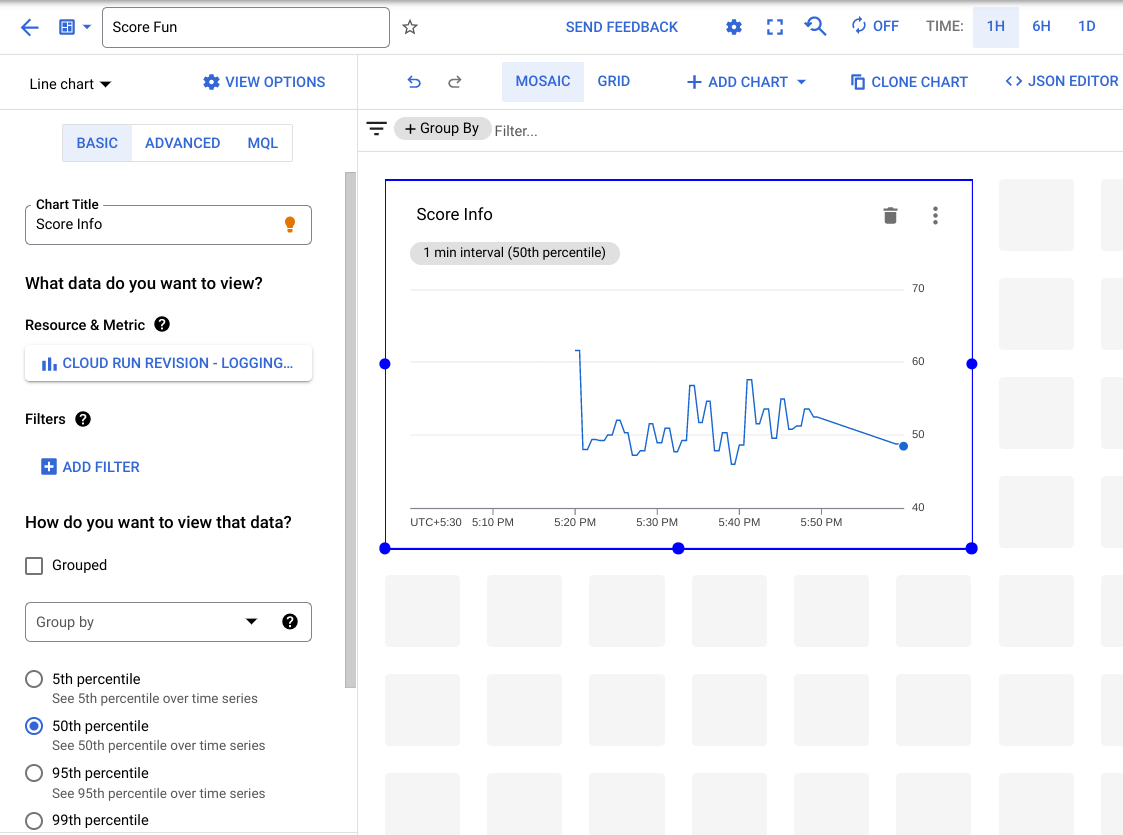
Use the Navigation menu () to switch Monitoring > Dashboards. You may have to wait while the workspace is created.
Click +Create Dashboard.
For New Dashboard Name, type Score Fun.
Click Line chart.
Set the Chart Title to Score Info.
Under Resource & Metric section, select Cloud Run Revision > Logs-Based Metric > logging/user/score_averages.
Click Apply.
The aligner was set by default to 50th percentile, if not, set it to 50th percentile (median).
Task 4. Export application logs to BigQuery
Exporting logs to BigQuery not only allows them to be stored for longer, but it also gives the ability to analyze them with SQL and the sheer power of BigQuery. In this task, you configure an export for the Cloud Run logs to BigQuery, and use it to find the error messages generated by the random-error application route.
In this task, you:
Configure a log export to BigQuery.
Configure an Export Sink to BigQuery
Switch to the Cloud Shell window with the while loop sending load to our application, and use CTRL+C to break the loop.
Modify the while to once again send load to the random-error route. Re-execute the loop:
while true; \
do curl -s $URL/random-error \
-w '\n' ;sleep .1s;done
Use the Google Cloud Console Navigation menu to navigate to Logging > Logs Explorer.
Delete any existing query and execute a query filtering the Resource to Cloud Run Revision > hello-logging.
Click Apply.
Expand an entry or two and verify that they relate to the /random-error requests.
Create a sink using More actions > Create Sink.
Configure the Sink name as hello-logging-sink.
Click Next.
Set the sink service to BigQuery dataset.
Select Create new BigQuery dataset for Bigquery dataset.
Name the Dataset ID as hello_logging_logs.
Click CREATE DATASET.
Click Next.
For Choose logs to include in sink, click Next.
Click CREATE SINK. When you Create Sink, notice how it creates a service account which is used to write to the new BigQuery dataset.
Use the Navigation menu to switch to BigQuery.
In the Explorer section, expand your projects node and the hello_logging_logs dataset.
Click the requests table.
In the tabbed dialog below the query window, click the Preview tab and explore the information in this log. This contains general request-oriented information. What URL was requested, when, and from where.
Click the Schema tab and take a moment to investigate the schema of the table generated. Notice that nested and repeated data structures are used for columns like resource and httpRequest.
Select the stderr table.
Standard out and Standard error are commonly used by applications to differentiate between simple log messages and messages that are related to an error. Node.js applications will dump any uncaught exception/error related information to standard error.
Note: Wait for 5~10 minutes, if the stderr table doesn't appear.
Once again, Preview the data in the table. Now you are seeing the random errors as they impact different parts of the request call stack. The entries with a textPayload that contain ReferenceError are the real errors itself.
Click the Schema tab and investigate the actual structure of the table. Once again, you see the mix of standard, and nested, repeated fields.
Create and execute a query to pull just the textPayloads that start with ReferenceError:
Start the query by clicking the Query button.
Modify the SELECT so it pulls the textPayload.
Add the where clause.
Replace [project-id] with your GCP project ID and [date] with your date specified in the table name:
SELECT
textPayload
FROM
`[project-id].hello_logging_logs.run_googleapis_com_stderr_[date]`
WHERE
textPayload LIKE 'ReferenceError%'
To do a count, modify the query to count these entries:
Execute again and check the number you are receiving.
Replace [project-id] with your GCP project ID and [date] with your date specified in the table name:
SELECT
count(textPayload)
FROM
`[project-id].hello_logging_logs.run_googleapis_com_stderr_[date]`
WHERE
textPayload LIKE 'ReferenceError%'
To check the error percentage, build a query that compares the total requests to the ReferenceError% requests.
Replace [project-id] with your GCP project ID and [date] with your date specified in the table name.
Is the error about 1/1000?
SELECT
errors / total_requests
FROM (
SELECT
(
SELECT
COUNT(*)
FROM
`[project-id].hello_logging_logs.run_googleapis_com_requests_[date]`) AS total_requests,
(
SELECT
COUNT(textPayload)
FROM
`[project-id].hello_logging_logs.run_googleapis_com_stderr_[date]`
WHERE
textPayload LIKE 'ReferenceError%') AS errors)
Congratulations!
In this exercise, you used a test application to generate logs, created logs-based metrics using data from those logs, and exported logs to BigQuery. Nice job.
End your lab
When you have completed your lab, click End Lab. Google Cloud Skills Boost removes the resources you’ve used and cleans the account for you.
You will be given an opportunity to rate the lab experience. Select the applicable number of stars, type a comment, and then click Submit.
The number of stars indicates the following:
1 star = Very dissatisfied
2 stars = Dissatisfied
3 stars = Neutral
4 stars = Satisfied
5 stars = Very satisfied
You can close the dialog box if you don't want to provide feedback.
For feedback, suggestions, or corrections, please use the Support tab.
Copyright 2022 Google LLC All rights reserved. Google and the Google logo are trademarks of Google LLC. All other company and product names may be trademarks of the respective companies with which they are associated.
Les ateliers créent un projet Google Cloud et des ressources pour une durée déterminée.
Les ateliers doivent être effectués dans le délai imparti et ne peuvent pas être mis en pause. Si vous quittez l'atelier, vous devrez le recommencer depuis le début.
En haut à gauche de l'écran, cliquez sur Démarrer l'atelier pour commencer.
Utilisez la navigation privée
Copiez le nom d'utilisateur et le mot de passe fournis pour l'atelier
Cliquez sur Ouvrir la console en navigation privée
Connectez-vous à la console
Connectez-vous à l'aide des identifiants qui vous ont été attribués pour l'atelier. L'utilisation d'autres identifiants peut entraîner des erreurs ou des frais.
Acceptez les conditions d'utilisation et ignorez la page concernant les ressources de récupération des données.
Ne cliquez pas sur Terminer l'atelier, à moins que vous n'ayez terminé l'atelier ou que vous ne vouliez le recommencer, car cela effacera votre travail et supprimera le projet.
Ce contenu n'est pas disponible pour le moment
Nous vous préviendrons par e-mail lorsqu'il sera disponible
Parfait !
Nous vous contacterons par e-mail s'il devient disponible
Un atelier à la fois
Confirmez pour mettre fin à tous les ateliers existants et démarrer celui-ci
Utilisez la navigation privée pour effectuer l'atelier
Ouvrez une fenêtre de navigateur en mode navigation privée pour effectuer cet atelier. Vous éviterez ainsi les conflits entre votre compte personnel et le compte temporaire de participant, qui pourraient entraîner des frais supplémentaires facturés sur votre compte personnel.
In this exercises you will learn to generate logging messages from an application, filter and analyze logs, and track and fix reported errors.
Durée :
0 min de configuration
·
Accessible pendant 90 min
·
Terminé après 90 min

 ) to navigate to Logging > Log Explorer.