

Before you begin
- Labs create a Google Cloud project and resources for a fixed time
- Labs have a time limit and no pause feature. If you end the lab, you'll have to restart from the beginning.
- On the top left of your screen, click Start lab to begin
Google Cloud has a number of compute-related resources including Compute Engine, Kubernetes, and Cloud Run. In this exercise, you install the logging and monitoring agents into a VM running a Nginx server to maximize the metrics to easily view. You also set up a Kubernetes cluster and monitor an application deployed into it.
In this lab, you learn how to perform the following tasks:
For each lab, you get a new Google Cloud project and set of resources for a fixed time at no cost.
Sign in to Qwiklabs using an incognito window.
Note the lab's access time (for example, 1:15:00), and make sure you can finish within that time.
There is no pause feature. You can restart if needed, but you have to start at the beginning.
When ready, click Start lab.
Note your lab credentials (Username and Password). You will use them to sign in to the Google Cloud Console.
Click Open Google Console.
Click Use another account and copy/paste credentials for this lab into the prompts.
If you use other credentials, you'll receive errors or incur charges.
Accept the terms and skip the recovery resource page.
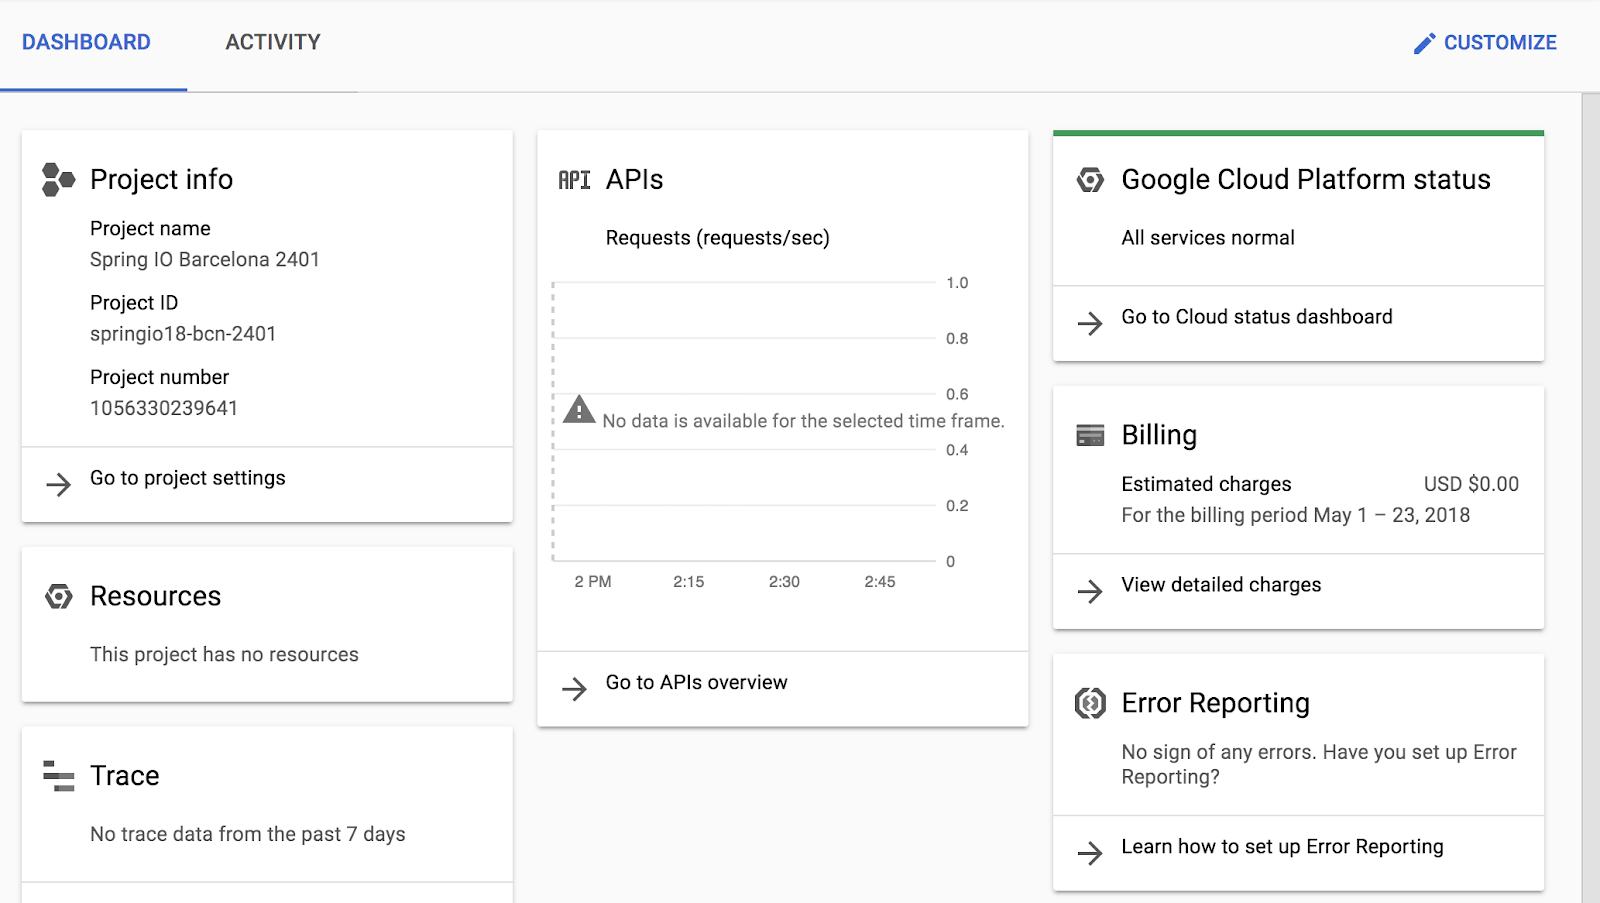
After you complete the initial sign-in steps, the project dashboard appears.
Google Cloud Shell is a virtual machine that is loaded with development tools. It offers a persistent 5GB home directory and runs on the Google Cloud.
Google Cloud Shell provides command-line access to your Google Cloud resources.
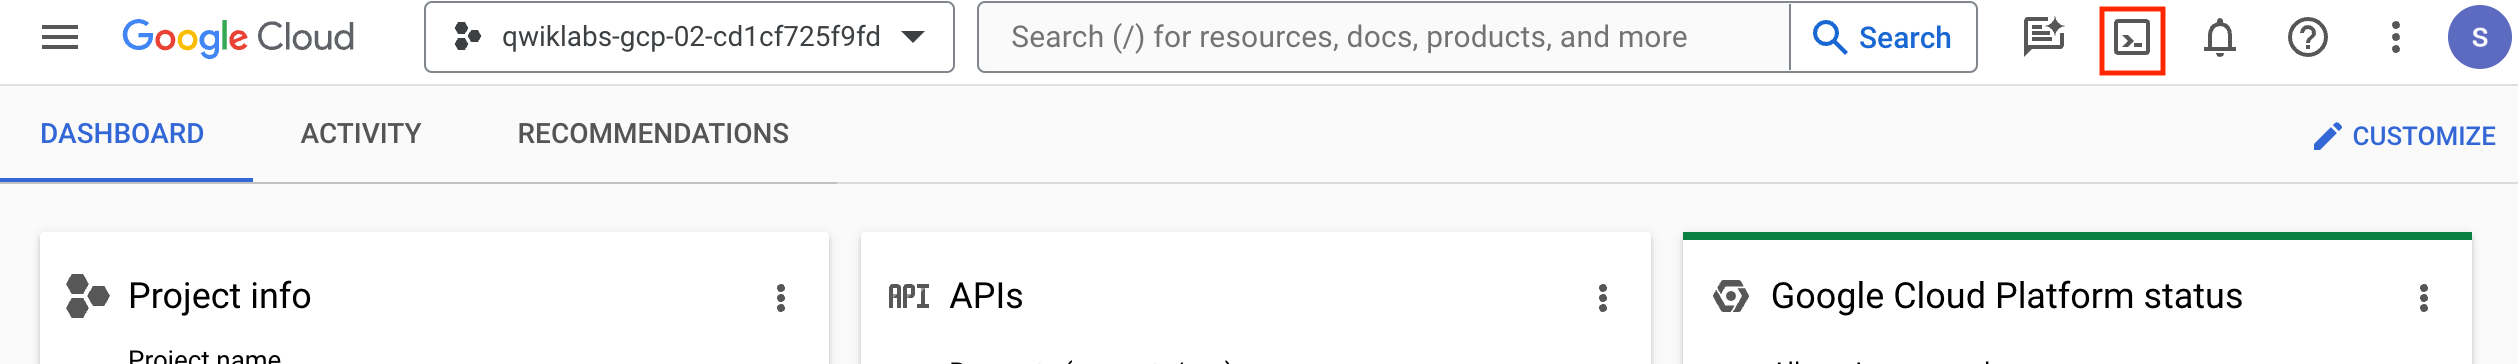
In Cloud console, on the top right toolbar, click the Open Cloud Shell button.
Click Continue.
It takes a few moments to provision and connect to the environment. When you are connected, you are already authenticated, and the project is set to your PROJECT_ID. For example:
gcloud is the command-line tool for Google Cloud. It comes pre-installed on Cloud Shell and supports tab-completion.
Output:
Example output:
Output:
Example output:
In this task, you:
In the Cloud Console, select Navigation menu > Compute Engine > VM instances, then click Create Instance.
Set the following fields:
Click OS and storage.
If the Image shown is not Debian GNU/Linux 11 (bullseye), click Change and select Debian GNU/Linux 11 (bullseye), and then click Select.
Click Networking.
For Firewall, click Allow HTTP traffic.
Leave the rest of the fields at their default values and click Create.
To explore a little of what Google Kubernetes Engine offers in the way of logging and monitoring, let's add a cluster, which will come with logging and monitoring enabled by default.
Use the Navigation menu to navigate to the Kubernetes Engine > Clusters page.
Click Create and then click on the Switch to Standard Cluster. Confirm Switch to Standard Cluster.
Set the Name to gke-cluster and Zone to
Verify that Enable Logging is checked and dropbox is set to System and Workloads also verify Enable Cloud Monitoring is checked and System is selected by default in the dropdown, and then press Create.
Once you see the cluster creation start, move on to the next step.
Switch back to Compute Engine and SSH into the web-server-vm.
Use APT to install Nginx:
Enter Y when prompted.
Verify that Nginx installed and is running:
Switch back to Compute Engine and if you enabled the HTTP access firewall rule, then you should be able to click the external IP. Do so and make sure the Nginx server is up and running.
Copy the URL to the server.
Change to the Cloud Shell terminal window.
Create a URL environmental variable and set it equal to the URL to your server:
while loop to place some load on the server. Make sure you are seeing the Welcome to nginx responses:In this task, you:
A standard Debian Linux image from Google will not have the logging or monitoring agents installed, so you won't have access to metrics from googleapis.com/nginx/ such as:
Switch to the Google Console window and navigate to Monitoring > Overview.
Wait for the monitoring workspace to create, and then navigate to Metrics explorer.
Click on Select a metric dropdown and select VM Instance > Instance > CPU utilization.
Click Apply, and set the Filter to instance_name = web-server-vm.
You may not see a spike when you apply the load, since it's not a big load, but you are able to access the metric.
Delete the Filter and the Metric.
Click on Select a metric dropdown and deselect Active.
Select VM Instance > nginx > Requests. Click Apply.
Why is there no data?
The data for Nginx requests is missing because without the logging and monitoring agents being installed, the best Google Cloud can do is black-box monitoring. If you want to see more details, then you need to enable white-box monitoring by installing the agents.
Use the Navigation menu to navigate to Compute Engine > VM instances.
Click the SSH link for the web-server-vm.
Check to see if the logging agent is installed/running:
Not surprisingly, the services could not be found.
Note in the response the logging.write and monitoring.write scopes.
Download the script, add the monitoring agent repo to apt, and install the agent.
CTRL+C and move on to the next step:Now that the agents are installed and the Nginx plugins have been added, retest the Nginx metric that we examined earlier.
Check the Cloud Shell window and verify that the test loop is still running, and that you are still receiving responses. If not, reset the URL property and restart the while.
Navigate to the Monitoring > Metrics explorer.
Click on Select a metric dropdown and select VM Instance > nginx > Requests, then click Apply.
You may have to wait a few minutes and refresh the page, but you should soon see metric data coming in from Nginx. The monitoring agent is working as it should.
You created a GKE cluster with logging and monitoring enabled earlier in this exercise. Now, load the HelloLoggingNodeJS application to it, put it behind a load balancer service, and view some metrics for your cluster.
Switch to or reopen the Cloud Shell console.
Break the running test loop with CTRL+C.
Enable the Cloud Build API as it is needed in a few steps:
https://github.com/haggman/HelloLoggingNodeJS.git repo:This repository contains a basic Node.js web application that is used for testing.
HelloLoggingNodeJS folder and open the index.js in the Cloud Shell editor:Take a few minutes to peruse the code.
In the editor, also take a look at the buildContainer.sh file, package.json file which contains the dependencies, and the Dockerfile which plans the Docker container we generate and deploy to GKE.
Executing the file buildContainer.sh to submit the Dockerfile by Google's Cloud Build to generate a container and store it in your Artifact Registry:
In the k8sapp.yaml file, replace the $PROJECT with your actual project ID. Remember, your project ID is located on the Homepage of your Google Cloud Console and in Qwiklabs just below your temporary Google Cloud password.
Open the k8sapp.yaml file and explore the instructions to Kubernetes to create three hello-logging pods, and then expose them through a LoadBalancer service.
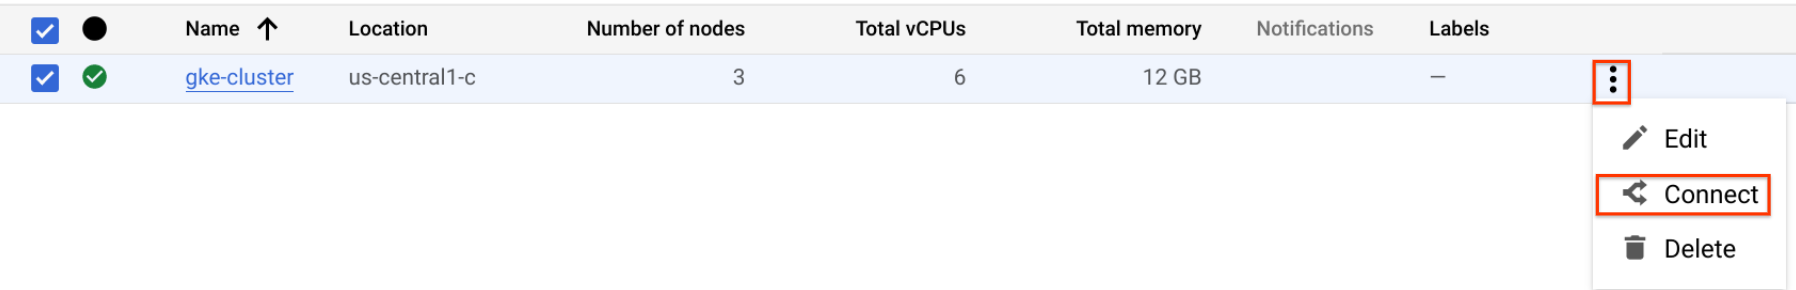
Use the Navigation menu to navigate to Kubernetes Engine, and click on the triple dot icon for your cluster and select Connect.
Copy the command line to configure kubectl.
Switch back to Cloud Shell and execute the command.
Use kubectl to apply your k8sapp.yaml.
hello-logging-service to appear. Wait for it to get an External IP:Once the service appears with the external IP, copy the external IP value.
Open a tab in the browser and paste in the IP. Make sure you see the Hello World message.
Continue to sitewhile loop. Make sure you are seeing the Hello World responses:Navigate to the Monitoring > Dashboards and open the GKE dashboard.
Click on Configuration icon next to VIEW ALL and enable Sparklines and click Apply.
On the GKE dashboard, for gke-cluster scroll horizontally and see the charts. If all of the small charts are reading No Data, refresh the page until they start showing readings for CPU and Memory Utilization. You might also want to toggle Off to On to enable auto-refresh of the data.
If you want to examine the different cluster nodes, you can scroll horizontally in Nodes tab and see that the three hello-logging-js-deployments are spread across the nodes. This tab focuses on what's running where, from Cluster, to Node, to Pod.
Switch to the Workloads tab. This is focused on the deployed workloads, grouped by namespace.
Finally, scroll to the Kubernetes Services tab and expand hello-logging-service. This view is more about how services relate to their pods.
In any of the views, if you drill all the way down to one of our hello-logging-js-containers, a right-hand window appears with details. Investigate Incidents, Metrics, and Logs.
In this exercise, you installed and used logging and monitoring agents on Compute Engine instances, and explored logging and monitoring in a GKE cluster. Nice job.
When you have completed your lab, click End Lab. Google Cloud Skills Boost removes the resources you’ve used and cleans the account for you.
You will be given an opportunity to rate the lab experience. Select the applicable number of stars, type a comment, and then click Submit.
The number of stars indicates the following:
You can close the dialog box if you don't want to provide feedback.
For feedback, suggestions, or corrections, please use the Support tab.
Copyright 2022 Google LLC All rights reserved. Google and the Google logo are trademarks of Google LLC. All other company and product names may be trademarks of the respective companies with which they are associated.


This content is not currently available
We will notify you via email when it becomes available

Great!
We will contact you via email if it becomes available

One lab at a time
Confirm to end all existing labs and start this one