

准备工作
- 实验会创建一个 Google Cloud 项目和一些资源,供您使用限定的一段时间
- 实验有时间限制,并且没有暂停功能。如果您中途结束实验,则必须重新开始。
- 在屏幕左上角,点击开始实验即可开始
Enable data access logs on Cloud Storage
/ 30
Check the creation of bucket, network and virtual machine instance
/ 30
Viewing audit logs
/ 40
In this lab, you investigate Google Cloud Audit Logs. Cloud Audit Logging maintains multiple audit logs for each project, folder, and organization, all of which help answer the question, "Who did what, when, and where?"
In this lab, you learn how to:
For each lab, you get a new Google Cloud project and set of resources for a fixed time at no cost.
Click the Start Lab button. If you need to pay for the lab, a pop-up opens for you to select your payment method. On the left is the Lab Details panel with the following:
Click Open Google Cloud console (or right-click and select Open Link in Incognito Window if you are running the Chrome browser).
The lab spins up resources, and then opens another tab that shows the Sign in page.
Tip: Arrange the tabs in separate windows, side-by-side.
If necessary, copy the Username below and paste it into the Sign in dialog.
You can also find the Username in the Lab Details panel.
Click Next.
Copy the Password below and paste it into the Welcome dialog.
You can also find the Password in the Lab Details panel.
Click Next.
Click through the subsequent pages:
After a few moments, the Google Cloud console opens in this tab.

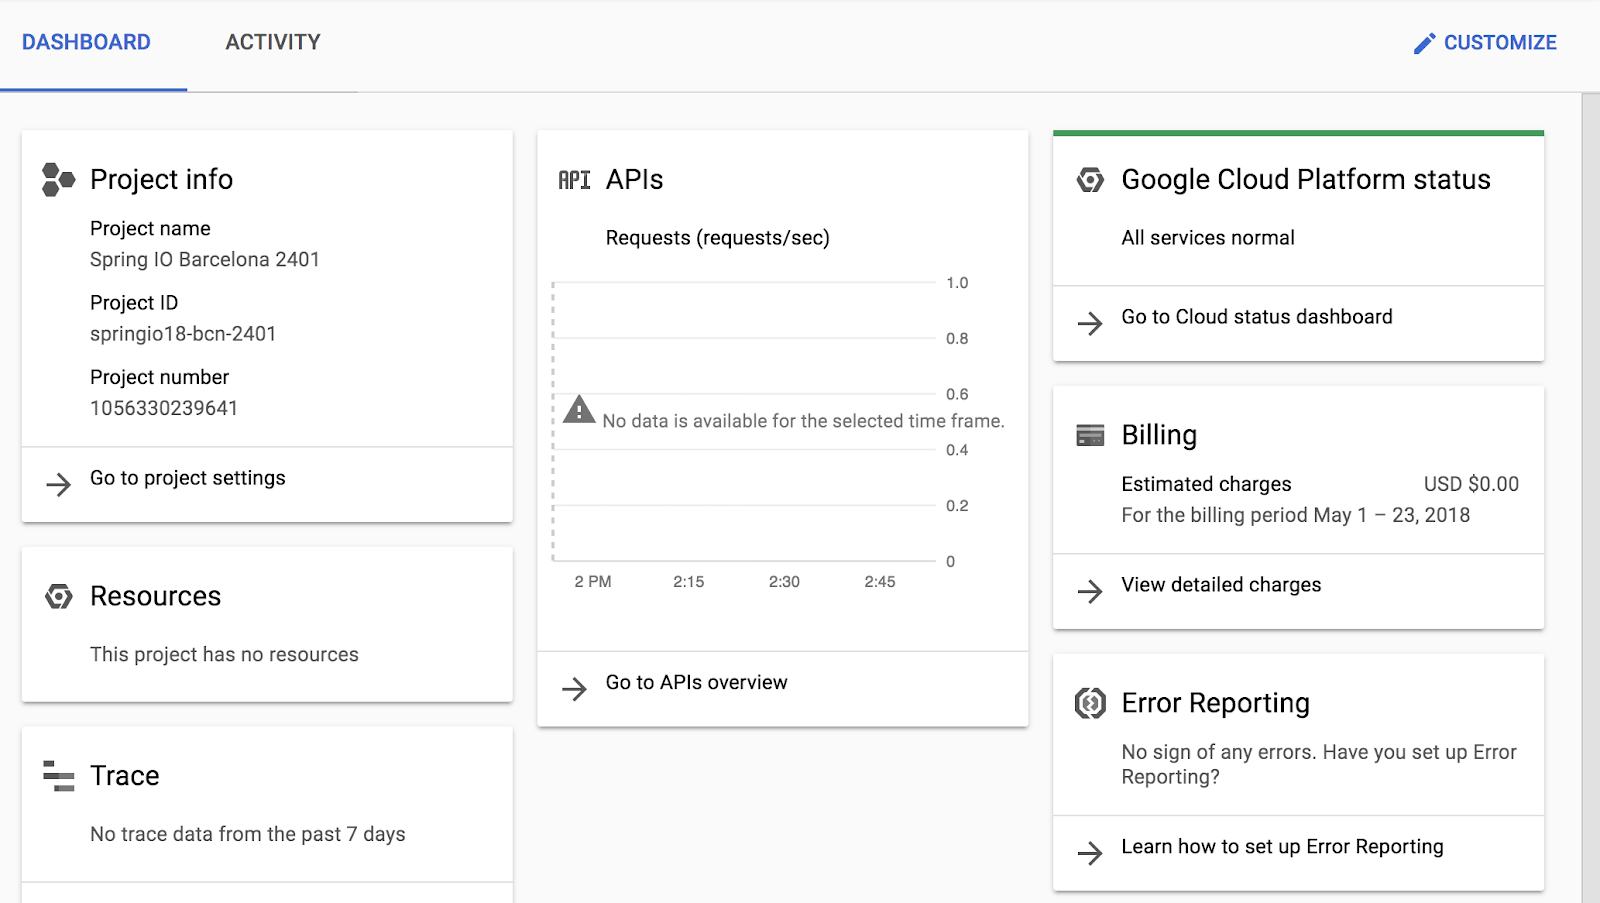
After you complete the initial sign-in steps, the project dashboard appears.
Google Cloud Shell is a virtual machine that is loaded with development tools. It offers a persistent 5GB home directory and runs on the Google Cloud.
Google Cloud Shell provides command-line access to your Google Cloud resources.
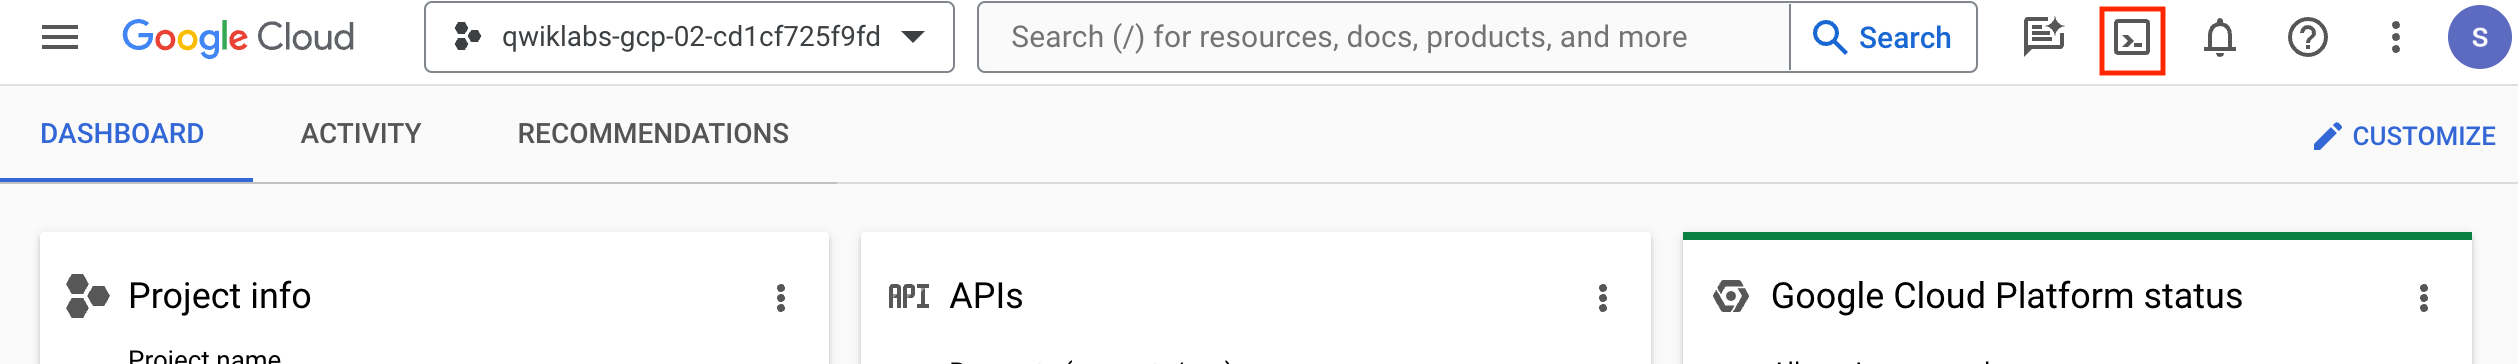
In Cloud console, on the top right toolbar, click the Open Cloud Shell button.
Click Continue.
It takes a few moments to provision and connect to the environment. When you are connected, you are already authenticated, and the project is set to your PROJECT_ID. For example:
gcloud is the command-line tool for Google Cloud. It comes pre-installed on Cloud Shell and supports tab-completion.
Output:
Example output:
Output:
Example output:
In this task, you enable data access logs on Cloud Storage to track operations that read or write user-provided data, as well as metadata and configuration information.
In the Google Cloud console, in the Navigation menu (
Scroll or use Filter to locate Google Cloud Storage, then check the box next to it. This should display the Info Panel with options on LOG TYPES.
Data Access audit logs are divided into different categories:
Click Check my progress to verify the objective.
In this task, you generate admin and data access activity by creating a storage bucket. You then upload a file, create a network and VM, and then delete the storage bucket.
Open or switch to your Cloud Shell terminal.
Use gcloud storage to create a Cloud Storage bucket with the same name as your project. If prompted, click Authorize:
Click Check my progress to verify the objective.
In this task, you view and explore both Admin Activity and Data Access audit logs in the Logs Explorer, examining the details of logged events such as bucket deletion and data access operations. You then read the Data Access logs using the Cloud SDK.
Admin Activity logs contain log entries for API calls or other administrative actions that modify the configuration or metadata of resources. For example, the logs record when VM instances and App Engine applications are created, or when permissions are changed. To view the logs, you must have the Cloud Identity and Access Management roles Logging/Logs Viewer or Project/Viewer.
Admin Activity logs are always enabled so there is no need to enable them. There is no charge for your Admin Activity audit logs.
In the Google Cloud console, in the Navigation menu (
In Logs Explorer, enable Show query and delete the contents of Query box.
Click the All log names dropdown and use the filter to locate the activity log under Cloud Audit section and Apply it to the query.
Press the Run query button, and then use the Log fields explorer to filter to GCS Bucket entries.
Locate the log entry for when the Cloud Storage was deleted.
Expand the delete entry, then drill into protoPayload > authenticationInfo field and notice you can see the email address of the user that performed this action.
Feel free to explore other fields in the entry. Also, notice how many of the values can be clicked to add inclusions/exclusions to the query.
Delete the existing query and use All log names to view the data_access logs.
What operations can you see now?
Click Check my progress to verify the objective.
Log entries can also be read using the Cloud SDK command:
Example:
Switch to or reopen a Cloud Shell terminal.
If we wanted to see those same data access logs using the command line, we could run the following:
In this exercise, you examined and worked with Google Cloud's Audit Logs. Now you can do a better job figuring out exactly who did what, when. Nice job.
When you have completed your lab, click End Lab. Google Cloud Skills Boost removes the resources you’ve used and cleans the account for you.
You will be given an opportunity to rate the lab experience. Select the applicable number of stars, type a comment, and then click Submit.
The number of stars indicates the following:
You can close the dialog box if you don't want to provide feedback.
For feedback, suggestions, or corrections, please use the Support tab.
Copyright 2024 Google LLC All rights reserved. Google and the Google logo are trademarks of Google LLC. All other company and product names may be trademarks of the respective companies with which they are associated.


此内容目前不可用
一旦可用,我们会通过电子邮件告知您

太好了!
一旦可用,我们会通过电子邮件告知您

一次一个实验
确认结束所有现有实验并开始此实验