

准备工作
- 实验会创建一个 Google Cloud 项目和一些资源,供您使用限定的一段时间
- 实验有时间限制,并且没有暂停功能。如果您中途结束实验,则必须重新开始。
- 在屏幕左上角,点击开始实验即可开始
Create Alerting Policy
/ 10
Failure starting the pipeline on Dataflow
/ 10
Invalid Bigquery table
/ 10
Too Much Logging
/ 10
In this lab, you:
Basic familiarity with Python.
For each lab, you get a new Google Cloud project and set of resources for a fixed time at no cost.
Sign in to Qwiklabs using an incognito window.
Note the lab's access time (for example, 1:15:00), and make sure you can finish within that time.
There is no pause feature. You can restart if needed, but you have to start at the beginning.
When ready, click Start lab.
Note your lab credentials (Username and Password). You will use them to sign in to the Google Cloud Console.
Click Open Google Console.
Click Use another account and copy/paste credentials for this lab into the prompts.
If you use other credentials, you'll receive errors or incur charges.
Accept the terms and skip the recovery resource page.
Google Cloud Shell is a virtual machine that is loaded with development tools. It offers a persistent 5GB home directory and runs on the Google Cloud.
Google Cloud Shell provides command-line access to your Google Cloud resources.
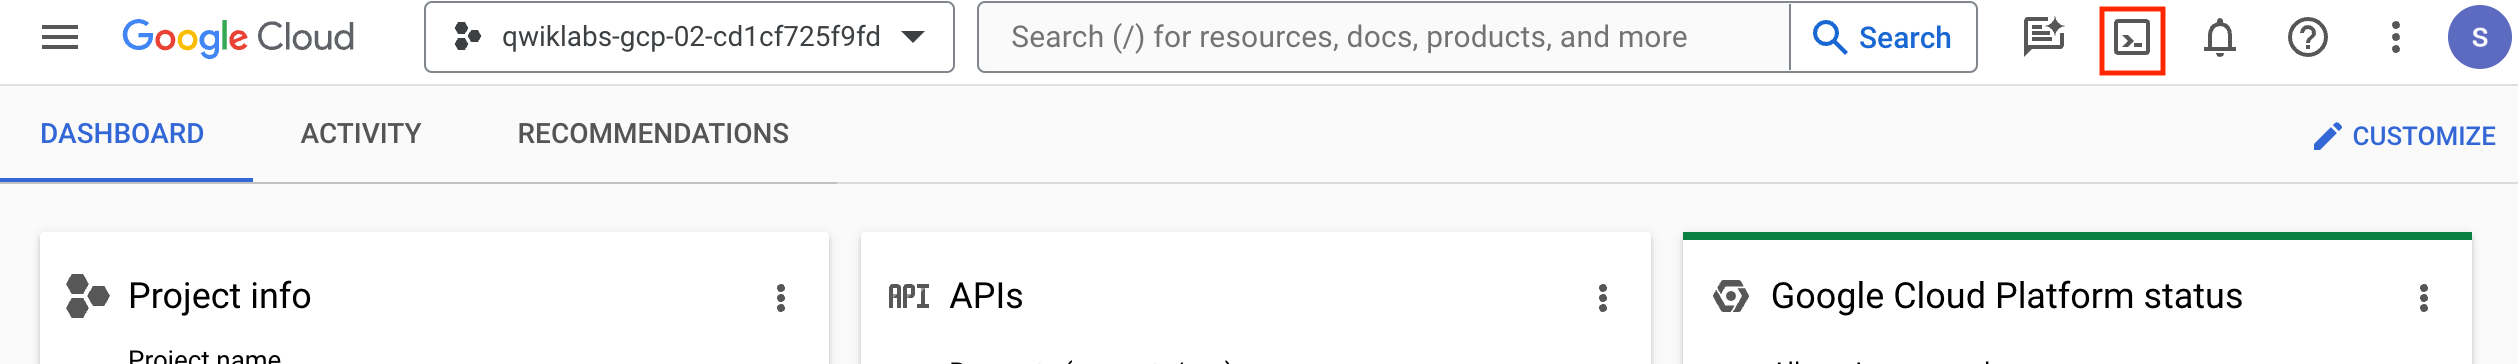
In Cloud console, on the top right toolbar, click the Open Cloud Shell button.
Click Continue.
It takes a few moments to provision and connect to the environment. When you are connected, you are already authenticated, and the project is set to your PROJECT_ID. For example:
gcloud is the command-line tool for Google Cloud. It comes pre-installed on Cloud Shell and supports tab-completion.
Output:
Example output:
Output:
Example output:
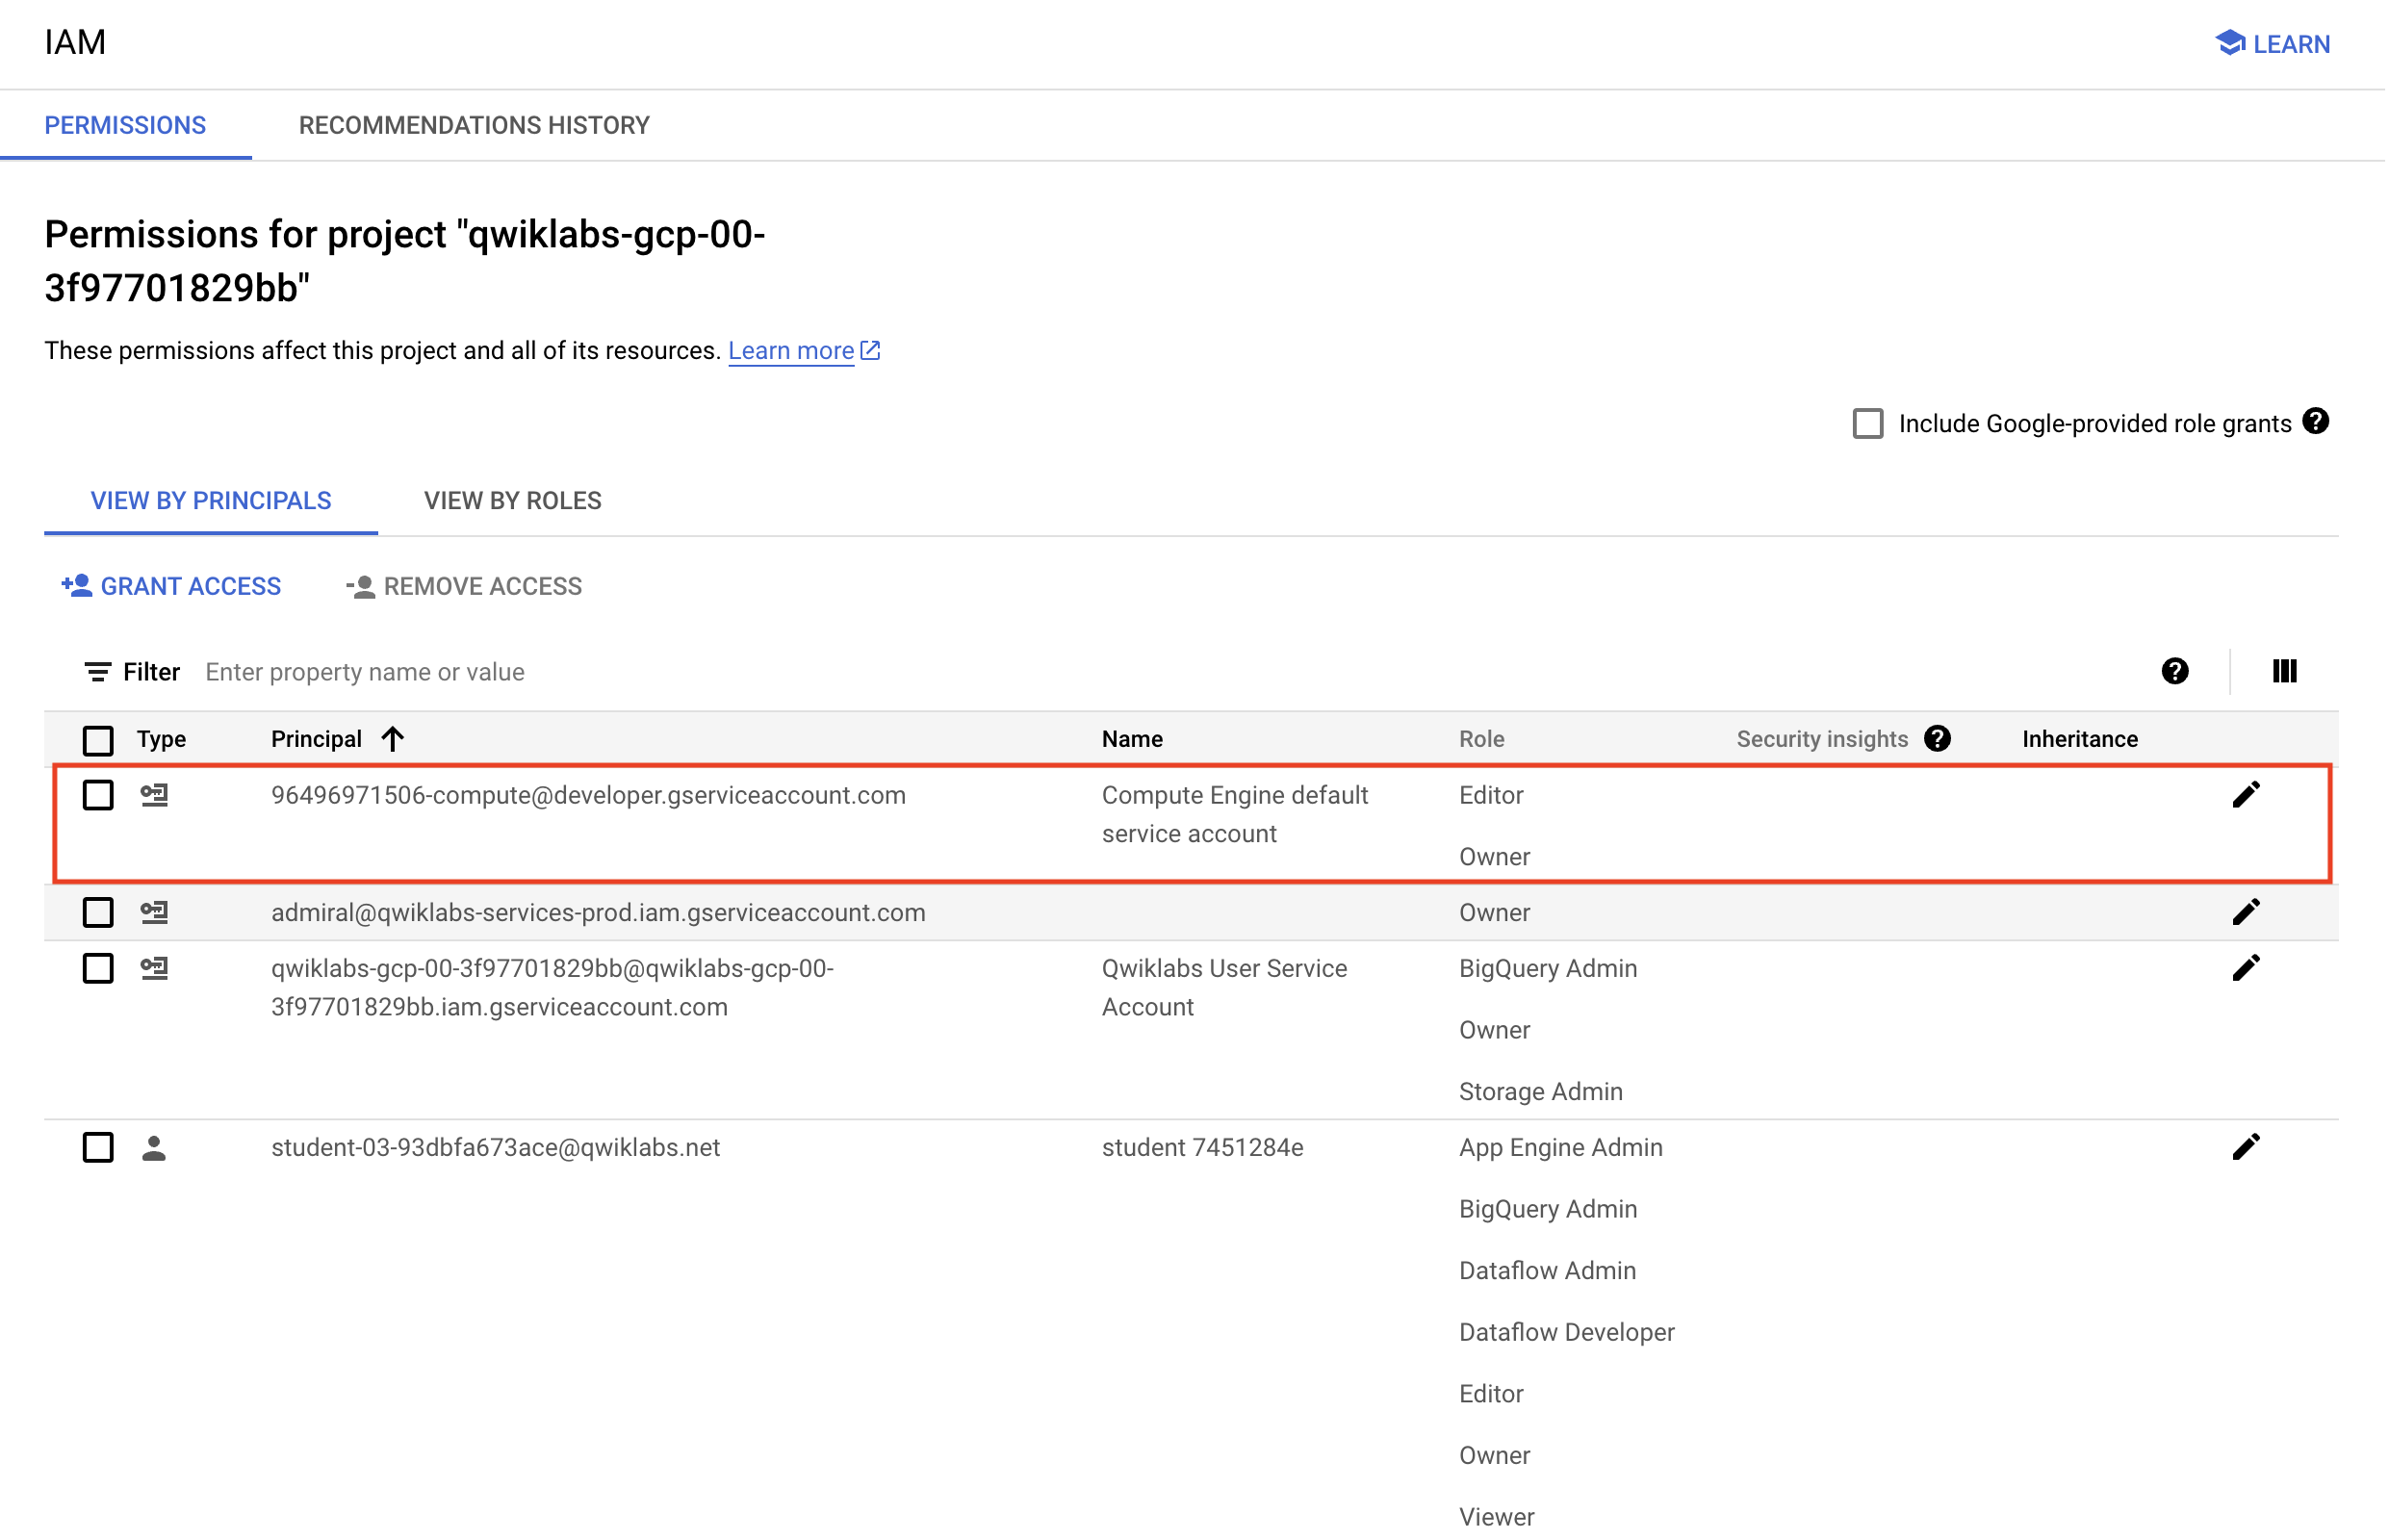
Before you begin your work on Google Cloud, you need to ensure that your project has the correct permissions within Identity and Access Management (IAM).
In the Google Cloud console, on the Navigation menu (
Confirm that the default compute Service Account {project-number}-compute@developer.gserviceaccount.com is present and has the editor role assigned. The account prefix is the project number, which you can find on Navigation menu > Cloud Overview > Dashboard.
editor role, follow the steps below to assign the required role.729328892908).{project-number} with your project number.In this section, you will create an alert policy that gets triggered when the condition is met.
On the Google Cloud console title bar, in the Search field, type Monitoring , click Search, and then click Monitoring.
From the left navigation pane, click Alerting.
On the Alerting page, click on + CREATE POLICY.
Click on Select a metric dropdown and uncheck Active.
a. Type Dataflow Job in filter by resource and metric name and click on Dataflow Job > Job. Select Failed and click Apply.
b. Set Rolling windows function to Sum.
c. Click Next. Set 0 as your Threshold value.
Click on the NEXT button to go to the Configure notifications and finalize alert step.
On the form that loads, click on the Notification Channels drop-down menu, and click on MANAGE NOTIFICATION CHANNELS.
This opens a new window that lists the supported notification channel types.
Scroll down to the row that says Email and click on ADD NEW on the far right.
a. For Email Address, enter your personal email address.
b. For Display Name, enter Qwiklabs Student.
c. Click on Save. You can now close this window and go back to the previous Create alerting policy window.
Click on the refresh icon to the left of MANAGE NOTIFICATION CHANNELS.
Next, click on the Notification Channels drop-down menu again. This time you should see the display name of the student account you just added.
Check the checkbox to the left of the name Qwiklabs Student and click OK.
Enter Failed Dataflow Job as the Alert Name in the textbox.
Click Next again.
Review the alert and click Create Policy.
Click Check my progress to verify the objective.
my_pipeline.py. Copy and paste the code from above into this file and save it, using your preferred text editor (the example below refers to Vim):After you paste the code into the file, be sure to save it.
Run the command below to create a storage bucket:
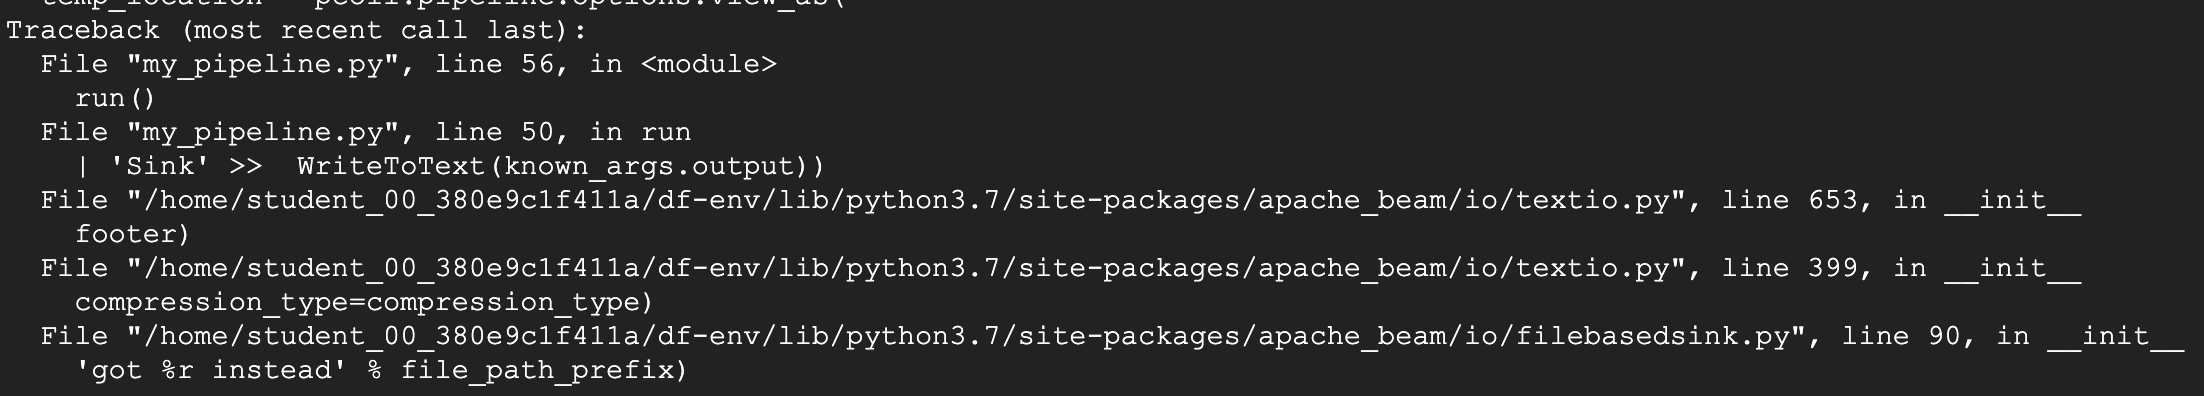
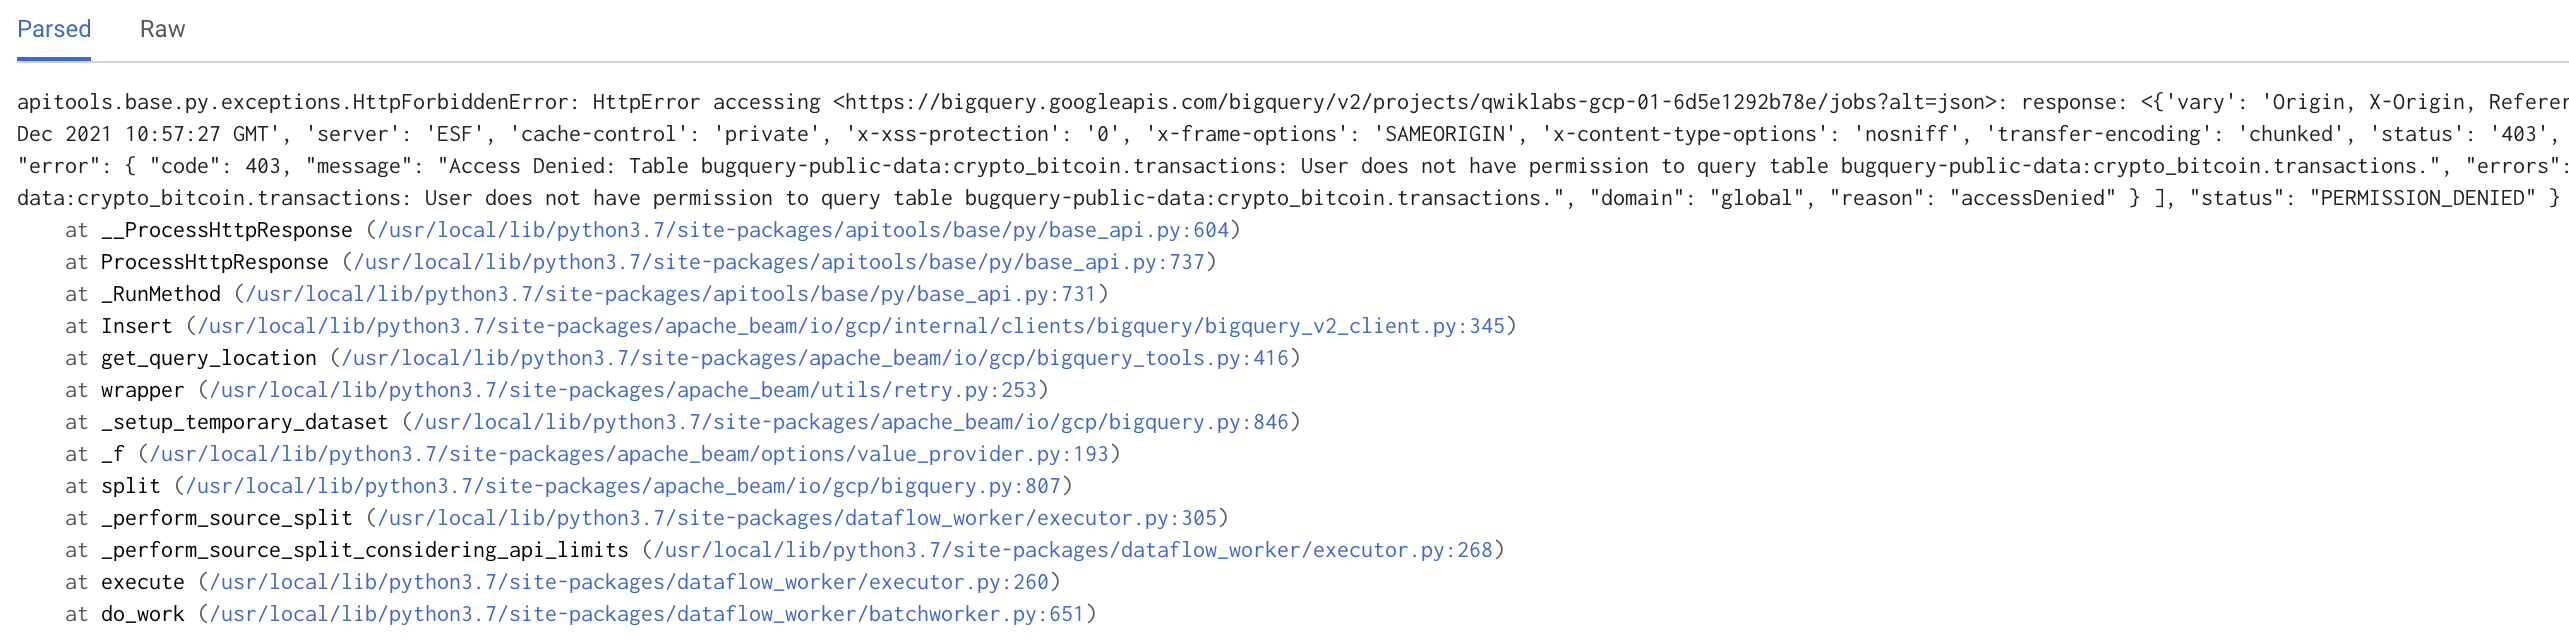
The above command to launch the pipeline will fail with a stacktrace similar to the one shown in the screenshot below:
This failure is on the Beam end. In the code, we specify WriteToText(known_args.output).
Since we did not pass in the --output flag, the code did not pass Beam validation, and was not able to launch in Dataflow. As this did not reach Dataflow, no job ID is associated with this launch operation. This means you should not get any alert email in your inbox.
Click Check my progress to verify the objective.
In this section, you try to launch the pipeline again with the required --output flag. While this does succeed in launching the Dataflow pipeline, the job will fail after a few minutes because we intentionally add an invalid BigQuery table. This should trigger the alerting policy and result in an alert email being sent.
On the Google Cloud console title bar, in the Search field, type Dataflow , click Search, and then click Dataflow.
Click Jobs.
Click on the Dataflow job listed on that page.
If you wait for about four minutes, you will see that the job fails. This triggers the alerting policy and you can look in your email inbox to view the alert email.
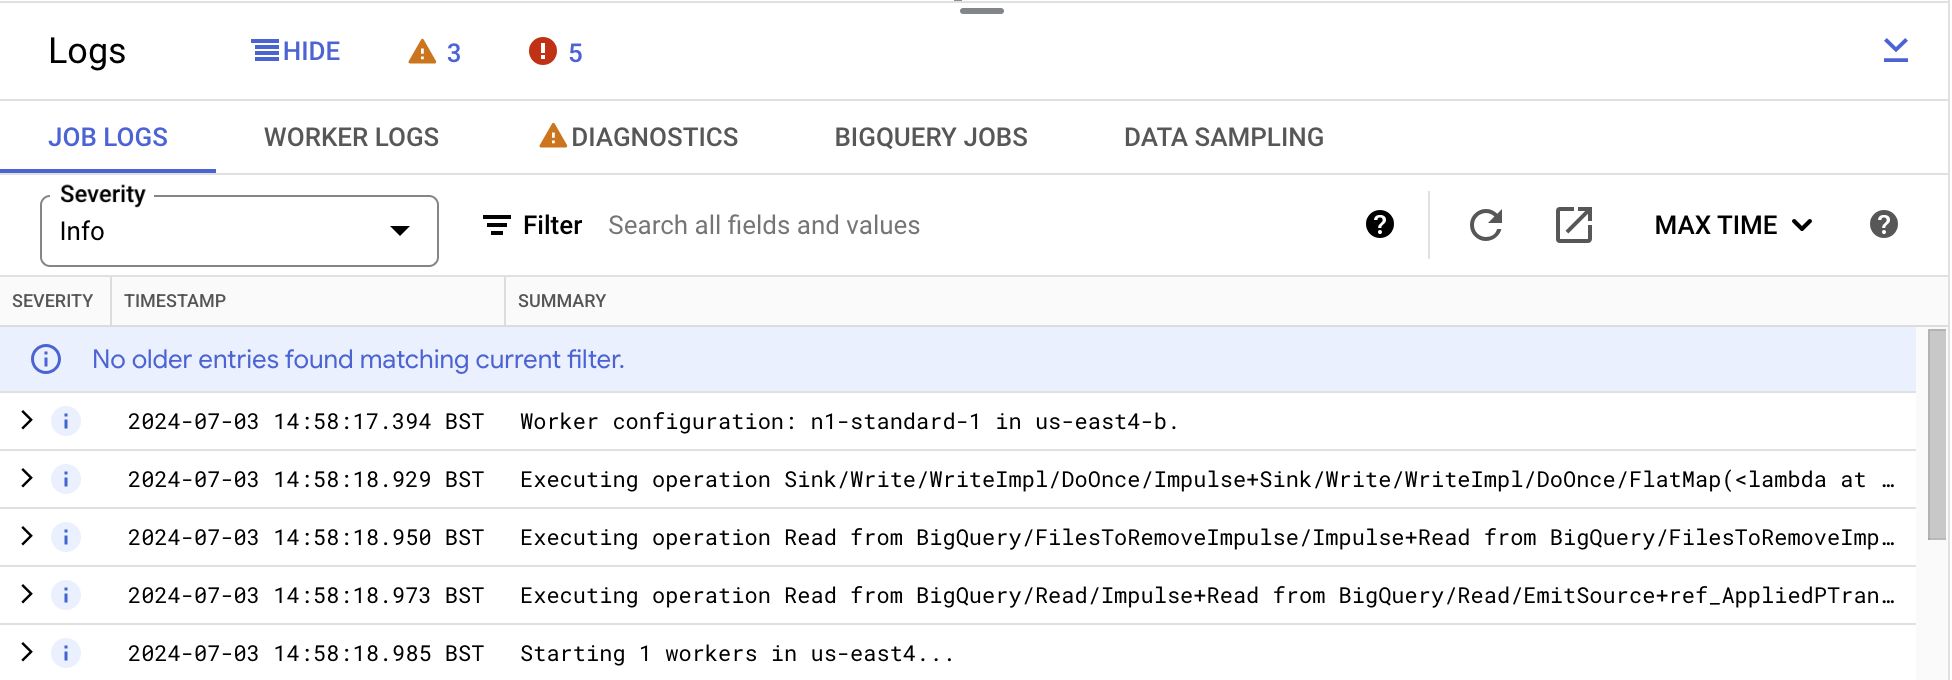
Below the Dataflow pipeline job graph, you will see the Logs panel. Click Show. This will expose the following tabs: Jobs logs, Worker logs, Diagnostics, BigQuery jobs and Data Sampling.
Click on the Job logs tab and explore the log entries.
Next, click on the Worker logs tab and explore those logs as well.
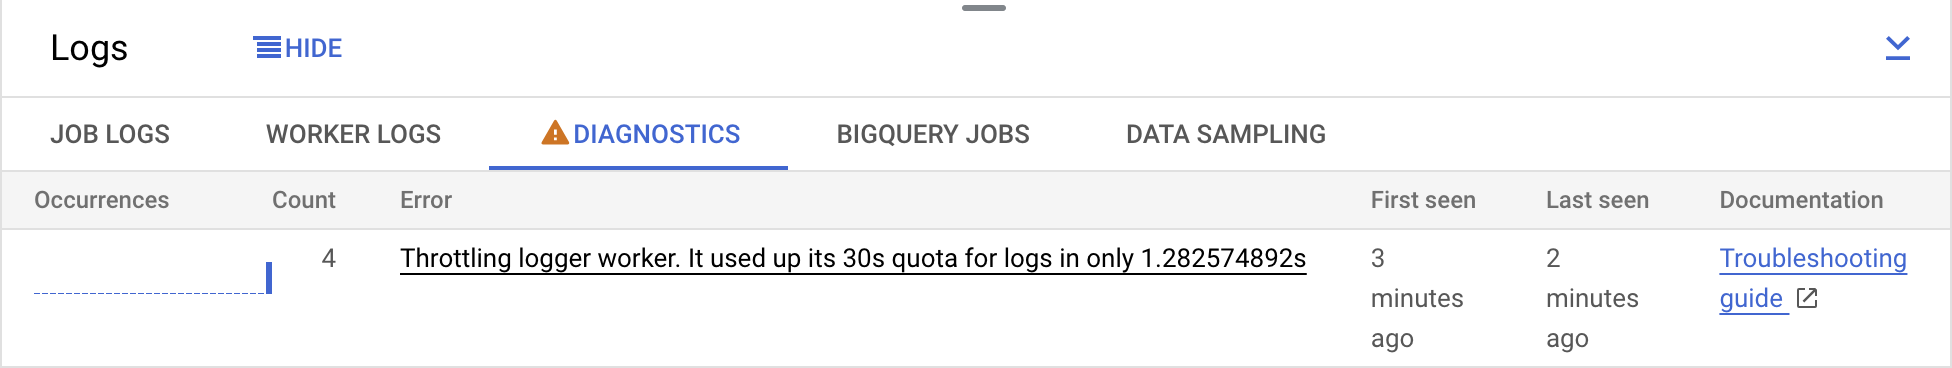
When you click on the Diagnostics tab, you will see a clickable link.
Click on it and this takes you to the Error Reporting page. This shows us an expanded view of the error. Looking at the stack trace, you will see the issue: a typo in the pipeline code!
In the code, bigquery is intentionally misspelled as bugquery, so this fails the Dataflow job and triggers the alerting policy to send an email. In the next section, you will fix the code and relaunch the pipeline.
Click Check my progress to verify the objective.
Using a text editor (such as Vim or your preferred editor), open the my_pipeline.py file and fix the code by replacing bugquery with bigquery.
bugquery-public-data.crypto_bitcoin.transactions. Change it to bigquery-public-data.crypto_bitcoin.transactions.
In the terminal, execute the following command to launch the pipeline:
The pipeline will take about seven minutes to complete.
On the Google Cloud console title bar, in the Search field, type Dataflow , click Search, and then click Dataflow.
Click Jobs. When you click on this new job, in the job graph page on the far right you should see Job status as succeeded. If the job is not complete, please wait for it to complete and succeed.
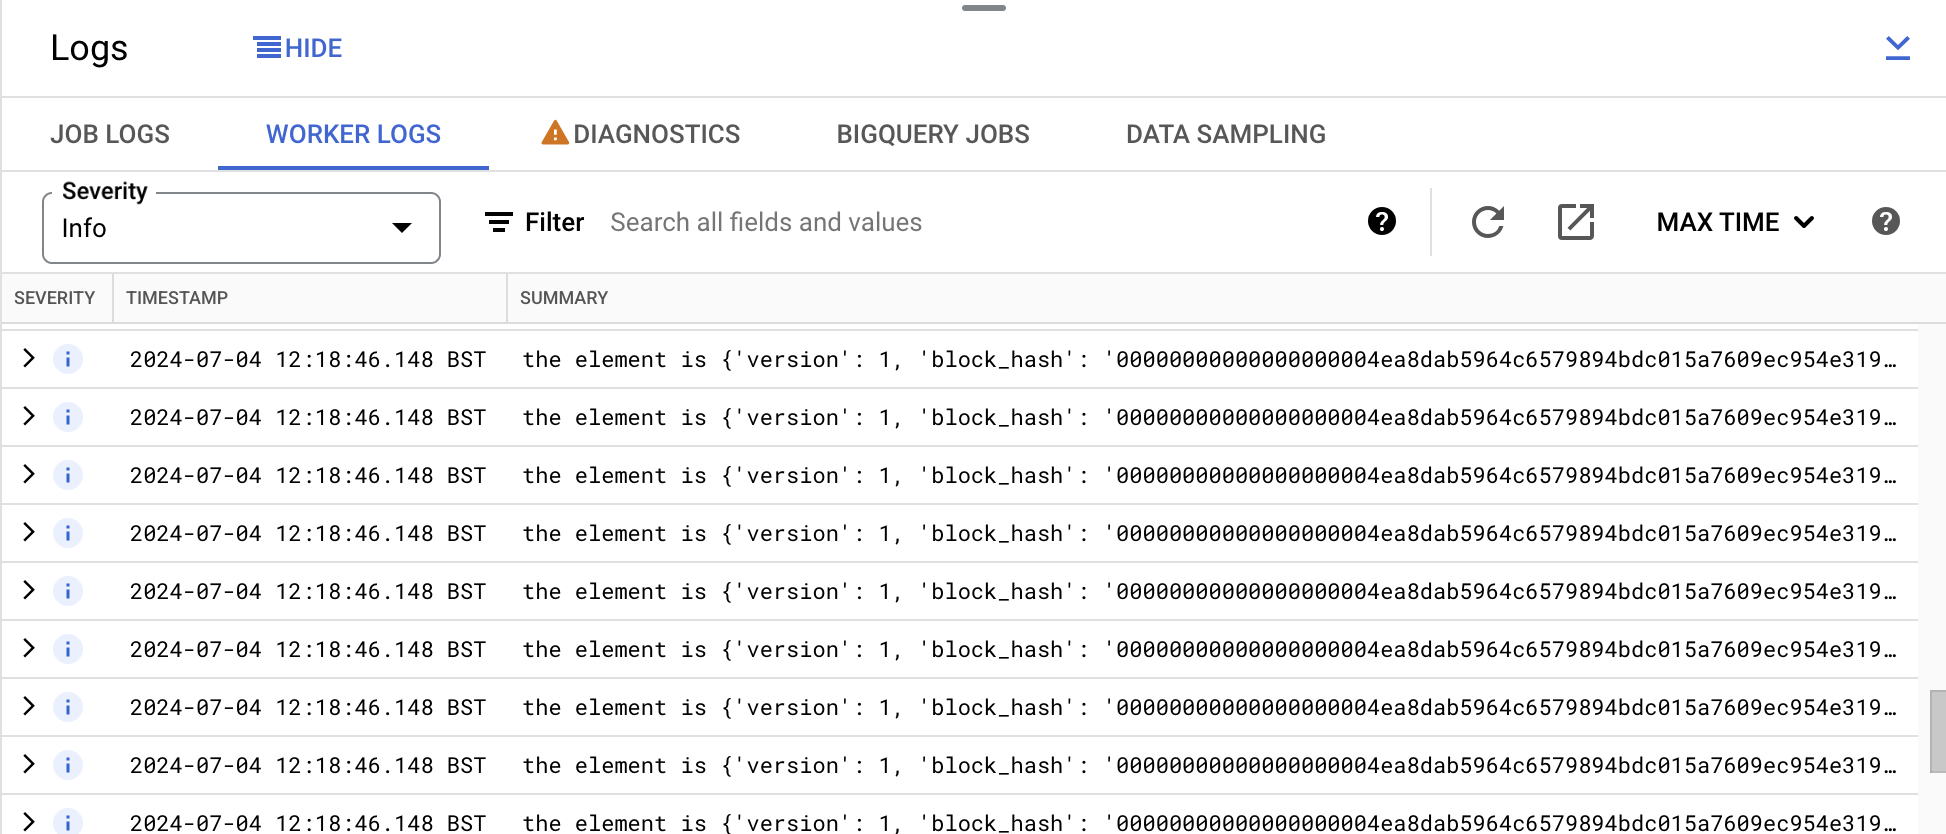
Expand on the Logs at the bottom and review the logs in the Worker logs tab.
In the Worker logs tab, you will see log entries with the format the element is {'version' : ....... }, as shown in the screenshot below:
These entries are being logged because of the following line in the pipeline code:
The simple fix to this issue would be to remove the logging line of code from your pipeline code and rerun the dataflow pipeline. Upon completion, you should no longer see the same message in the Diagnostics tab.
Go back to the Dataflow Jobs page by clicking the back button on your browser.
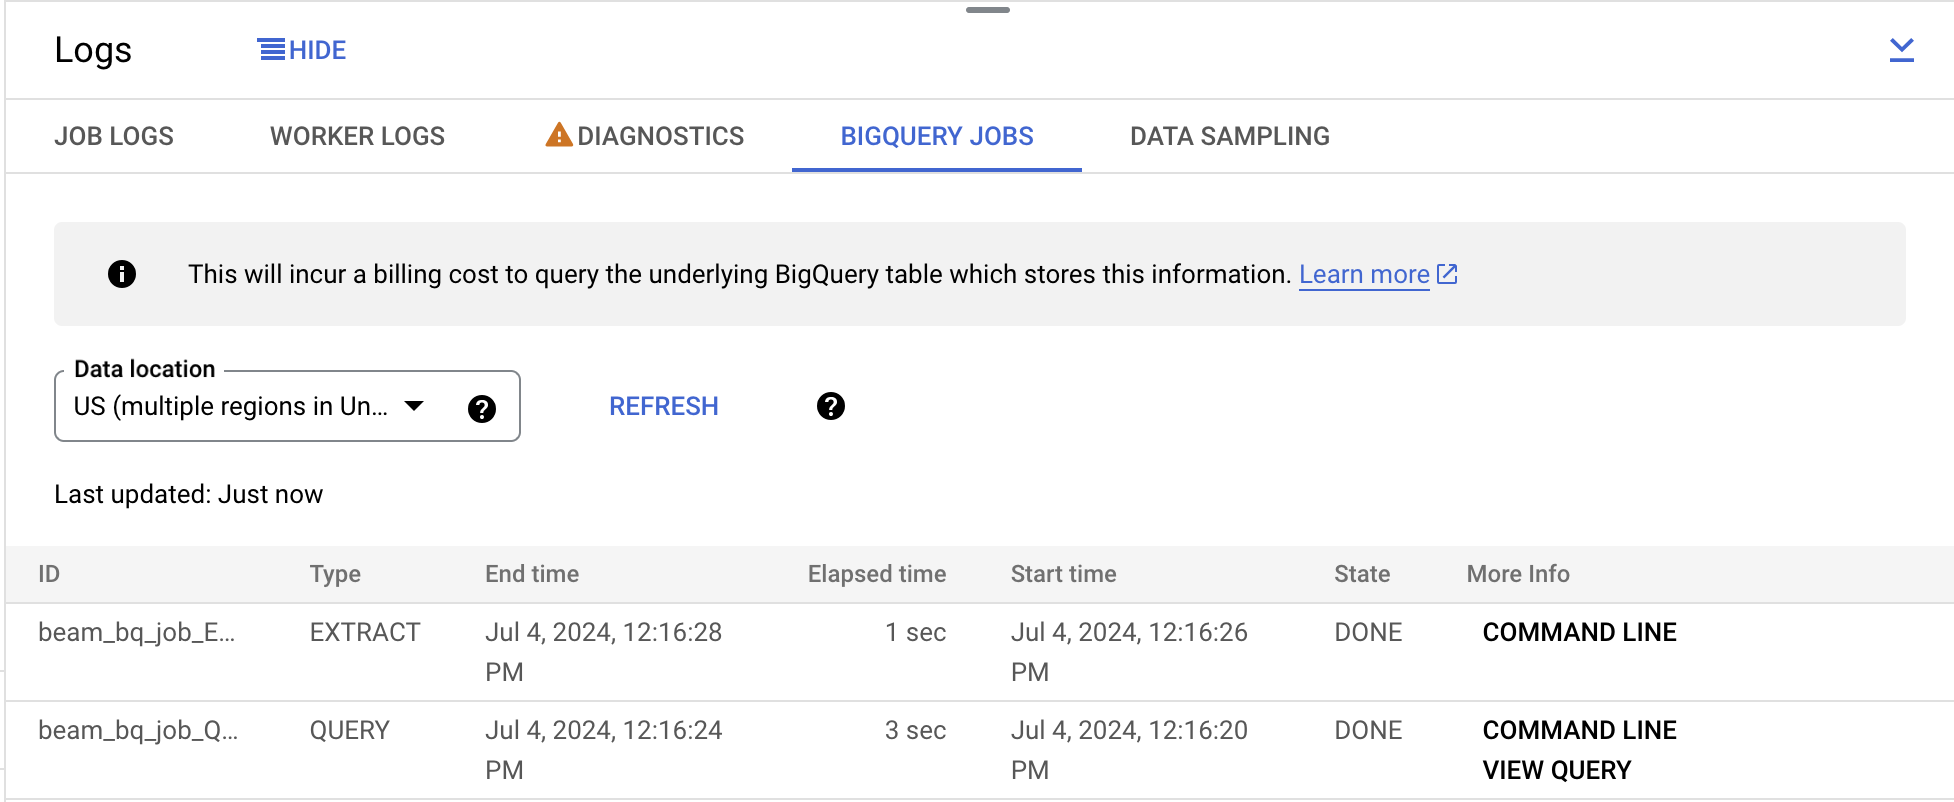
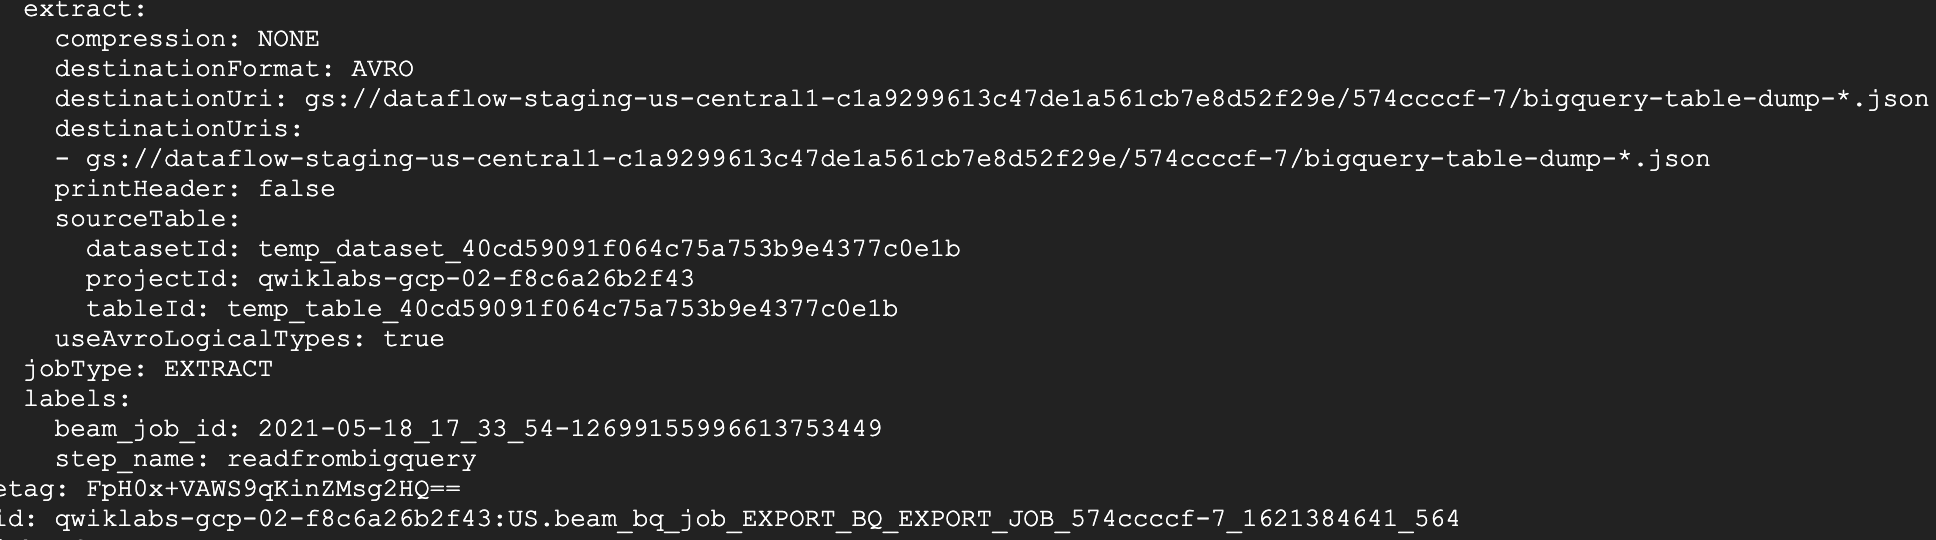
Under the expanded logs panel, click on the BigQuery jobs tab. From the Data Location drop-down menu, select us (multiple regions in United States) and click on Load BigQuery jobs. Then click Confirm.
You will see two jobs listed that were part of the pipeline.
This will paste the command in your Cloud Shell. Make sure to run the command.
Click Check my progress to verify the objective.
When you have completed your lab, click End Lab. Google Cloud Skills Boost removes the resources you’ve used and cleans the account for you.
You will be given an opportunity to rate the lab experience. Select the applicable number of stars, type a comment, and then click Submit.
The number of stars indicates the following:
You can close the dialog box if you don't want to provide feedback.
For feedback, suggestions, or corrections, please use the Support tab.
Copyright 2025 Google LLC All rights reserved. Google and the Google logo are trademarks of Google LLC. All other company and product names may be trademarks of the respective companies with which they are associated.


此内容目前不可用
一旦可用,我们会通过电子邮件告知您

太好了!
一旦可用,我们会通过电子邮件告知您

一次一个实验
确认结束所有现有实验并开始此实验