Overview
In this lab, you:
- Write a pipeline that uses SQL to aggregate site traffic by user.
- Write a pipeline that uses SQL to aggregate site traffic by minute.
Setup and requirements
Before you click the Start Lab button
Note: Read these instructions.
Labs are timed and you cannot pause them. The timer, which starts when you click Start Lab, shows how long Google Cloud resources will be made available to you.
This Qwiklabs hands-on lab lets you do the lab activities yourself in a real cloud environment, not in a simulation or demo environment. It does so by giving you new, temporary credentials that you use to sign in and access Google Cloud for the duration of the lab.
What you need
To complete this lab, you need:
- Access to a standard internet browser (Chrome browser recommended).
- Time to complete the lab.
Note: If you already have your own personal Google Cloud account or project, do not use it for this lab.
Note: If you are using a Pixelbook, open an Incognito window to run this lab.
How to start your lab and sign in to the Console
-
Click the Start Lab button. If you need to pay for the lab, a pop-up opens for you to select your payment method.
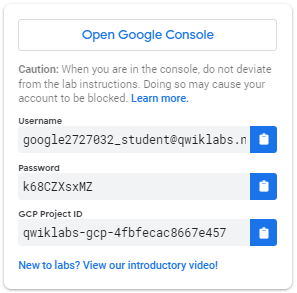
On the left is a panel populated with the temporary credentials that you must use for this lab.
-
Copy the username, and then click Open Google Console.
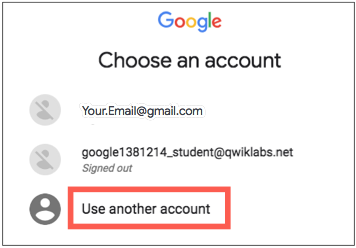
The lab spins up resources, and then opens another tab that shows the Choose an account page.
Note: Open the tabs in separate windows, side-by-side.
-
On the Choose an account page, click Use Another Account. The Sign in page opens.
-
Paste the username that you copied from the Connection Details panel. Then copy and paste the password.
Note: You must use the credentials from the Connection Details panel. Do not use your Google Cloud Skills Boost credentials. If you have your own Google Cloud account, do not use it for this lab (avoids incurring charges).
- Click through the subsequent pages:
- Accept the terms and conditions.
- Do not add recovery options or two-factor authentication (because this is a temporary account).
- Do not sign up for free trials.
After a few moments, the Cloud console opens in this tab.
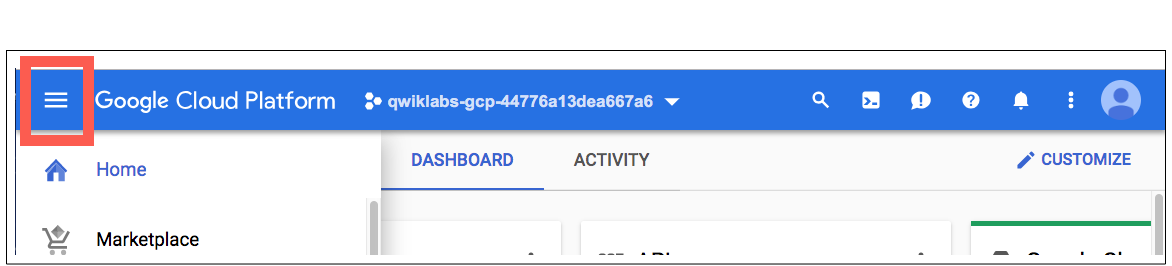
Note: You can view the menu with a list of Google Cloud Products and Services by clicking the Navigation menu at the top-left.
Jupyter notebook-based development environment setup
For this lab, you will be running all commands in a terminal from your notebook.
-
In the Google Cloud Console, on the Navigation Menu, click Vertex AI > Workbench.
-
Click Enable Notebooks API.
-
On the Workbench page, select USER-MANAGED NOTEBOOKS and click CREATE NEW.
-
In the New instance dialog box that appears, set the region to and zone to .
-
For Environment, select Apache Beam.
-
Click CREATE at the bottom of the dialog vox.
Note: The environment may take 3 - 5 minutes to be fully provisioned. Please wait until the step is complete.
Note: Click Enable Notebook API to enable the notebook api.
- Once the environment is ready, click the OPEN JUPYTERLAB link next to your Notebook name. This will open up your environment in a new tab in your browser.
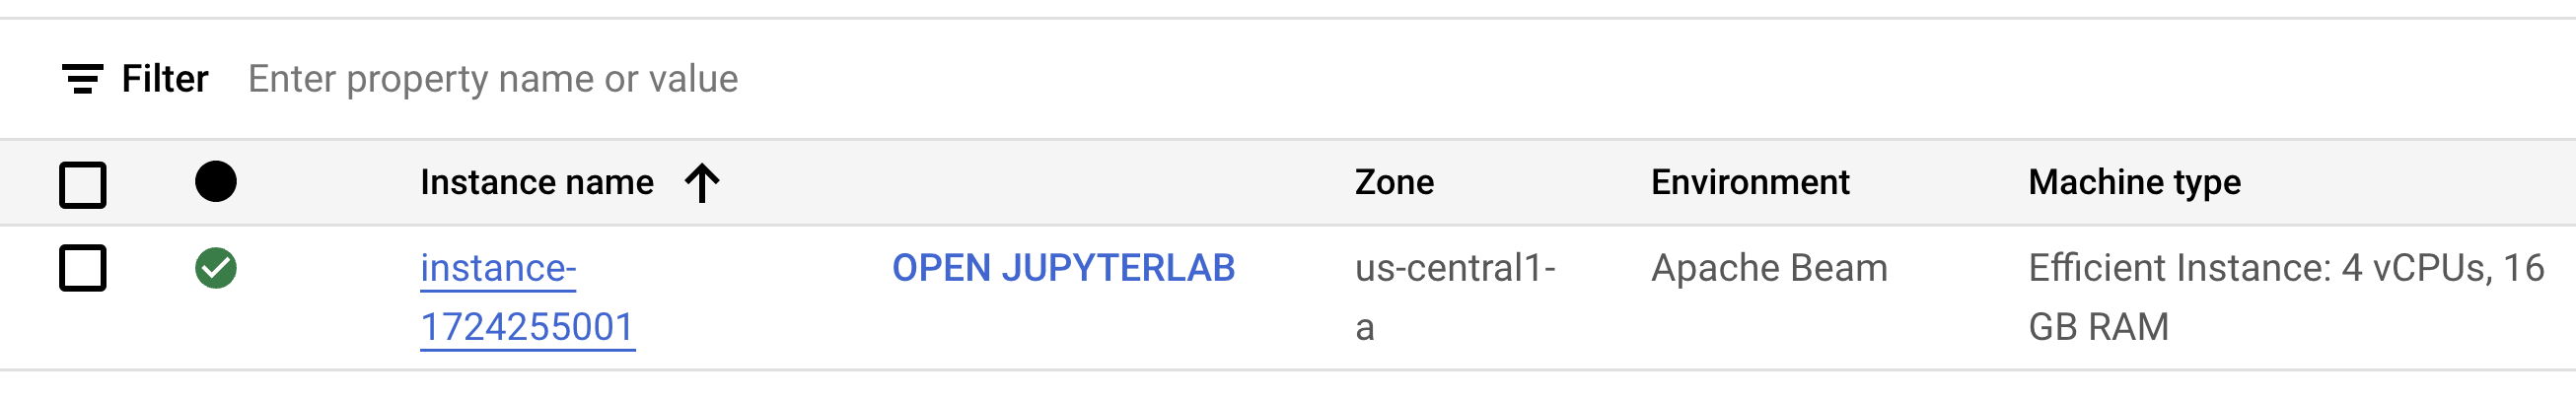
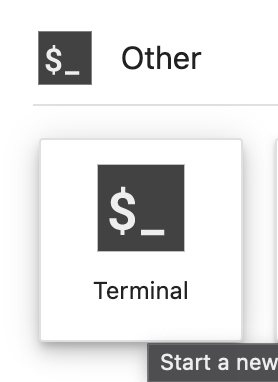
- Next, click Terminal. This will open up a terminal where you can run all the commands in this lab.
Download Code Repository
Next you will download a code repository for use in this lab.
- In the terminal you just opened, enter the following:
git clone https://github.com/GoogleCloudPlatform/training-data-analyst
cd /home/jupyter/training-data-analyst/quests/dataflow_python/
-
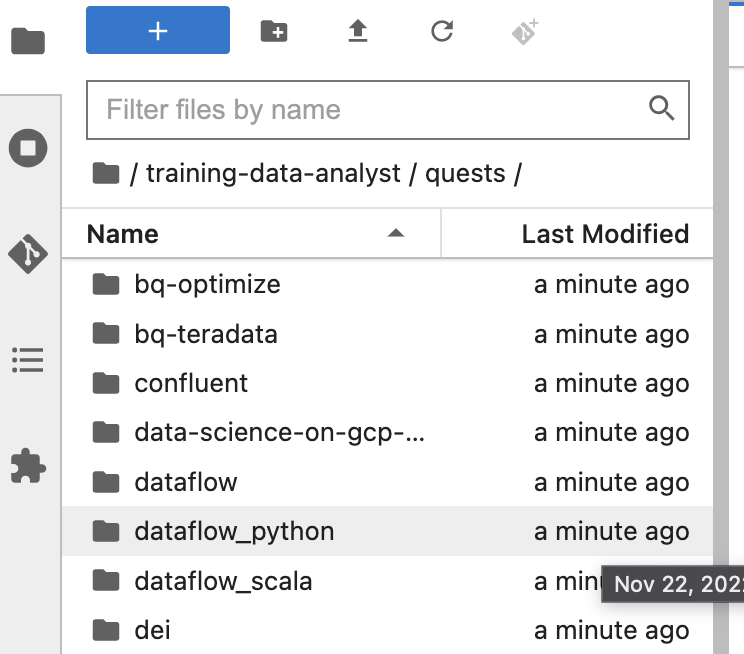
On the left panel of your notebook environment, in the file browser, you will notice the training-data-analyst repo added.
-
Navigate into the cloned repo /training-data-analyst/quests/dataflow_python/. You will see a folder for each lab, which is further divided into a lab sub-folder with code to be completed by you, and a solution sub-folder with a fully workable example to reference if you get stuck.
Note: To open a file for editing purposes, simply navigate to the file and click on it. This will open the file, where you can add or modify code.
Click Check my progress to verify the objective.
Create notebook instance and clone course repo
Part 1: Aggregating site traffic by user with SQL
In this part of the lab, you rewrite your previous BatchUserTraffic pipeline so that it performs the following:
- Reads the day’s traffic from a file in Cloud Storage.
- Converts each event into a
CommonLog object.
- Uses SQL instead of Java transforms to sum the number of hits for each unique user ID and perform additional aggregations.
- Writes the resulting data to BigQuery.
- Has an additional branch that writes the raw data to BigQuery for later analysis.
Task 1. Generate synthetic data
As in the prior labs, the first step is to generate data for the pipeline to process. You will open the lab environment and generate the data as before:
Open the appropriate lab
- In the terminal in your IDE, change to the directory you will use for this lab:
# Change directory into the lab
cd 4_SQL_Batch_Analytics/lab
export BASE_DIR=$(pwd)
Setting up dependencies
Before you can begin editing the actual pipeline code, you need to ensure that you have installed the necessary dependencies.
- In your terminal, execute the following to install the packages you will need to execute your pipeline:
python3 -m pip install -q --upgrade pip setuptools wheel
python3 -m pip install apache-beam[gcp]
- Ensure that the Dataflow and Data Catalog APIs are enabled:
gcloud services enable dataflow.googleapis.com
gcloud services enable datacatalog.googleapis.com
Set up the data environment
# Create GCS buckets and BQ dataset
cd $BASE_DIR/../..
source create_batch_sinks.sh
# Generate event dataflow
source generate_batch_events.sh
# Change to the directory containing the practice version of the code
cd $BASE_DIR
The script creates a file called events.json containing lines resembling the following:
{"user_id": "-6434255326544341291", "ip": "192.175.49.116", "timestamp": "2019-06-19T16:06:45.118306Z", "http_request": "\"GET eucharya.html HTTP/1.0\"", "lat": 37.751, "lng": -97.822, "http_response": 200, "user_agent": "Mozilla/5.0 (compatible; MSIE 7.0; Windows NT 5.01; Trident/5.1)", "num_bytes": 182}
It then automatically copies this file to your Google Cloud Storage bucket at .
- Navigate to Google Cloud Storage and confirm that your storage bucket contains a file called
events.json.
Click Check my progress to verify the objective.
Set up the data environment
Task 2. Add SQL dependencies
- In your File Explorer, navigate to
training-data-analyst/quests/dataflow_python/4_SQL_Batch_Analytics/lab/ and open the batch_user_traffic_SQL_pipeline.py file.
This pipeline already contains the necessary code to accept command-line options for the input path and one output table name, as well as code to read in events from Google Cloud Storage, parse those events, and write results to BigQuery. However, some important parts are missing.
As in the previous lab, the next step in the pipeline is to aggregate the events by each unique user_id and count pageviews for each. This time, however, you will perform the aggregation using SQL, using SqlTransform instead of Python-based transforms.
- In
batch_user_traffic_SQL_pipeline.py, add the following import statement:
from apache_beam.transforms.sql import SqlTransform
- Next, you will add the following SQL query to the file in the
query variable definition:
SELECT user_id,
COUNT(*) AS page_views, SUM(num_bytes) as total_bytes,
MAX(num_bytes) AS max_bytes, MIN(num_bytes) as min_bytes
FROM PCOLLECTION
GROUP BY user_id
- Next, fill out the following
#TODO. You will use this code to write a Transform to write raw data to BigQuery:
logs | 'WriteRawToBQ' >> beam.io.WriteToBigQuery(
raw_table_name,
schema=raw_table_schema,
create_disposition=beam.io.BigQueryDisposition.CREATE_IF_NEEDED,
write_disposition=beam.io.BigQueryDisposition.WRITE_TRUNCATE
)
Beam SQL can be implemented in both the Apache Calcite dialects (default) and ZetaSQL dialects. While both will be executed by Dataflow, we will be implementing ZetaSQL in this example, as it is similar to the language used in BigQuery and is also the dialect implemented in 'Dataflow SQL' — SQL queries authored directly in the Dataflow UI.
- Fill out the last
#TODO. Apply a SQLTransform using ZetaSQL Dialect using the following code:
SqlTransform(query, dialect='zetasql')
- Save the changes you made to the file.
Task 3. Run your pipeline
- Return to the terminal and execute the following code to run your pipeline:
export PROJECT_ID=$(gcloud config get-value project)
export REGION={{{project_0.startup_script.lab_region|Region}}}
export BUCKET=gs://${PROJECT_ID}
export PIPELINE_FOLDER=${BUCKET}
export RUNNER=DataflowRunner
export INPUT_PATH=${PIPELINE_FOLDER}/events.json
export TABLE_NAME=${PROJECT_ID}:logs.user_traffic
export AGGREGATE_TABLE_NAME=${PROJECT_ID}:logs.user_traffic
export RAW_TABLE_NAME=${PROJECT_ID}:logs.raw
python3 batch_user_traffic_SQL_pipeline.py \
--project=${PROJECT_ID} \
--region=${REGION} \
--staging_location=${PIPELINE_FOLDER}/staging \
--temp_location=${PIPELINE_FOLDER}/temp \
--runner=${RUNNER} \
--experiments=use_runner_v2 \
--input_path=${INPUT_PATH} \
--agg_table_name=${AGGREGATE_TABLE_NAME} \
--raw_table_name=${RAW_TABLE_NAME}
-
Navigate to Navigation Menu > Dataflow to see the status of your pipeline.
-
Once your pipeline has finished, go to the BigQuery UI to query the two resulting tables.
-
Make sure that logs.raw exists and has data populated, as you will need that later in the lab.
Click Check my progress to verify the objective.
Aggregating site traffic by user with SQL
Part 2: Aggregating site traffic by minute with SQL
In this part of the lab, you rewrite your previous BatchMinuteTraffic pipeline so that it performs the following:
- Reads the day’s traffic from a file in Cloud Storage.
- Converts each event into a
CommonLog object and then adds a Joda Timestamp attribute to the object.
- Uses SQL instead of Java transforms to again Window sum the number of total hits per minute.
- Writes the resulting data to BigQuery.
Task 1. Add timestamp field to CommonLog row
In this task, you will add a Joda timestamp field to your CommonLog object, implicitly converting it to a generic Row object.
The appropriate imports and options have already been set to use ZetaSQL. A pipeline has been built with steps to ingest and write the data, but not to transform or aggregate it. In the file explorer of the IDE, navigate to training-data-analyst/quests/dataflow_python/4_SQL_Batch_Analytics/lab/ and open the file batch_minute_user_SQL_pipeline.py.
- For the first
#TODO, add the formatted timestamp as a string:
ts = datetime.strptime(element.ts[:-8], "%Y-%m-%dT%H:%M:%S")
ts = datetime.strftime(ts, "%Y-%m-%d %H:%M:%S")
Note that when using the Python SDK, we currently cannot directly pass in objects of type datetime to a SqlTransform. Instead, we will convert the object into a string using strftime and then in SQL use the TIMESTAMP function.
- Next, add the following SQL query:
SELECT
COUNT(*) AS page_views,
STRING(window_start) AS start_time
FROM
TUMBLE(
(SELECT TIMESTAMP(ts) AS ts FROM PCOLLECTION),
DESCRIPTOR(ts),
'INTERVAL 1 MINUTE')
GROUP BY window_start
Note: In this SQL query, we convert our field ts to type TIMESTAMP and use it as the event timestamp for our fixed one-minute windows. The window_start field is generated by TUMBLE and is of type TIMESTAMP as well. Due to the issue we discussed earlier with the Python SDK, we must convert this field to a STRING before sending the resulting PCollection back to Python transforms.
- For the next
#TODO, apply a SQLTransform using ZetaSQL Dialect using the following code:
SqlTransform(query, dialect='zetasql')
Task 2. Run your pipeline
- Back in your terminal, execute the following code to run your pipeline:
export PROJECT_ID=$(gcloud config get-value project)
export REGION={{{project_0.startup_script.lab_region|Region}}}
export BUCKET=gs://${PROJECT_ID}
export PIPELINE_FOLDER=${BUCKET}
export RUNNER=DataflowRunner
export INPUT_PATH=${PIPELINE_FOLDER}/events.json
export TABLE_NAME=${PROJECT_ID}:logs.minute_traffic
python3 batch_minute_traffic_SQL_pipeline.py \
--project=${PROJECT_ID} \
--region={{{project_0.startup_script.lab_region|Region}}} \
--stagingLocation=${PIPELINE_FOLDER}/staging \
--tempLocation=${PIPELINE_FOLDER}/temp \
--runner=${RUNNER} \
--inputPath=${INPUT_PATH} \
--tableName=${TABLE_NAME} \
--experiments=use_runner_v2
-
In the Cloud Console, navigate to Navigation Menu > Dataflow to see the status of your pipeline.
-
Once your pipeline has finished, go to the BigQuery UI to query the resulting logs.minute_traffic tables. Alternatively, you can query from the terminal:
bq head -n 10 $PROJECT_ID:logs.minute_traffic
Click Check my progress to verify the objective.
Aggregating site traffic by minute with SQL
End your lab
When you have completed your lab, click End Lab. Google Cloud Skills Boost removes the resources you’ve used and cleans the account for you.
You will be given an opportunity to rate the lab experience. Select the applicable number of stars, type a comment, and then click Submit.
The number of stars indicates the following:
- 1 star = Very dissatisfied
- 2 stars = Dissatisfied
- 3 stars = Neutral
- 4 stars = Satisfied
- 5 stars = Very satisfied
You can close the dialog box if you don't want to provide feedback.
For feedback, suggestions, or corrections, please use the Support tab.
Copyright 2022 Google LLC All rights reserved. Google and the Google logo are trademarks of Google LLC. All other company and product names may be trademarks of the respective companies with which they are associated.


