
准备工作
- 实验会创建一个 Google Cloud 项目和一些资源,供您使用限定的一段时间
- 实验有时间限制,并且没有暂停功能。如果您中途结束实验,则必须重新开始。
- 在屏幕左上角,点击开始实验即可开始
Create Vertex AI Platform Notebooks instance and clone course repo
/ 25
Generate synthetic data
/ 25
Aggregating site traffic by user and run your pipeline
/ 25
Aggregating site traffic by minute and run the pipeline
/ 25
In this lab, you:
For each lab, you get a new Google Cloud project and set of resources for a fixed time at no cost.
Sign in to Qwiklabs using an incognito window.
Note the lab's access time (for example, 1:15:00), and make sure you can finish within that time.
There is no pause feature. You can restart if needed, but you have to start at the beginning.
When ready, click Start lab.
Note your lab credentials (Username and Password). You will use them to sign in to the Google Cloud Console.
Click Open Google Console.
Click Use another account and copy/paste credentials for this lab into the prompts.
If you use other credentials, you'll receive errors or incur charges.
Accept the terms and skip the recovery resource page.
For this lab, you will be running all commands in a terminal from your Workbench instance notebook.
In the Google Cloud console, from the Navigation menu (
Click Enable All Recommended APIs. Now. let's check that the Notebook API is enabled.
In the Navigation menu, click Workbench.
At the top of the Workbench page, ensure you are in the Instances view.
Click 
Configure the Instance:
| Name | Region | Zone | Advanced Options (Optional) |
|---|---|---|---|
| lab-workbench | If needed, click "Advanced Options" for further customization (e.g., machine type, disk size) |
This will take a few minutes to create the instance. A green checkmark will appear next to its name when it's ready.
Click Open Jupyterlab next to the instance name to launch the JupyterLab interface. This will open a new tab in your browser.
Next, click Terminal. This will open up a terminal where you can run all the commands in this lab.
Next you will download a code repository for use in this lab.
On the left panel of your notebook environment, in the file browser, you will notice the training-data-analyst repo added.
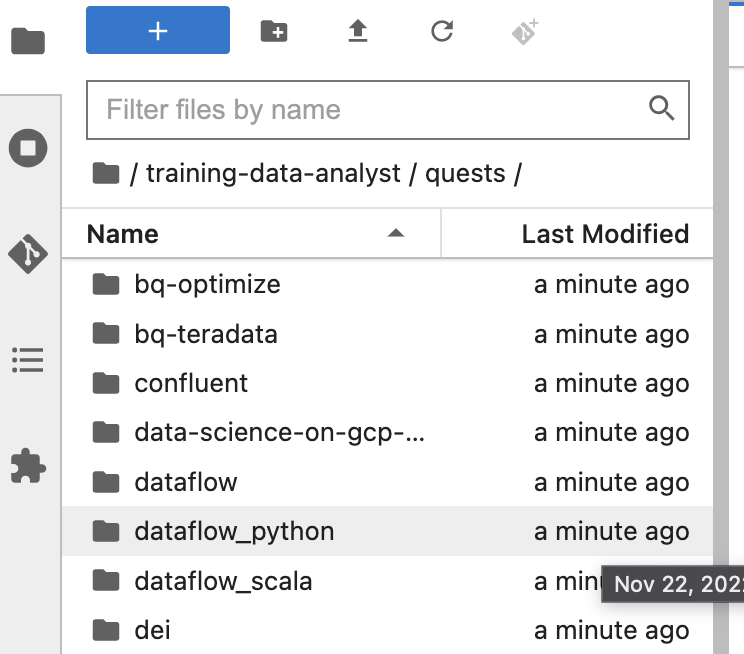
Navigate into the cloned repo /training-data-analyst/quests/dataflow_python/. You will see a folder for each lab, which is further divided into a lab sub-folder with code to be completed by you, and a solution sub-folder with a fully workable example to reference if you get stuck.
Click Check my progress to verify the objective.
In this part of the lab, you write a pipeline that:
CommonLog object.As in the prior labs, the first step is to generate data for the pipeline to process. You will open the lab environment and generate the data as before:
Before you can begin editing the actual pipeline code, you need to ensure that you have installed the necessary dependencies.
The script creates a file called events.json containing lines resembling the following:
It then automatically copies this file to your Google Cloud Storage bucket at
Click Check my progress to verify the objective.
This task has two mini challenges. You can refer to the solution
In the file explorer, navigate to below mentioned path and open the batch_user_traffic_pipeline.py file.
This pipeline already contains the necessary code to accept command-line options for the input path and the output table name, as well as code to read in events from Google Cloud Storage, parse those events, and write results to BigQuery. However, some important parts are missing and are marked as #TODOs.
This is a data modeling task. In this step, you should consider, after you group all the log events by user, what information do you want to calculate for each one?
You need to define the structure (the schema) that will hold the results of your aggregation. You must look at the CommonLog class to see what fields are available to aggregate.
Identify the Key: The class name is PerUserAggregation, so the primary piece of information you need to keep is the user_id.
Choose Metrics to Calculate: What can you calculate from a user's collection of CommonLog entries?
For example:
This is a technical requirement of the Apache Beam framework. The challenge is testing your knowledge of how Beam handles custom data types.
When Apache Beam runs a pipeline, it often needs to send data between different computers (called workers). To do this, it must serialize your Python object (like a PerUserAggregation instance) into a stream of bytes, send it over the network, and then deserialize it back into an object on the other side. A Coder is the object that tells Beam how to perform this serialization and deserialization.
If you don't tell Beam how to encode/decode your custom PerUserAggregation class, the pipeline will fail with an error.
The solution is right in the line above the #TODOs. Beam provides a RowCoder that works perfectly with NamedTuple classes. You simply need to register a RowCoder for your new PerUserAggregation class, just as it was done for CommonLog.
Return to the Terminal and execute the following command to run your pipeline using the Cloud Dataflow service. You can run it with DirectRunner if you're having trouble, or refer to the solution
ENTER_REGION_ID and ENTER_ZONE_ID field as per the table below| Region | Zone | |
|---|---|---|
You can check your submitted job in the Dataflow Dashboard
Once job status is successful, let's verify results in BigQuery. To complete this task, wait a few minutes for the pipeline to complete, then navigate to BigQuery and query the user_traffic table.
Click Check my progress to verify the objective.
In this part of the lab, you create a new pipeline called batch_minute_traffic. It expands on the basic batch analysis principles used in batch_user_traffic and, instead of aggregating by users across the entire batch, aggregates by when events occurred. There are again multiple #TODOs which basically you need to fix or can take help from the solution
In the IDE, navigate to below path and open the file batch_minute_traffic_pipeline.py.
These #TODOs items guide you through building a classic time-series aggregation pipeline in Apache Beam. Each one represents a core concept in batch and stream processing.
The goal of this pipeline is to process a JSON file of web events (events.json), count how many events occurred every minute, and write these minute-by-minute counts to a BigQuery table.
The pipeline flow looks like this:
Read Text -> Parse to CommonLog -> TODOs -> Write to BigQuery
The #TODOs are the core concept of the pipeline, where the actual aggregation logic happens.
You have a collection of CommonLog objects. The next step in the pipeline is to group these events by time (WindowByMinute). Apache Beam cannot do this unless it knows the event time for each piece of data. Your challenge is to tell Beam how to find this timestamp within your CommonLog object.
The add_timestamp function (defined in pipeline_utils.py) parses the timestamp string from each log record and attaches it to the element as a proper Beam timestamp, which is required for windowing.
For Example:
Let's move to second task of the script where we transform groups elements as per the challenge.
This transform groups elements into fixed-size, non-overlapping windows of 60 seconds (one minute) based on their event timestamps.
For Example:
Let's move to the third task of the script where we count events per window.
This combiner counts the number of elements within each one-minute window. Use .without_defaults() to make sure that no output is generated for empty windows.
For Example:
Let's move to the final task of the script where we convert back to a row and add timestamp
The GetTimestampFn (defined in pipeline_utils.py) takes the integer count for each window and formats it into a dictionary, adding the window's start time as a string to match the BigQuery schema.
To complete this task, write a ParDo function that accepts elements of type int, passes in the additional parameter to access window information. Note that the timestamp field in the BigQuery table schema is a STRING, so you will have to convert the timestamp to a string.
For Example:
Once you’ve finished coding, run the pipeline using the command below. Keep in mind that, while testing your code, it will be much faster to change the RUNNER environment variable to DirectRunner, which will run the pipeline locally. For now, we run the pipeline using Dataflow.
| Region | ||
|---|---|---|
minute_traffic table.Click Check my progress to verify the objective.
When you have completed your lab, click End Lab. Google Cloud Skills Boost removes the resources you’ve used and cleans the account for you.
You will be given an opportunity to rate the lab experience. Select the applicable number of stars, type a comment, and then click Submit.
The number of stars indicates the following:
You can close the dialog box if you don't want to provide feedback.
For feedback, suggestions, or corrections, please use the Support tab.
Copyright 2022 Google LLC All rights reserved. Google and the Google logo are trademarks of Google LLC. All other company and product names may be trademarks of the respective companies with which they are associated.


此内容目前不可用
一旦可用,我们会通过电子邮件告知您

太好了!
一旦可用,我们会通过电子邮件告知您

一次一个实验
确认结束所有现有实验并开始此实验