
시작하기 전에
- 실습에서는 정해진 기간 동안 Google Cloud 프로젝트와 리소스를 만듭니다.
- 실습에는 시간 제한이 있으며 일시중지 기능이 없습니다. 실습을 종료하면 처음부터 다시 시작해야 합니다.
- 화면 왼쪽 상단에서 실습 시작을 클릭하여 시작합니다.
Launch Vertex AI Workbench instance
/ 50
Execute a BigQuery query
/ 50
The purpose of this lab is to show learners how to instantiate a Jupyter notebook running on Google Cloud's Vertex AI service. To aid in the demonstration, a dataset with various flight departure and arrival times will be leveraged.
In this lab, you will learn how to perform the following tasks:
For each lab, you get a new Google Cloud project and set of resources for a fixed time at no cost.
Sign in to Qwiklabs using an incognito window.
Note the lab's access time (for example, 1:15:00), and make sure you can finish within that time.
There is no pause feature. You can restart if needed, but you have to start at the beginning.
When ready, click Start lab.
Note your lab credentials (Username and Password). You will use them to sign in to the Google Cloud Console.
Click Open Google Console.
Click Use another account and copy/paste credentials for this lab into the prompts.
If you use other credentials, you'll receive errors or incur charges.
Accept the terms and skip the recovery resource page.
In the Google Cloud Console, on the Navigation menu , click BigQuery.
The Welcome to BigQuery in the Cloud Console dialog opens. This dialog provides a link to the quickstart guide and lists UI updates.
Click Done to close the dialog.
In the Google Cloud console, from the Navigation menu (
Click Enable All Recommended APIs.
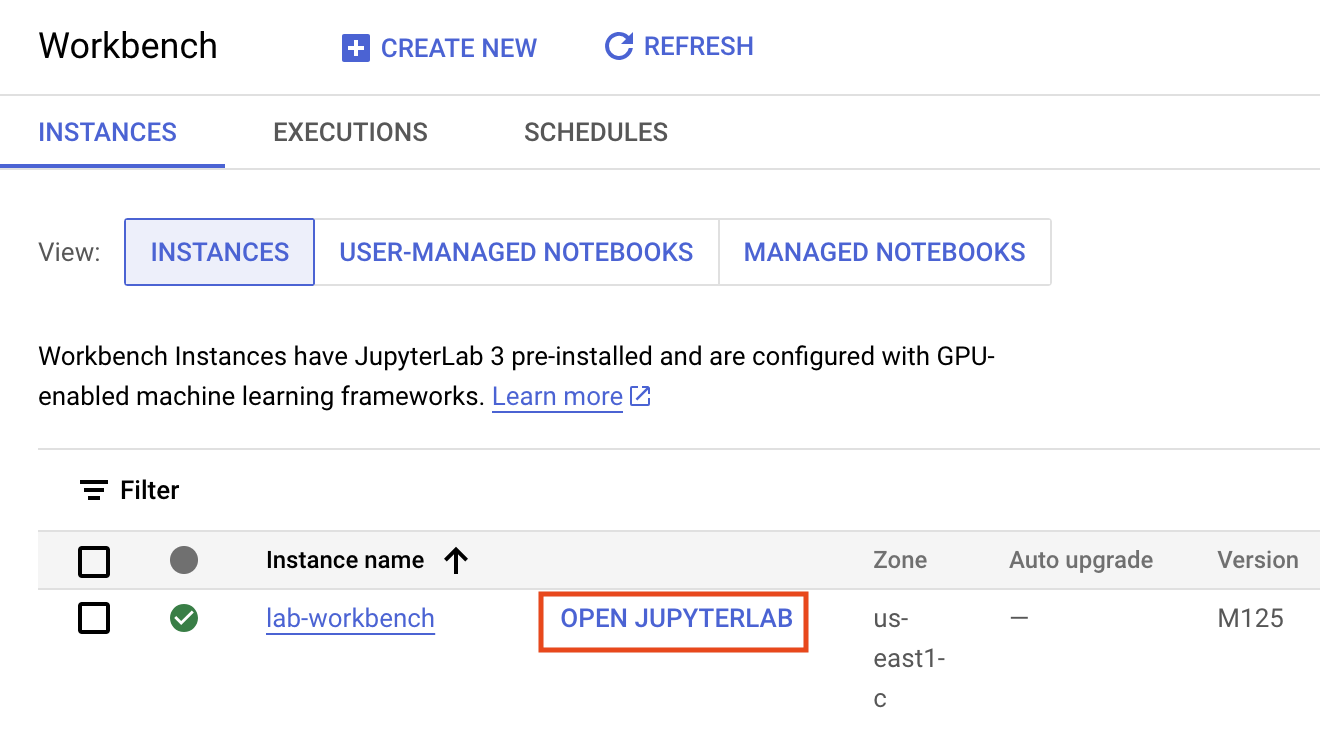
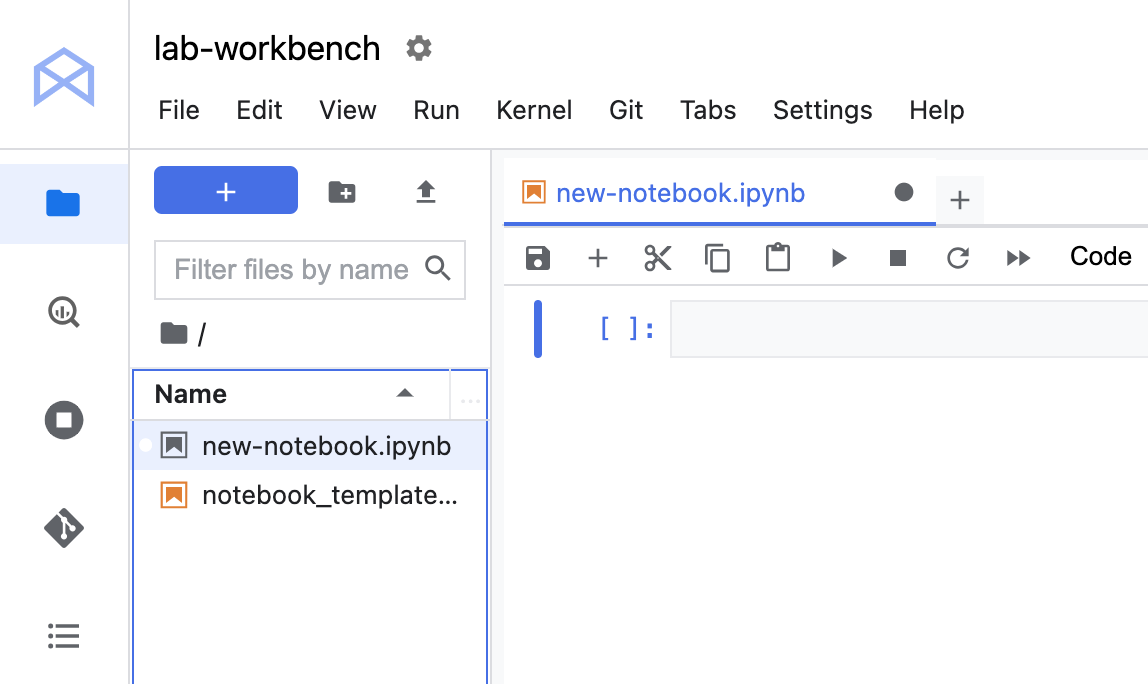
In the Navigation menu, click Workbench.
At the top of the Workbench page, ensure you are in the Instances view.
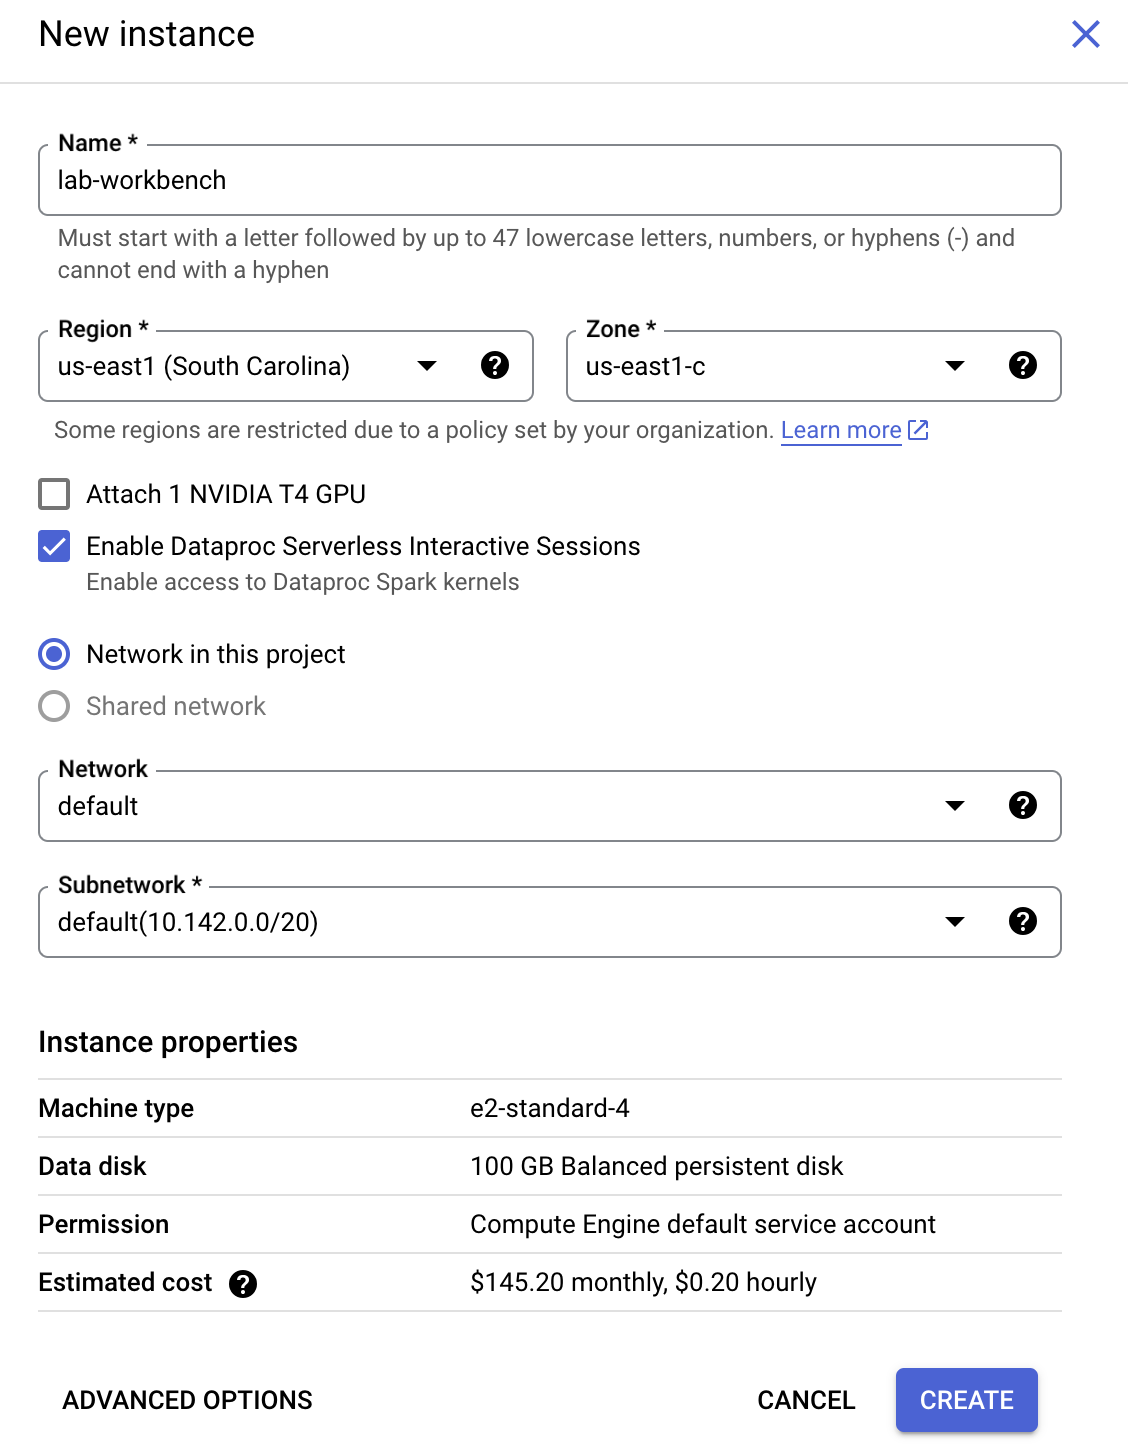
Click 
Configure the Instance:
This will take a few minutes to create the instance. A green checkmark will appear next to its name when it's ready.
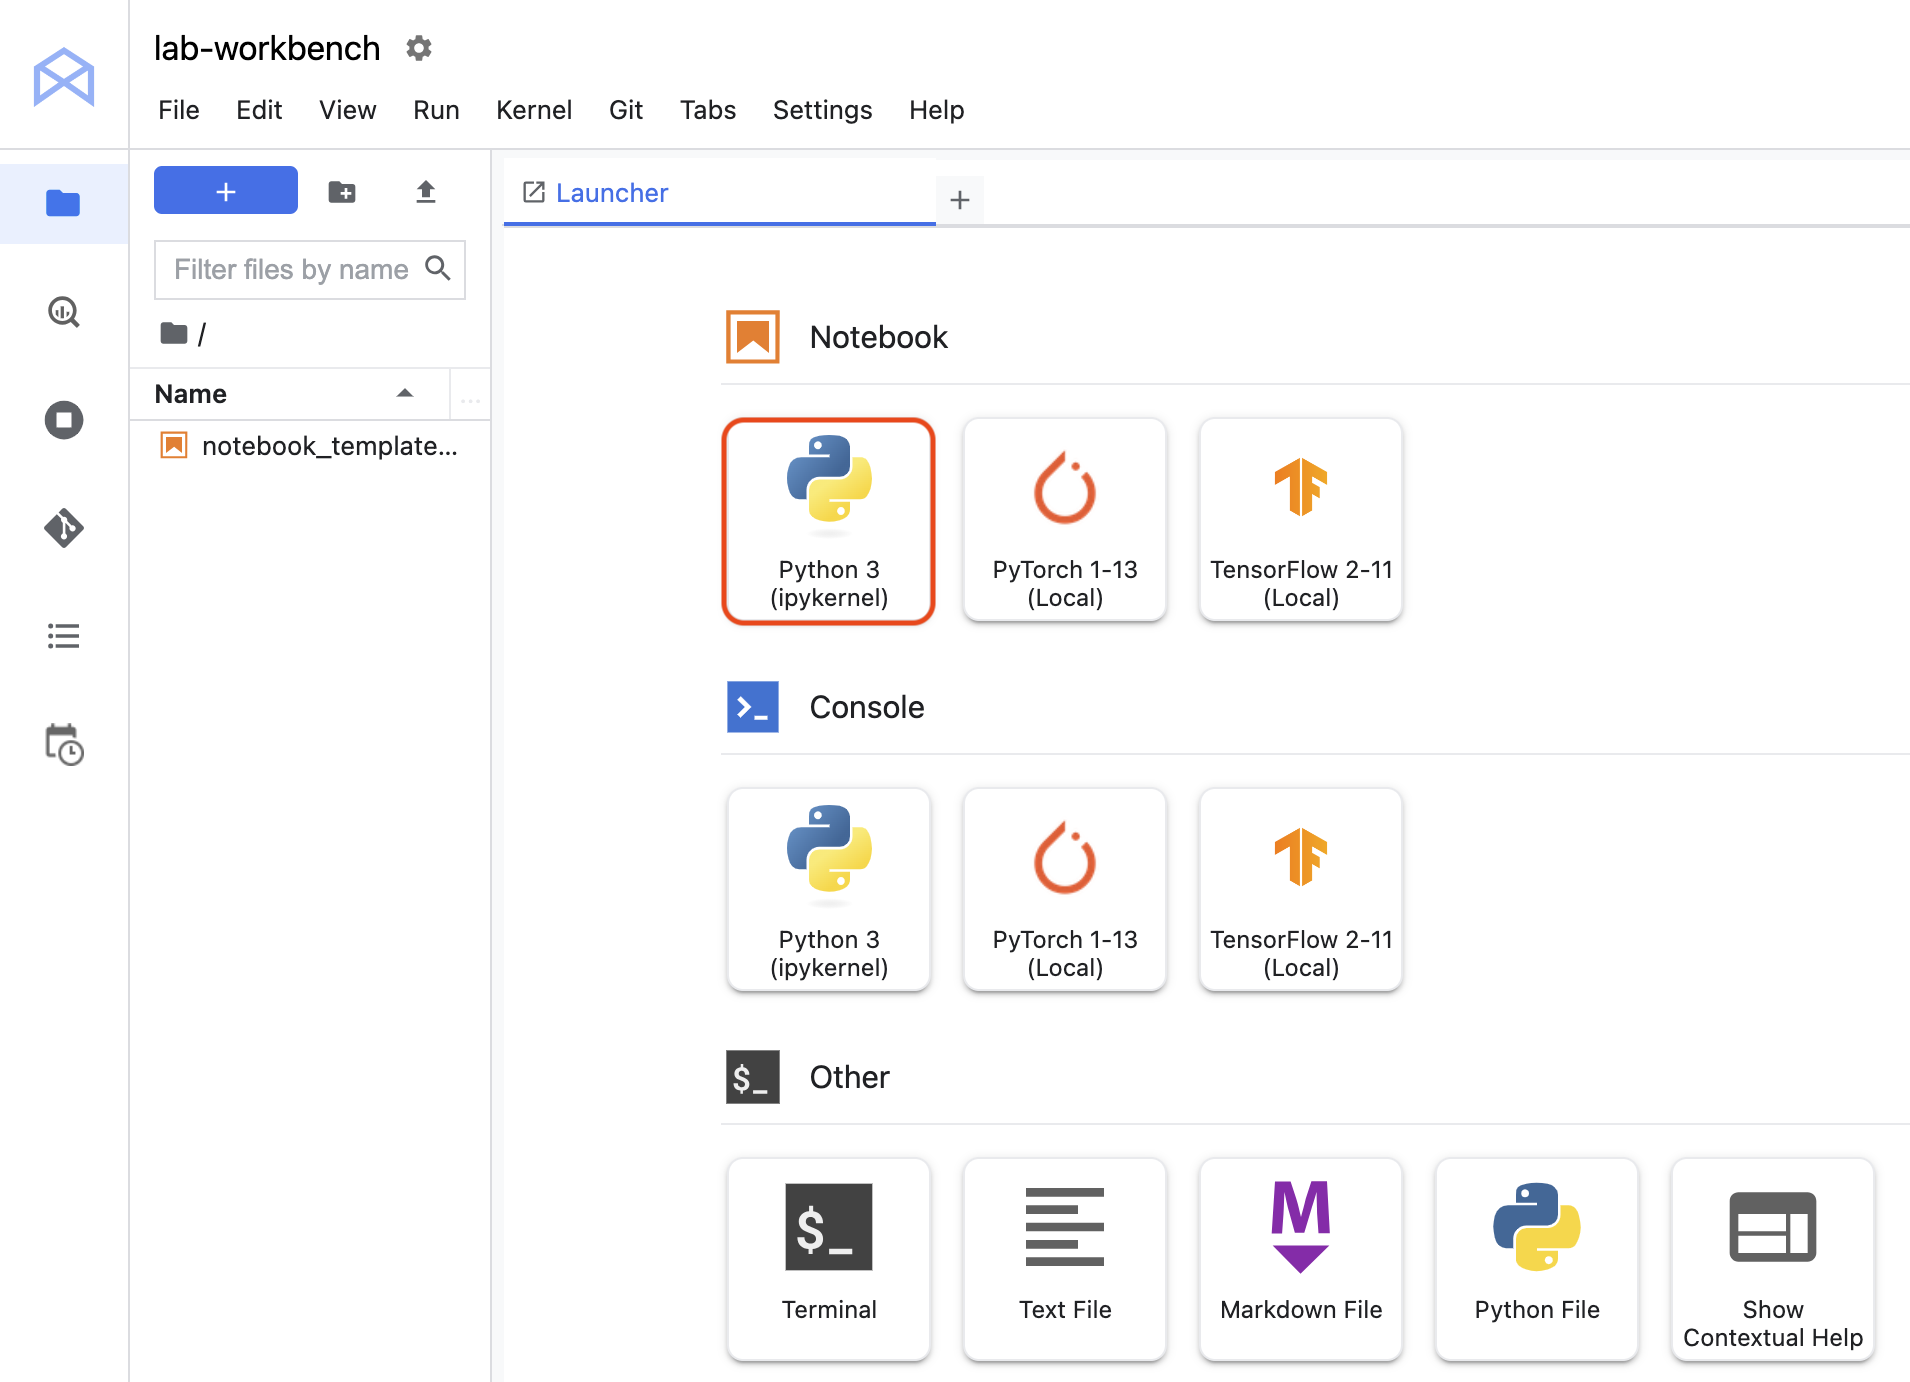
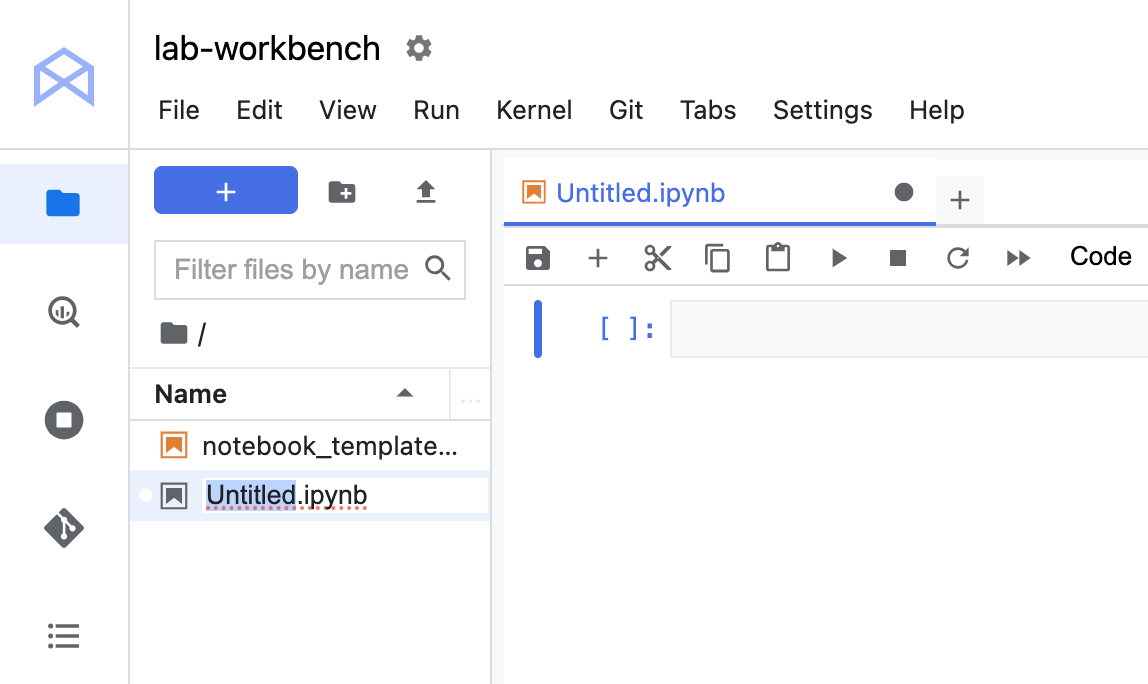
Untitled.ipynb file in the menu bar and select Rename Notebook to give it a meaningful name.Your environment is set up. You are now ready to start working with your Vertex AI Workbench notebook.
Click Check my progress to verify the objective.
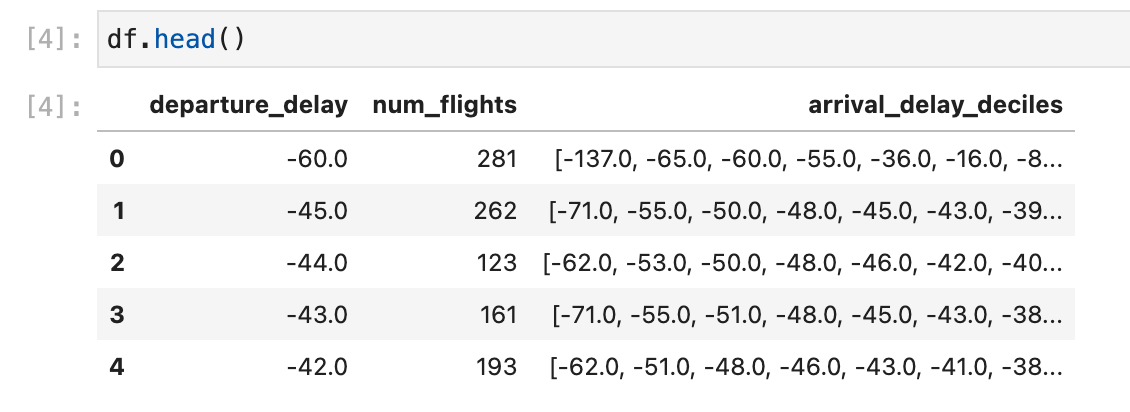
The command makes use of the magic function %%bigquery. Magic functions in notebooks provide an alias for a system command. In this case, %%bigquery runs the query in the cell in BigQuery and stores the output in a Pandas DataFrame object named df.
Click Check my progress to verify the objective.
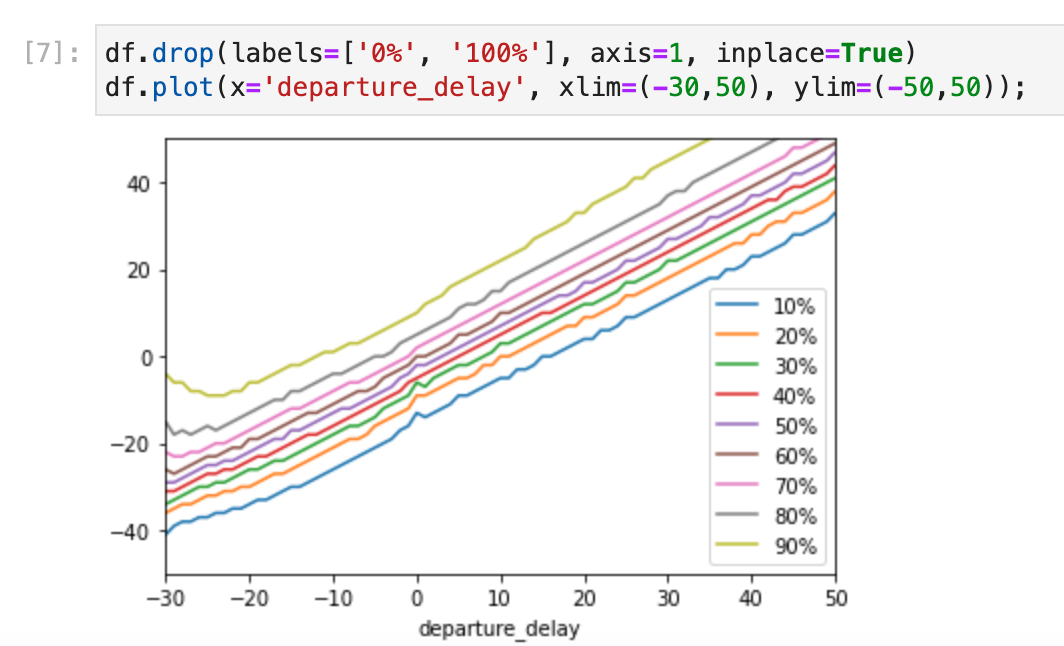
We're going to use the Pandas DataFrame containing our query output to build a plot that depicts how arrival delays correspond to departure delays. Before continuing, if you are unfamiliar with Pandas the Ten Minute Getting Started Guide is recommended reading.
arrival_delay_deciles into a Pandas Series object.
The code also renames the resulting columns.percentiles table to the departure_delay field in our original DataFrame. Execute the following code in a new cell:0% and 100% fields. Execute the following code in a new cell:When you have completed your lab, click End Lab. Qwiklabs removes the resources you’ve used and cleans the account for you.
You will be given an opportunity to rate the lab experience. Select the applicable number of stars, type a comment, and then click Submit.
The number of stars indicates the following:
You can close the dialog box if you don't want to provide feedback.
For feedback, suggestions, or corrections, please use the Support tab.
Copyright 2022 Google LLC All rights reserved. Google and the Google logo are trademarks of Google LLC. All other company and product names may be trademarks of the respective companies with which they are associated.


현재 이 콘텐츠를 이용할 수 없습니다
이용할 수 있게 되면 이메일로 알려드리겠습니다.

감사합니다
이용할 수 있게 되면 이메일로 알려드리겠습니다.

한 번에 실습 1개만 가능
모든 기존 실습을 종료하고 이 실습을 시작할지 확인하세요.