The purpose of this lab is to show learners how to instantiate a Jupyter notebook running on Google Cloud's Vertex AI service. To aid in the demonstration, a dataset with various flight departure and arrival times will be leveraged.
Objectives
In this lab, you will learn how to perform the following tasks:
Instantiate a Jupyter notebook on Vertex AI.
Execute a BigQuery query from within a Jupyter notebook and process the output using Pandas.
Setup and requirements
For each lab, you get a new Google Cloud project and set of resources for a fixed time at no cost.
Sign in to Qwiklabs using an incognito window.
Note the lab's access time (for example, 1:15:00), and make sure you can finish within that time.
There is no pause feature. You can restart if needed, but you have to start at the beginning.
When ready, click Start lab.
Note your lab credentials (Username and Password). You will use them to sign in to the Google Cloud Console.
Click Open Google Console.
Click Use another account and copy/paste credentials for this lab into the prompts.
If you use other credentials, you'll receive errors or incur charges.
Accept the terms and skip the recovery resource page.
Open BigQuery Console
In the Google Cloud Console, on the Navigation menu , click BigQuery.
The Welcome to BigQuery in the Cloud Console dialog opens. This dialog provides a link to the quickstart guide and lists UI updates.
Click Done to close the dialog.
Task 1. Launch Vertex AI Workbench instance
In the Google Cloud console, from the Navigation menu (), select Vertex AI > Dashboard.
Click Enable All Recommended APIs.
In the Navigation menu, click Workbench.
At the top of the Workbench page, ensure you are in the Instances view.
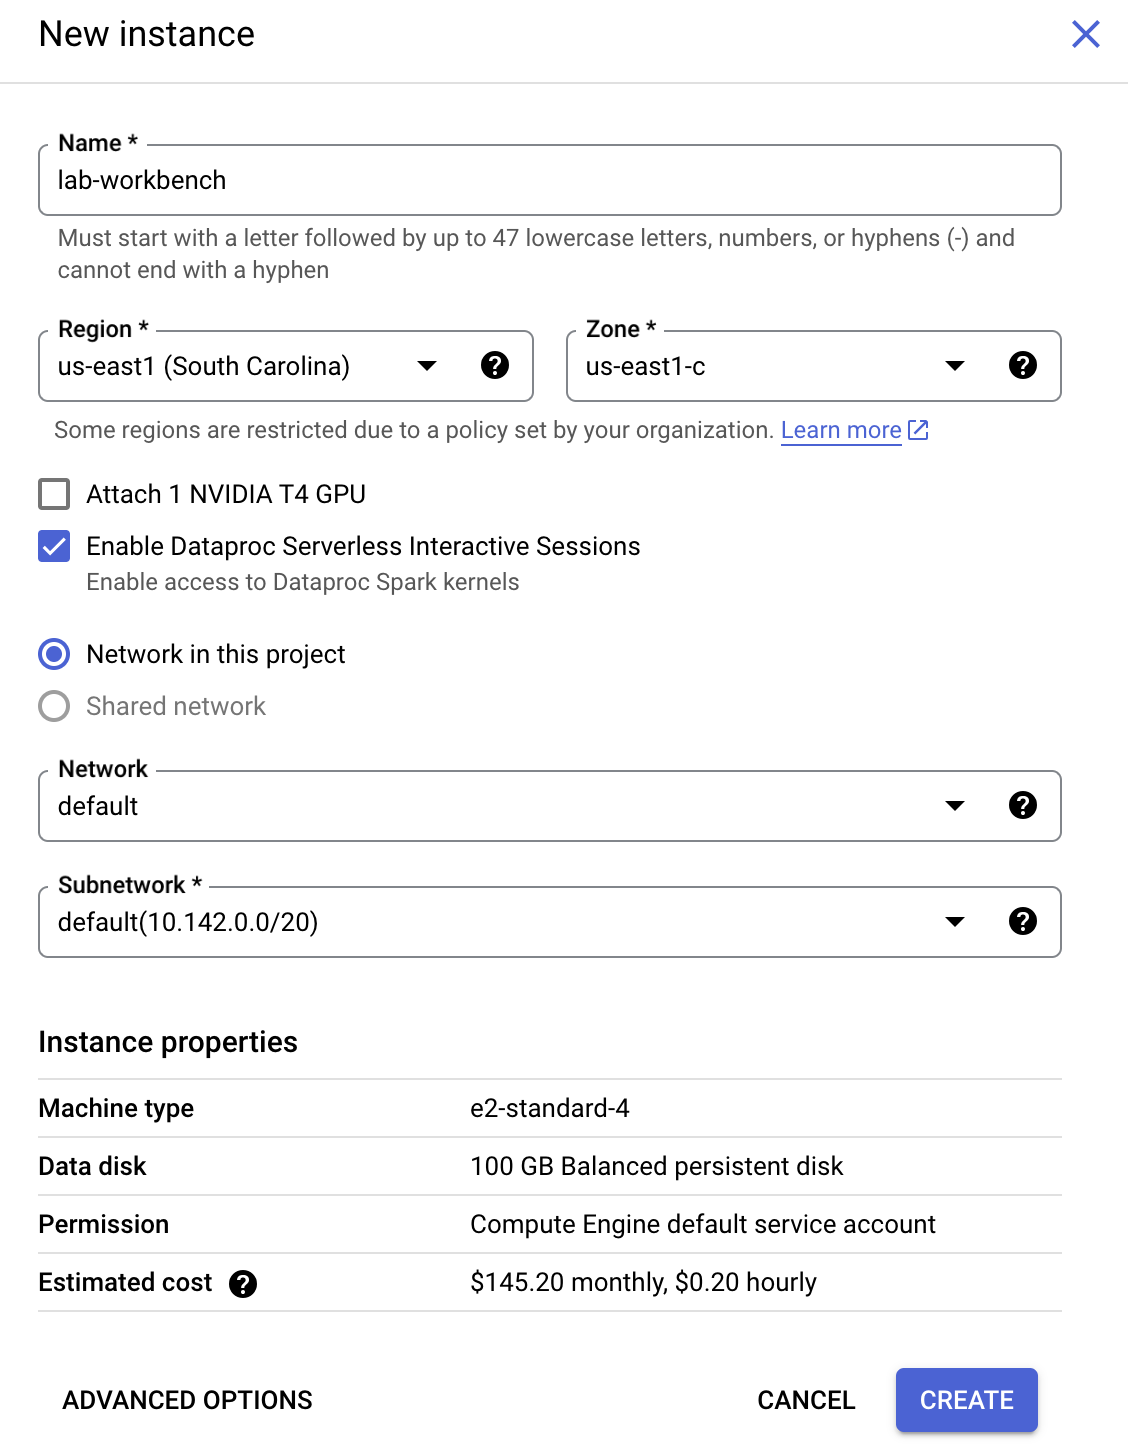
Click Create New.
Configure the Instance:
Name: lab-workbench
Region: Set the region to
Zone: Set the zone to
Advanced Options (Optional): If needed, click "Advanced Options" for further customization (e.g., machine type, disk size).
Click Create.
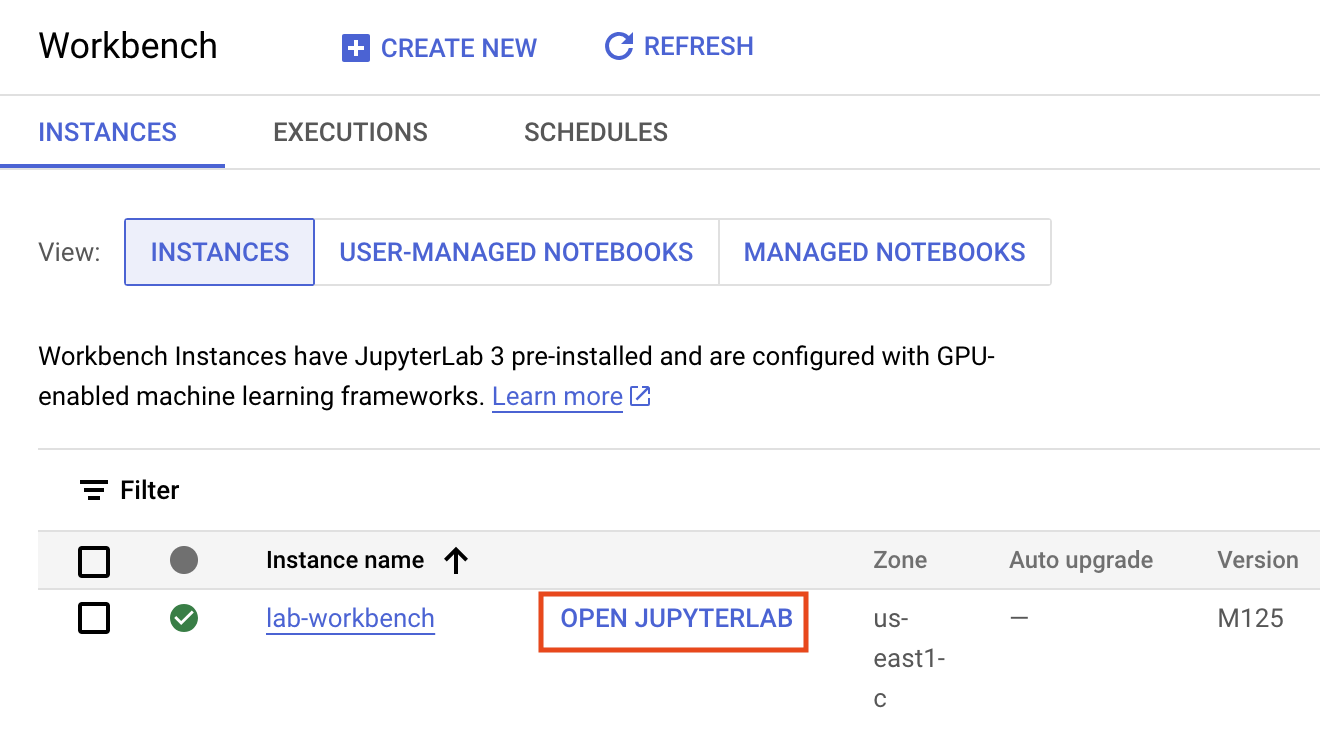
This will take a few minutes to create the instance. A green checkmark will appear next to its name when it's ready.
Click Open Jupyterlab next to the instance name to launch the JupyterLab interface. This will open a new tab in your browser.
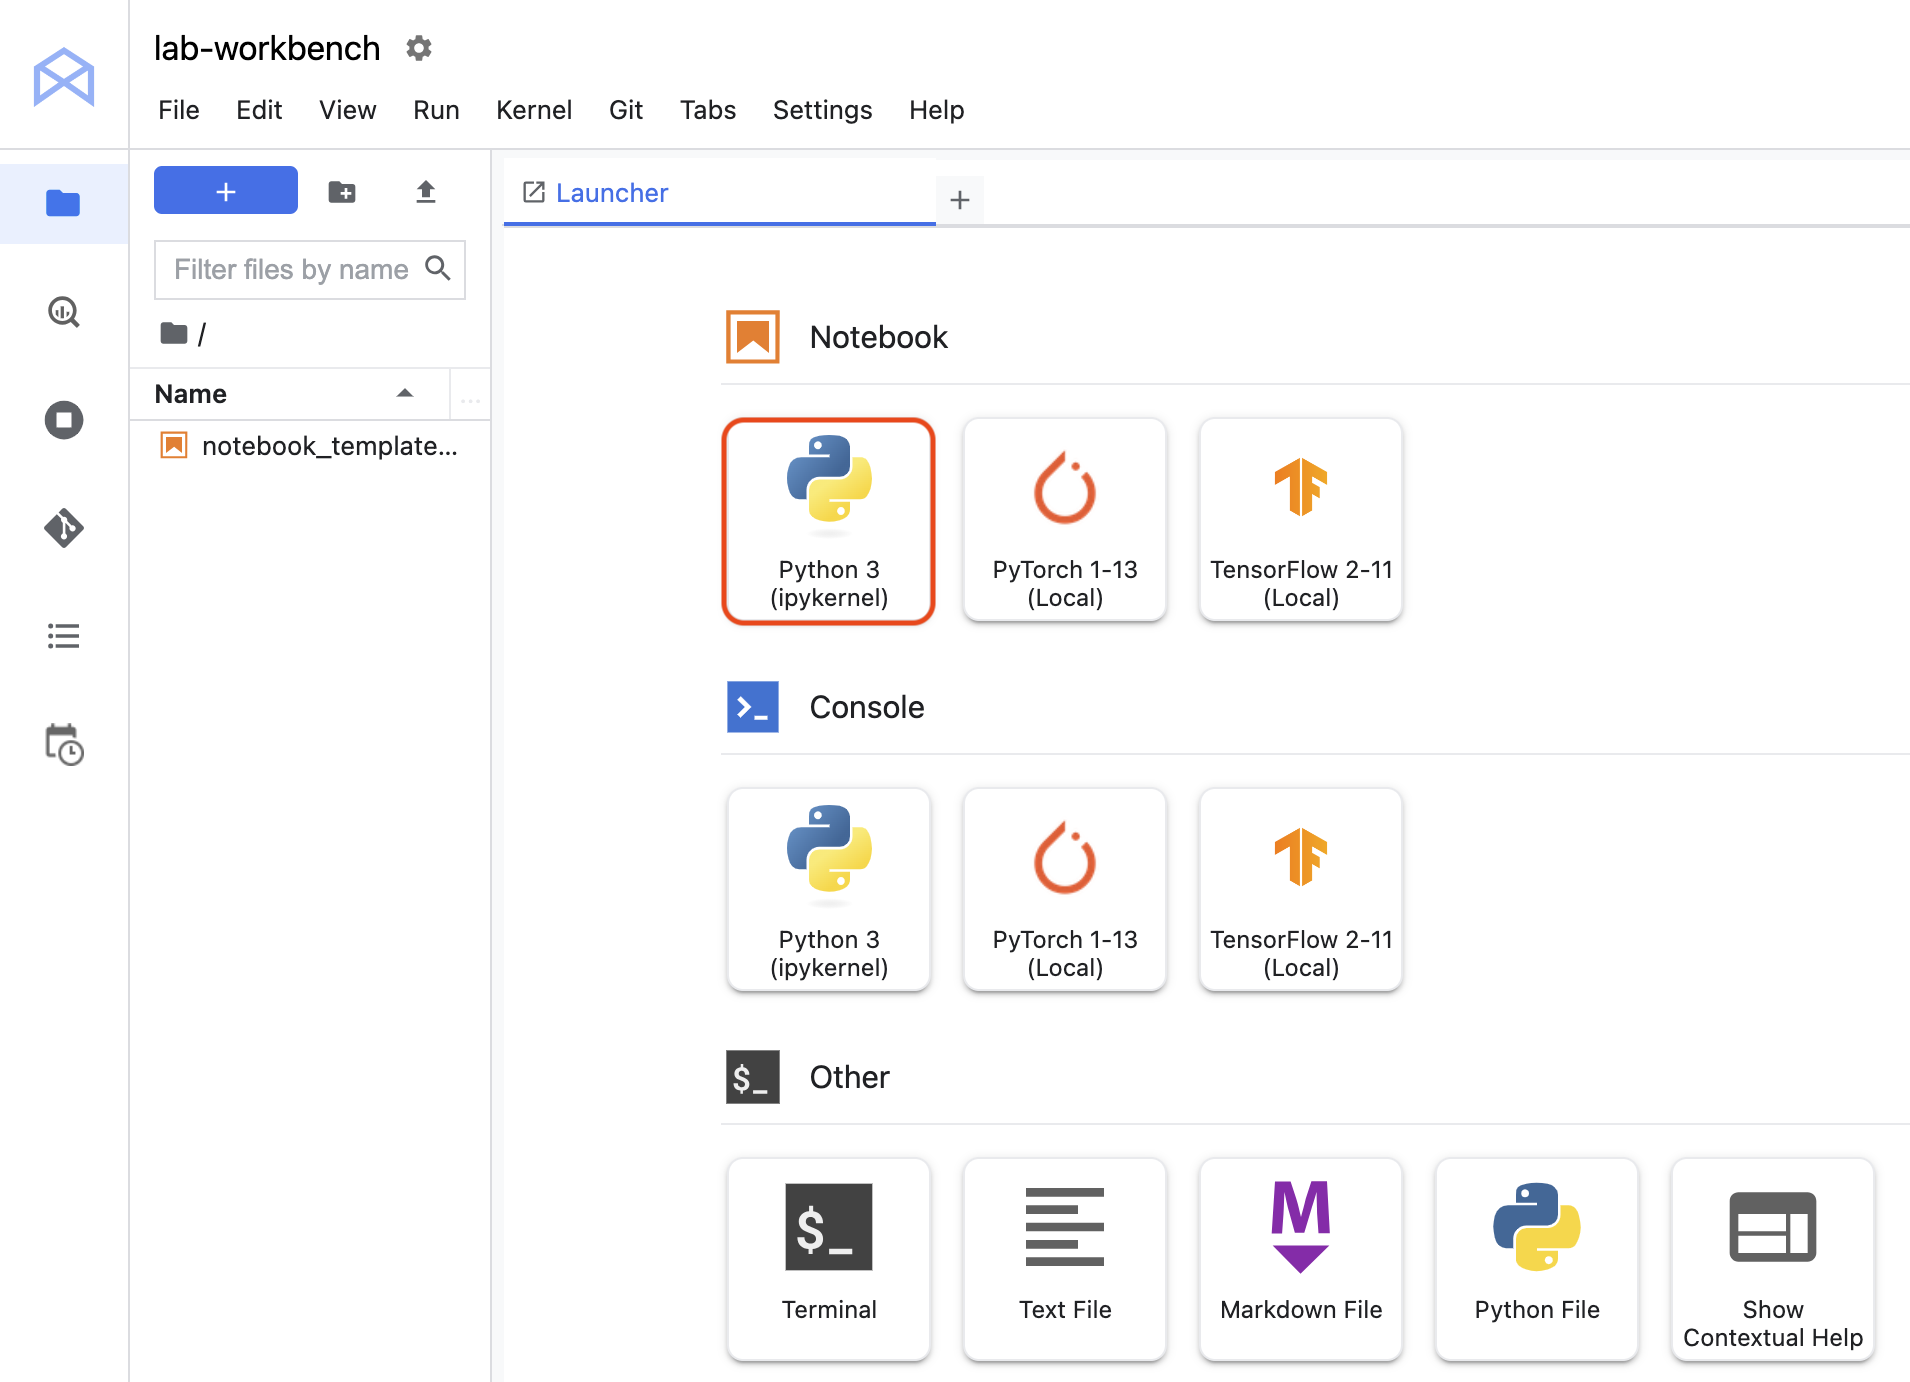
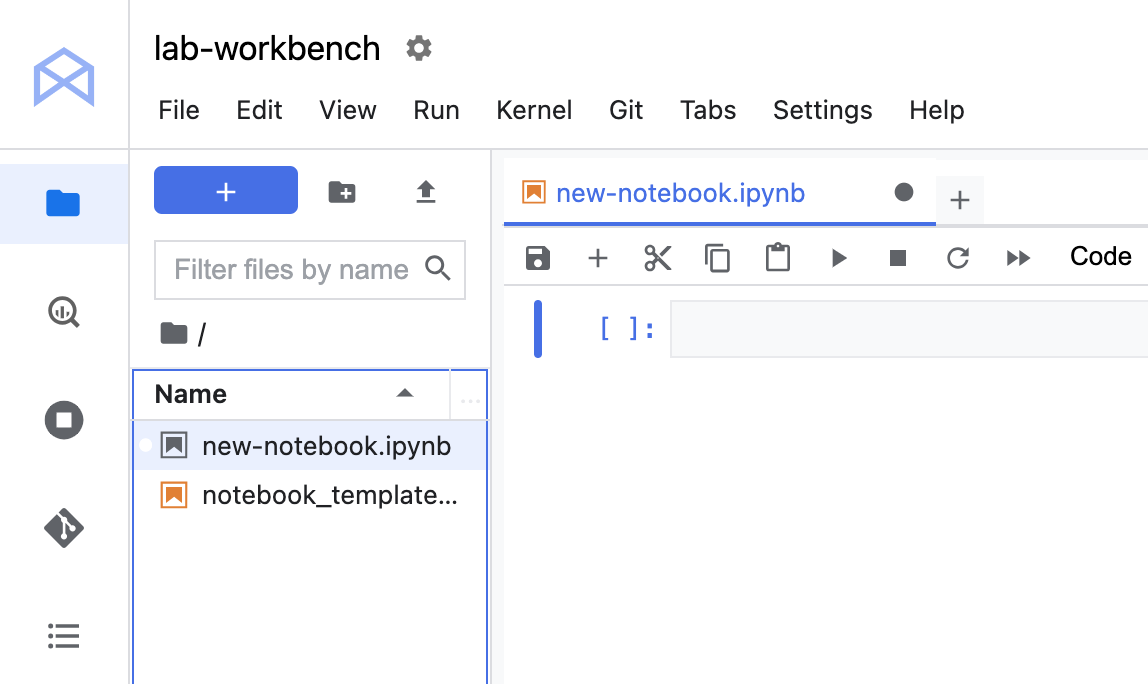
Click the Python 3 icon to launch a new Python notebook.
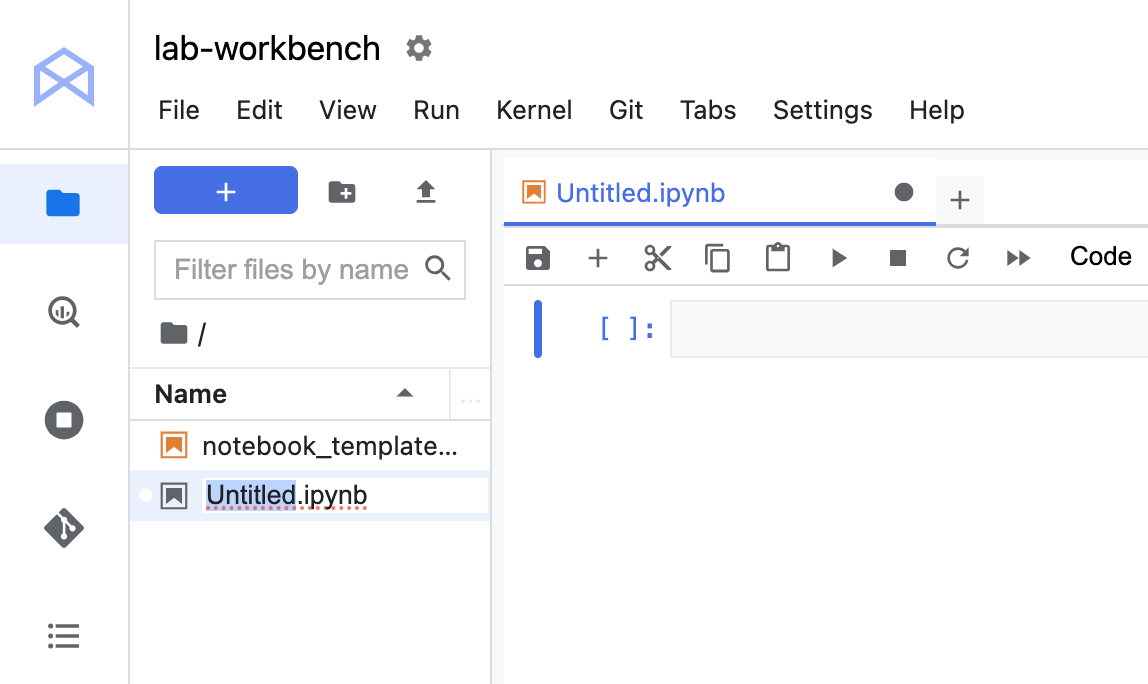
Right-click on the Untitled.ipynb file in the menu bar and select Rename Notebook to give it a meaningful name.
Your environment is set up. You are now ready to start working with your Vertex AI Workbench notebook.
Click Check my progress to verify the objective.
Launch Vertex AI Workbench instance
Task 2. Execute a BigQuery query
Enter the following query in the first cell of the notebook:
%%bigquery df --use_rest_api
SELECT
depdelay as departure_delay,
COUNT(1) AS num_flights,
APPROX_QUANTILES(arrdelay, 10) AS arrival_delay_deciles
FROM
`cloud-training-demos.airline_ontime_data.flights`
WHERE
depdelay is not null
GROUP BY
depdelay
HAVING
num_flights > 100
ORDER BY
depdelay ASC
The command makes use of the magic function %%bigquery. Magic functions in notebooks provide an alias for a system command. In this case, %%bigquery runs the query in the cell in BigQuery and stores the output in a Pandas DataFrame object named df.
Run the cell by hitting Shift + Enter, when the cursor is in the cell. Alternatively, if you navigate to the Run tab you can click on Run Selected Cells. Note the keyboard shortcut for this action in case it is not Shift + Enter. There should be no output when executing the command.
Click Check my progress to verify the objective.
Execute a BigQuery query
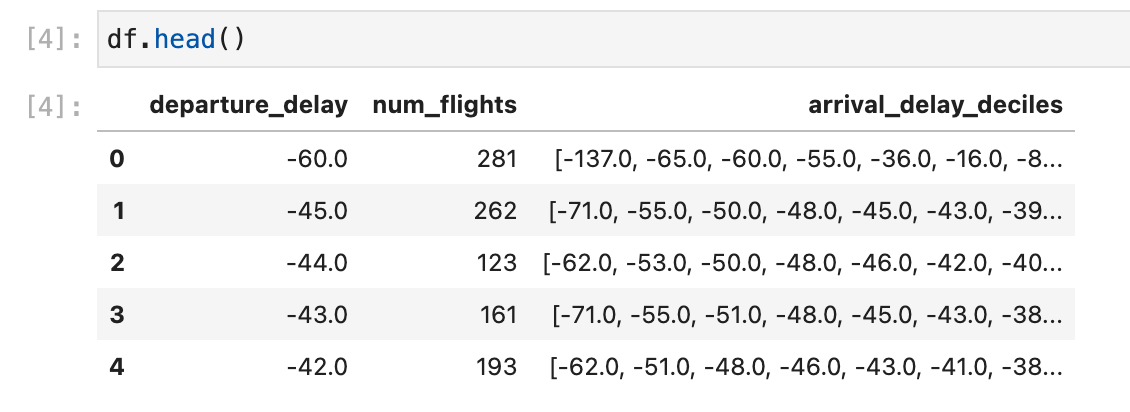
View the first five rows of the query's output by executing the following code in a new cell:
df.head()
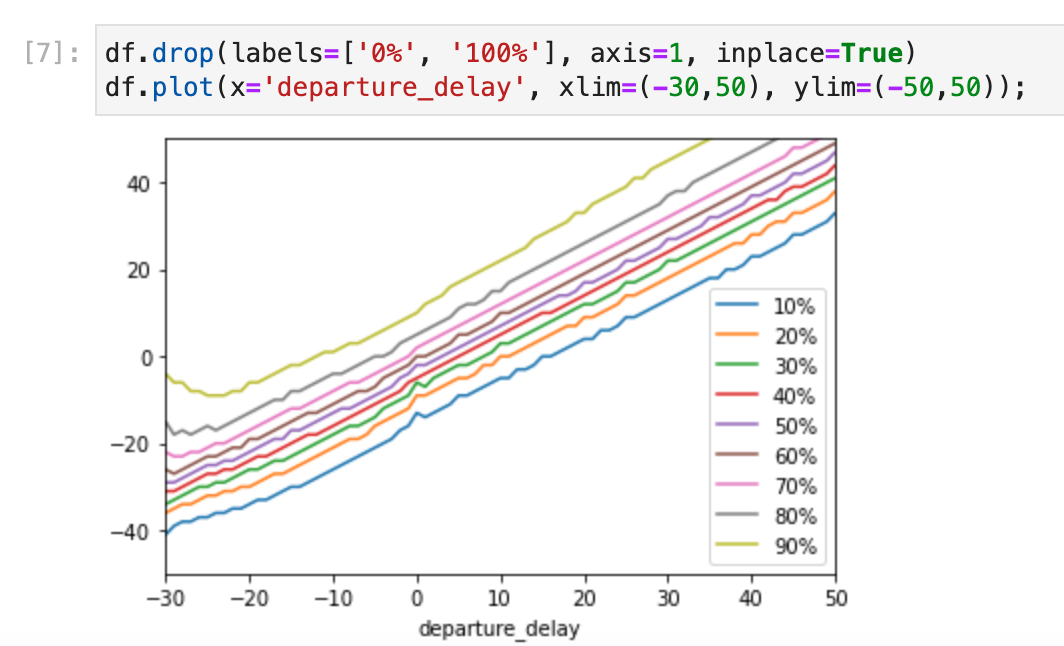
Task 3. Make a plot with Pandas
We're going to use the Pandas DataFrame containing our query output to build a plot that depicts how arrival delays correspond to departure delays. Before continuing, if you are unfamiliar with Pandas the Ten Minute Getting Started Guide is recommended reading.
To get a DataFrame containing the data we need, we first have to wrangle the raw query output. Enter the following code in a new cell to convert the list of arrival_delay_deciles into a Pandas Series object.
The code also renames the resulting columns.
import pandas as pd
percentiles = df['arrival_delay_deciles'].apply(pd.Series)
percentiles.rename(columns = lambda x : '{0}%'.format(x*10), inplace=True)
percentiles.head()
Since we want to relate departure delay times to arrival delay times, we have to concatenate our percentiles table to the departure_delay field in our original DataFrame. Execute the following code in a new cell:
When you have completed your lab, click End Lab. Qwiklabs removes the resources you’ve used and cleans the account for you.
You will be given an opportunity to rate the lab experience. Select the applicable number of stars, type a comment, and then click Submit.
The number of stars indicates the following:
1 star = Very dissatisfied
2 stars = Dissatisfied
3 stars = Neutral
4 stars = Satisfied
5 stars = Very satisfied
You can close the dialog box if you don't want to provide feedback.
For feedback, suggestions, or corrections, please use the Support tab.
Copyright 2022 Google LLC All rights reserved. Google and the Google logo are trademarks of Google LLC. All other company and product names may be trademarks of the respective companies with which they are associated.
Lab membuat project dan resource Google Cloud untuk jangka waktu tertentu
Lab memiliki batas waktu dan tidak memiliki fitur jeda. Jika lab diakhiri, Anda harus memulainya lagi dari awal.
Di kiri atas layar, klik Start lab untuk memulai
Gunakan penjelajahan rahasia
Salin Nama Pengguna dan Sandi yang diberikan untuk lab tersebut
Klik Open console dalam mode pribadi
Login ke Konsol
Login menggunakan kredensial lab Anda. Menggunakan kredensial lain mungkin menyebabkan error atau dikenai biaya.
Setujui persyaratan, dan lewati halaman resource pemulihan
Jangan klik End lab kecuali jika Anda sudah menyelesaikan lab atau ingin mengulanginya, karena tindakan ini akan menghapus pekerjaan Anda dan menghapus project
Konten ini tidak tersedia untuk saat ini
Kami akan memberi tahu Anda melalui email saat konten tersedia
Bagus!
Kami akan menghubungi Anda melalui email saat konten tersedia
Satu lab dalam satu waktu
Konfirmasi untuk mengakhiri semua lab yang ada dan memulai lab ini
Gunakan penjelajahan rahasia untuk menjalankan lab
Gunakan jendela Samaran atau browser pribadi untuk menjalankan lab ini. Langkah ini akan mencegah konflik antara akun pribadi Anda dan akun Siswa yang dapat menyebabkan tagihan ekstra pada akun pribadi Anda.
The purpose of this lab is to show learners how to instantiate a Jupyter notebook running on Google Cloud's Vertex AI.
 ), select Vertex AI > Dashboard.
 Create New.