
准备工作
- 实验会创建一个 Google Cloud 项目和一些资源,供您使用限定的一段时间
- 实验有时间限制,并且没有暂停功能。如果您中途结束实验,则必须重新开始。
- 在屏幕左上角,点击开始实验即可开始
In this lab you analyze 2 different public datasets, run queries on them, separately and then combined, to derive interesting insights.
In this lab, you will:
This is a fundamental level lab and assumes some experience with BigQuery and SQL.
This lab uses two public datasets in BigQuery: weather data from the US National Oceanic and Atmospheric Administration (NOAA), and bicycle rental data from New York City.
You will encounter, for the first time, several aspects of Google Cloud Platform that are of great benefit to scientists:
The end-result is that you will find if there are lesser bike rentals on rainy days.
For each lab, you get a new Google Cloud project and set of resources for a fixed time at no cost.
Click the Start Lab button. If you need to pay for the lab, a pop-up opens for you to select your payment method. On the left is the Lab Details panel with the following:
Click Open Google Cloud console (or right-click and select Open Link in Incognito Window if you are running the Chrome browser).
The lab spins up resources, and then opens another tab that shows the Sign in page.
Tip: Arrange the tabs in separate windows, side-by-side.
If necessary, copy the Username below and paste it into the Sign in dialog.
You can also find the Username in the Lab Details panel.
Click Next.
Copy the Password below and paste it into the Welcome dialog.
You can also find the Password in the Lab Details panel.
Click Next.
Click through the subsequent pages:
After a few moments, the Google Cloud console opens in this tab.

In this task, you explore the public bigquery-public-data dataset, specifically the new_york_citibike dataset, by examining the schema of the citibike_trips table and running queries to analyze trip duration and calculate the total distance traveled by each bicycle.
 ) click BigQuery.
The Welcome to BigQuery in the Cloud Console message box opens. This message box provides a link to the quickstart guide and lists UI updates.
Click Done.
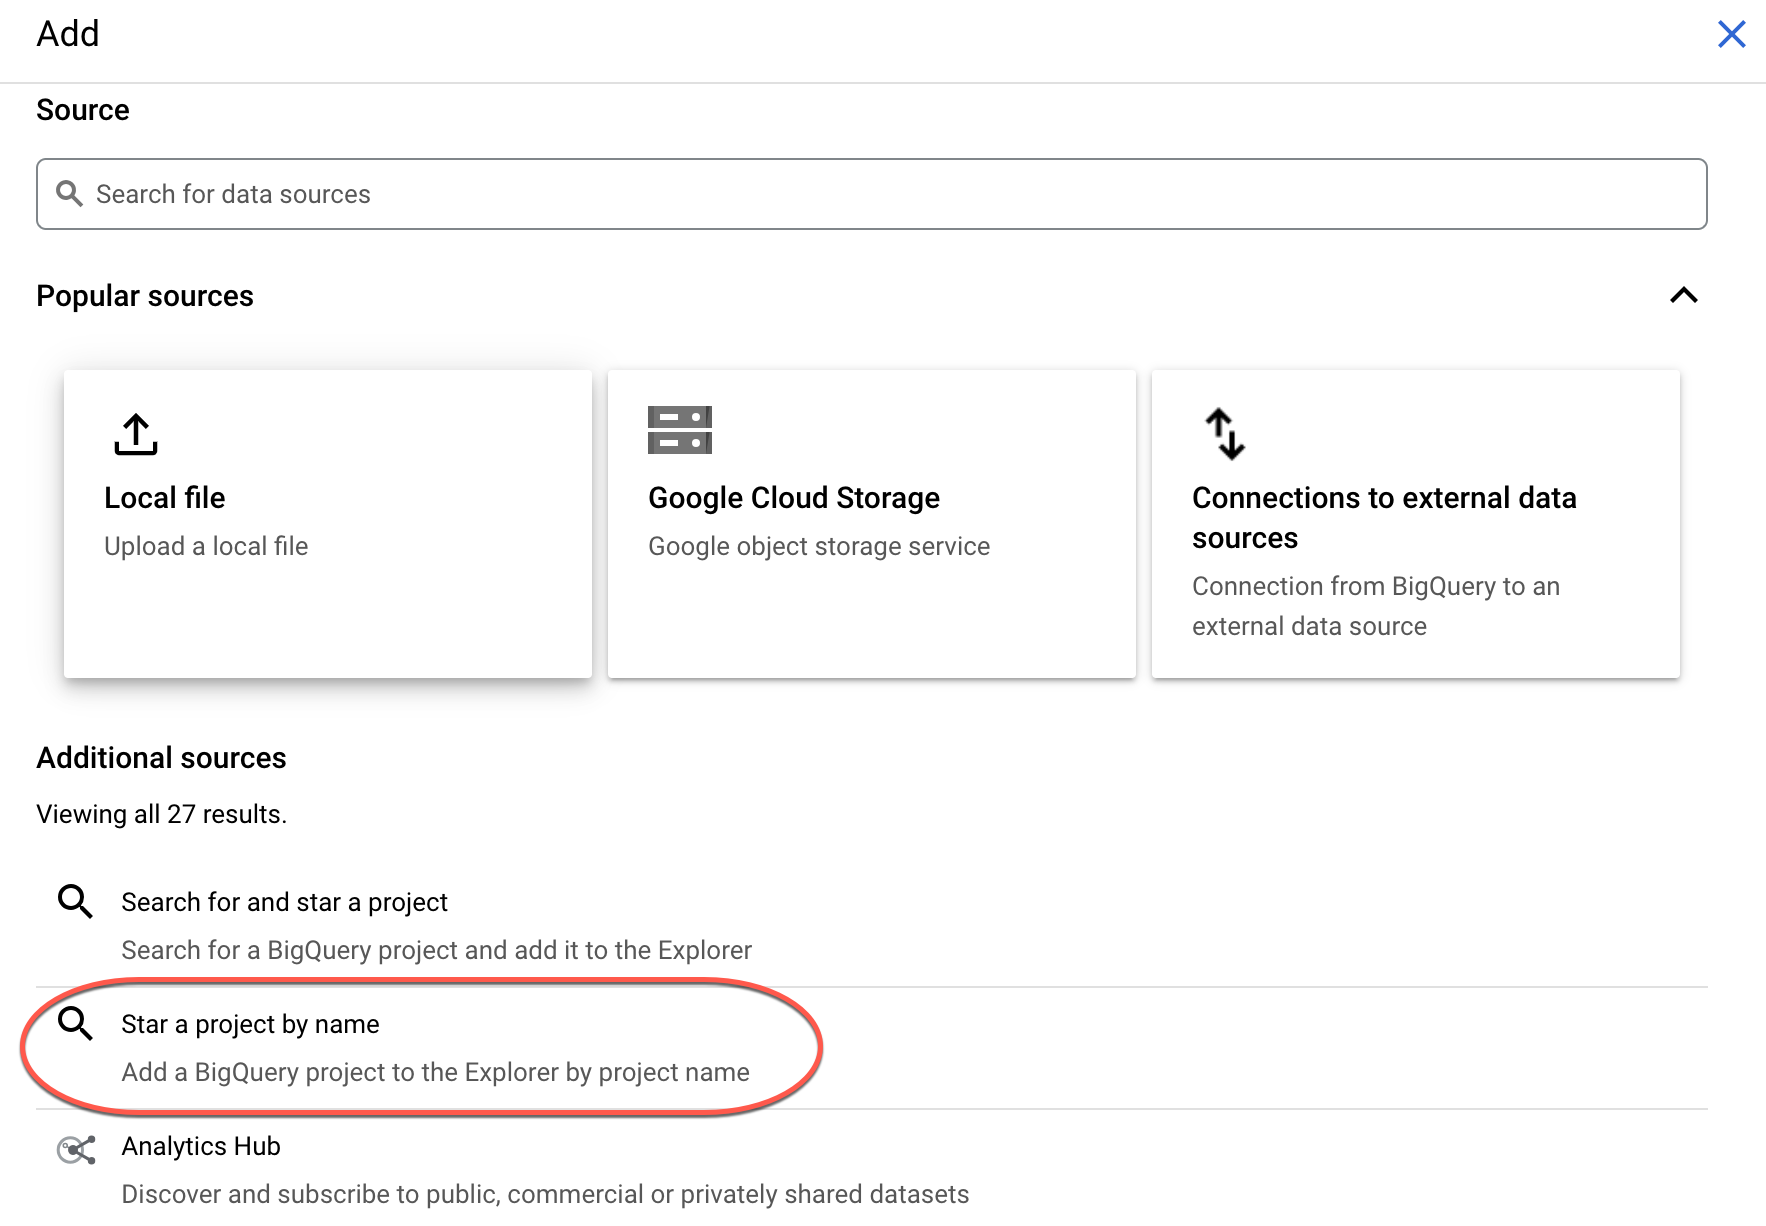
In the left pane, click + Add , then click Star a project by name, next in the pop-up window type bigquery-public-data, finally click Star.
In the BigQuery console, you see two projects in the left pane, one named your Qwiklabs project ID, and one named bigquery-public-data.
In the left pane of the BigQuery console, select bigquery-public-data > new_york_citibike > citibike_trips table.
In the Table (citibike_trips) window, click the Schema tab.
Examine the column names and the datatypes.
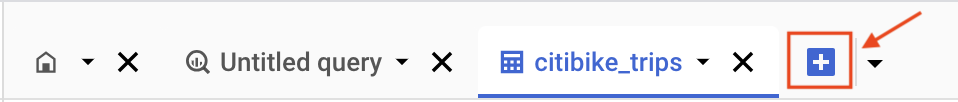
Click the Blue + button to compose a new query.
Enter the following query:
Click Run. Look at the result and try to determine what this query does ?
Next, run the query below to find another interesting fact: total distance traveled by each bicycle in the dataset. Note that the query limits the results to only top 5.
In this task, you explore the ghcn_d dataset, by previewing the ghcnd_2015 table and running a query to retrieve rainfall data from a New York weather station.
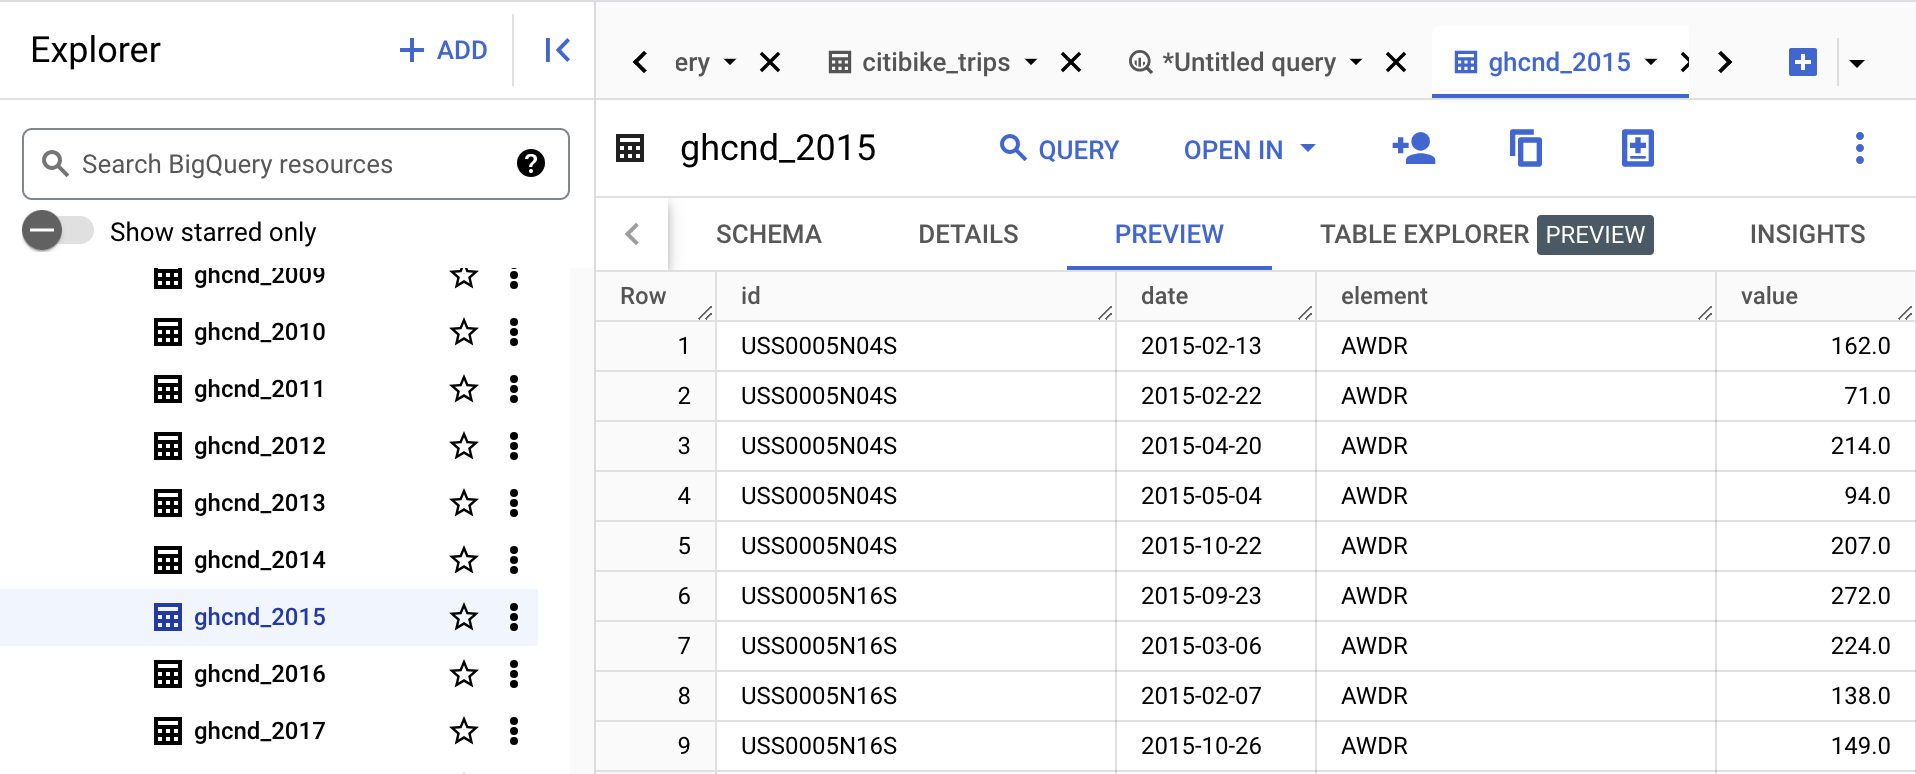
In the left pane of the BigQuery Console, select the newly added bigquery-public-data project and select ghcn_d > ghcnd_2015.
Then click on the Preview tab. Your console should resemble the following:
Examine the columns and some of the data values.
This query will return rainfall (in mm) for all days in 2015 from a weather station in New York whose id is provided in the query (the station corresponds to NEW YORK CNTRL PK TWR ).
In this task, you analyze the correlation between rain and bicycle rentals by joining the new_york_citibike.citibike_trips dataset with the ghcn_d.ghcnd_2015 weather dataset, determining the average number of bicycle trips on rainy versus non-rainy days.
How about joining the bicycle rentals data against weather data to learn whether there are fewer bicycle rentals on rainy days?
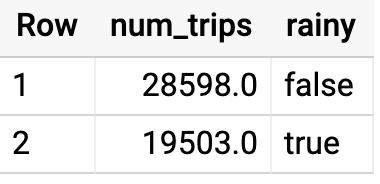
Now you can see the results of joining the bicycle rental dataset with a weather dataset that comes from a completely different source:
Running the query yields that, yes, New Yorkers ride the bicycle 47% fewer times when it rains.
In this lab you did ad-hoc queries on two datasets. You were able to query the data without setting up any clusters, creating any indexes, etc. You were also able to mash up the two datasets and get some interesting insights. All without ever leaving your browser!
You learned how to run some very interesting queries on BigQuery!
When you have completed your lab, click End Lab. Google Cloud Skills Boost removes the resources you’ve used and cleans the account for you.
You will be given an opportunity to rate the lab experience. Select the applicable number of stars, type a comment, and then click Submit.
The number of stars indicates the following:
You can close the dialog box if you don't want to provide feedback.
For feedback, suggestions, or corrections, please use the Support tab.
Copyright 2022 Google LLC All rights reserved. Google and the Google logo are trademarks of Google LLC. All other company and product names may be trademarks of the respective companies with which they are associated.


此内容目前不可用
一旦可用,我们会通过电子邮件告知您

太好了!
一旦可用,我们会通过电子邮件告知您

一次一个实验
确认结束所有现有实验并开始此实验