


Before you begin
- Labs create a Google Cloud project and resources for a fixed time
- Labs have a time limit and no pause feature. If you end the lab, you'll have to restart from the beginning.
- On the top left of your screen, click Start lab to begin
Provision Lab Environment
/ 20
Container-native Load Balancing Through Ingress
/ 20
Load Testing an Application
/ 20
Readiness and Liveness Probes
/ 20
Create Pod Disruption Budgets
/ 20
One of the many benefits of using Google Cloud is its billing model that bills you for only the resources you use. With that in mind, it's imperative that you not only allocate a reasonable amount of resources for your apps and infrastructure, but that you make the most efficient use of them. With GKE there are a number of tools and strategies available to you that can reduce the use of different resources and services while also improving your application's availability.
This lab will walk through a few concepts that will help increase the resource efficiency and availability of your workloads. By understanding and fine-tuning your cluster's workload, you can better ensure you are only using the resources you need and optimizing your cluster's costs.
In this lab, you will learn how to:
Read these instructions. Labs are timed and you cannot pause them. The timer, which starts when you click Start Lab, shows how long Google Cloud resources are made available to you.
This hands-on lab lets you do the lab activities in a real cloud environment, not in a simulation or demo environment. It does so by giving you new, temporary credentials you use to sign in and access Google Cloud for the duration of the lab.
To complete this lab, you need:
Click the Start Lab button. If you need to pay for the lab, a dialog opens for you to select your payment method. On the left is the Lab Details pane with the following:
Click Open Google Cloud console (or right-click and select Open Link in Incognito Window if you are running the Chrome browser).
The lab spins up resources, and then opens another tab that shows the Sign in page.
Tip: Arrange the tabs in separate windows, side-by-side.
If necessary, copy the Username below and paste it into the Sign in dialog.
You can also find the Username in the Lab Details pane.
Click Next.
Copy the Password below and paste it into the Welcome dialog.
You can also find the Password in the Lab Details pane.
Click Next.
Click through the subsequent pages:
After a few moments, the Google Cloud console opens in this tab.

Cloud Shell is a virtual machine that is loaded with development tools. It offers a persistent 5GB home directory and runs on the Google Cloud. Cloud Shell provides command-line access to your Google Cloud resources.
Click Activate Cloud Shell 
Click through the following windows:
When you are connected, you are already authenticated, and the project is set to your Project_ID,
gcloud is the command-line tool for Google Cloud. It comes pre-installed on Cloud Shell and supports tab-completion.
Output:
Output:
gcloud, in Google Cloud, refer to the gcloud CLI overview guide.
Click Authorize.
Create a three node cluster:
The --enable-ip-alias flag is included in order to enable the use of alias IPs for pods which will be required for container-native load balancing through an ingress.
For this lab, you'll use a simple HTTP web app that you will first deploy as a single pod.
gb-frontend pod:1 to 2 minutes to get the score for this task.Click Check my progress to verify the objective.
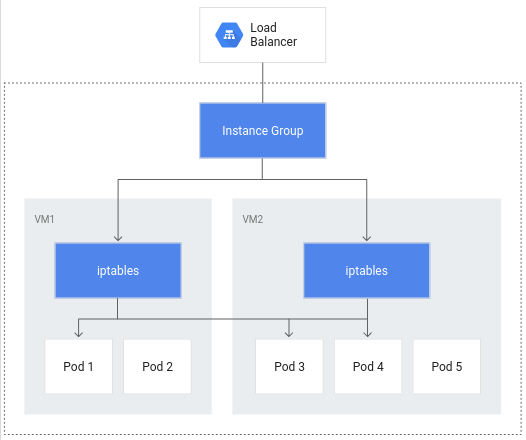
Container-native load balancing allows load balancers to target Kubernetes Pods directly and to evenly distribute traffic to pods.
Without container-native load balancing, load balancer traffic would travel to node instance groups and then be routed via iptables rules to pods which may or may not be in the same node:
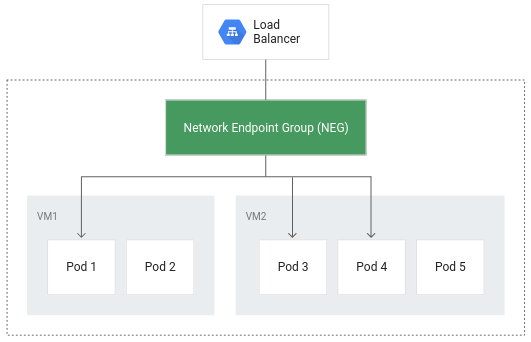
Container-native load balancing allows pods to become the core objects for load balancing, potentially reducing the number of network hops:
In addition to more efficient routing, container-native load balancing results in substantially reduced network utilization,improved performance, even distribution of traffic across Pods, and application-level health checks.
In order to take advantage of container-native load balancing, the VPC-native setting must be enabled on the cluster. This was indicated when you created the cluster and included the --enable-ip-alias flag.
ClusterIP service that will be used to route traffic to your application pod to allow GKE to create a network endpoint group:The manifest includes an annotations field where the annotation for cloud.google.com/neg will enable container-native load balancing on for your application when an ingress is created.
When the ingress is created, an HTTP(S) load balancer is created along with an NEG (Network Endpoint Group) in each zone in which the cluster runs. After a few minutes, the ingress will be assigned an external IP.
The load balancer it created has a backend service running in your project that defines how Cloud Load Balancing distributes traffic. This backend service has a health status associated with it.
It will take a few minutes before your health check returns a healthy status.
Output will look something like this:
Once the health state for each instance reports as HEALTHY, you can access the application via its external IP.
Click Check my progress to verify the objective.
Understanding your application capacity is an important step to take when choosing resource requests and limits for your application's pods and for deciding the best auto-scaling strategy.
At the start of the lab, you deployed your app as a single pod. By load testing your application running on a single pod with no autoscaling configured, you will learn how many concurrent requests your application can handle, how much CPU and memory it requires, and how it might respond to heavy load.
To load test your pod, you'll use Locust, an open source load-testing framework.
The files in the provided locust-image directory include Locust configuration files.
Expected output:
Locust consists of a main and a number of worker machines to generate load.
If your External IP value is <pending>, wait a minute and rerun the previous command until a valid value is displayed.
[EXTERNAL_IP_ADDRESS]:8089 to open the Locust web page:Click Check my progress to verify the objective.
Locust allows you to swarm your application with many simultaneous users. You are able to simulate traffic by entering a number of users that are spawned at a certain rate.
For this example, to represent a typical load, enter 200 for the number of users to simulate and 20 for the hatch rate.
Click Start swarming.
After a few seconds, the status should read Running with 200 users and about 150 requests per second (RPS).
Switch to the Cloud Console and click Navigation menu (
Select Workloads from the left pane.
Then click on your deployed gb-frontend pod.
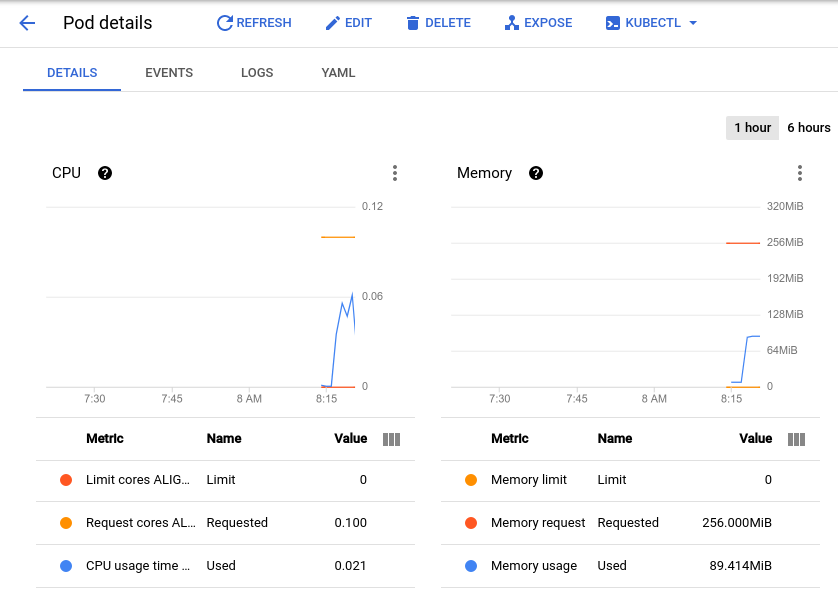
This will bring you to the pod details page where you can view a graph of the CPU and memory utilization of your pod. Observe the used values and the requested values.
With the current load test at about 150 requests per second, you may see the CPU utilization vary from as low as .04 and as high as .06. This represents 40-60% of your one pod's CPU request. On the other hand, memory utilization stays at around 80Mi, well below the requested 256Mi. This is your per-pod capacity. This information will be useful when configuring your Cluster Autoscaler, resource requests and limits, and choosing how or whether to implement a horizontal or vertical pod autoscaler.
Along with a baseline, you should also take into account how your application may perform after sudden bursts or spikes.
Return to the Locust browser window and click Edit under the status at the top of the page.
This time, enter 900 for the number of users to simulate and 300 for the hatch rate.
Click Start Swarming.
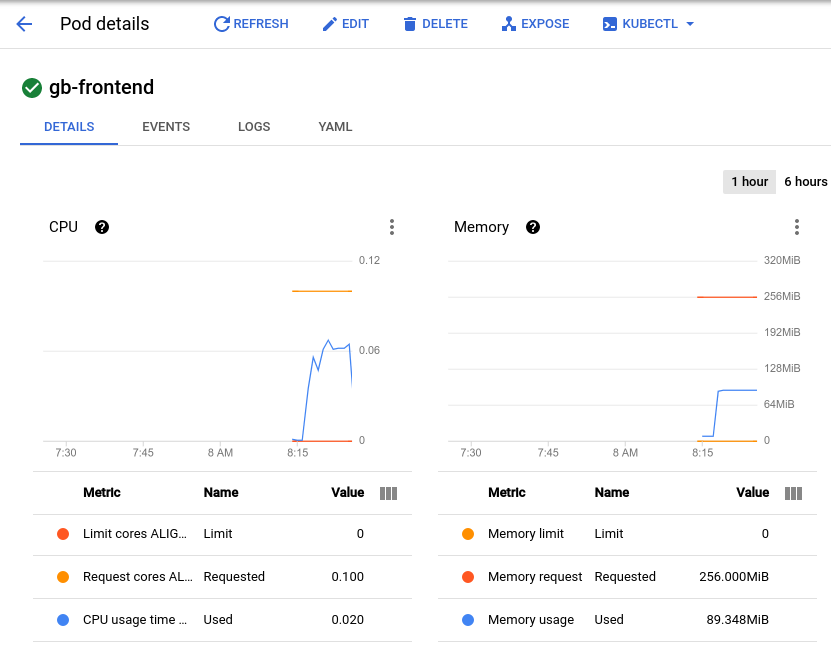
Your pod will suddenly receive 700 additional requests within 2 - 3 seconds. After the RPS value reaches about 150 and the status indicates 900 users, switch back to the Pod Details page and observe the change in the graphs.
While memory stays the same you'll see that CPU peaked at almost .07 - that's 70% of the CPU request for your pod. If this app were a deployment, you could probably safely reduce the total memory request to a lower amount and configure your horizontal autoscaler to trigger on CPU usage.
If configured in the Kubernetes pod or deployment spec, a liveness probe will continuously run to detect whether a container requires a restart and trigger that restart. They are helpful for automatically restarting deadlocked applications that may still be in a running state. For example, a kubernetes-managed load balancer (such as a service) would only send traffic to a pod backend if all of its containers pass a readiness probe.
The initialDelaySeconds value represents how long before the first probe should be performed after the container starts up. The periodSeconds value indicates how often the probe will be performed.
startupProbe which indicates whether the application within the container is started. If a startupProbe is present, no other probes will perform until it returns a Success state. This is recommended for applications that may have variable start-up times in order to avoid interruptions from a liveness probe.In this example the liveness probe is essentially checking if the file /tmp/alive exists on the container's file system.
At the bottom of the output there should be an Events section with the pod's last 5 events. At this point, the pod's events should only include the events related to its creation and start up:
This events log will include any failures in the liveness probe as well as restarts triggered as a result.
With the file removed, the cat command being used by the liveness probe should return a non-zero exit code.
Once again, check the pod's events:
As the liveness probe fails, you'll see events added to the log showing the series of steps that are kicked off. It will begin with the liveness probe failing (Liveness probe failed: cat: /tmp/alive: No such file or directory) and end with the container starting up once again (Started container):
livenessProbe that depends on the exit code of a specified command. In addition to a command probe, a livenessProbe could be configured as an HTTP probe that will depend on HTTP response, or a TCP probe that will depend on whether a TCP connection can be made on a specific port. Although a pod could successfully start and be considered healthy by a liveness probe, it's likely that it may not be ready to receive traffic right away. This is common for deployments that serve as a backend to a service such as a load balancer. A readiness probe is used to determine when a pod and its containers are ready to begin receiving traffic.
Enter the IP address in a browser window and you'll notice that you'll get an error message signifying that the site cannot be reached.
Check the pod's events:
The output will reveal that the readiness probe has failed:
Unlike the liveness probe, an unhealthy readiness probe does not trigger the pod to restart.
The Conditions section of the pod description should now show True as the value for Ready.
Output:
Setting meaningful readiness probes for your application containers ensures that pods are only receiving traffic when they are ready to do so. An example of a meaningful readiness probe is checking to see whether a cache your application relies on is loaded at startup.
Click Check my progress to verify the objective.
Part of ensuring reliability and uptime for your GKE application relies on leveraging pod disruption budgets (pdp). PodDisruptionBudget is a Kubernetes resource that limits the number of pods of a replicated application that can be down simultaneously due to voluntary disruptions.
Voluntary disruptions include administrative actions like deleting a deployment, updating a deployment's pod template and performing a rolling update, draining nodes that an application's pods reside on, or moving pods to different nodes.
First, you'll have to deploy your application as a deployment.
Click Check my progress to verify the objective.
Before creating a PDB, you will drain your cluster's nodes and observe your application's behavior without a PDB in place.
default-pool's nodes and running the kubectl drain command on each individual node:The command above will evict pods from the specified node and cordon the node so that no new pods can be created on it. If the available resources allow, pods are redeployed on a different node.
gb-frontend deployment's replica count:The output may resemble something like this:
After draining a node, your deployment could have as little as 0 replicas available, as indicated by the output above. Without any pods available, your application is effectively down. Let's try draining the nodes again, except this time with a pod disruption budget in place for your application.
The output should now resemble the following, with all 5 replicas available:
After successfully evicting one of your application's pods, it will loop through the following:
Press CTRL+C to exit the command.
Check your deployments status once again:
The output should now read:
Until Kubernetes is able to deploy a 5th pod on a different node in order to evict the next one, the remaining pods will remain available in order to adhere to the PDB. In this example, the pod disruption budget was configured to indicate min-available but a PDB can also be configured to define a max-unavailable. Either value can be expressed as an integer representing a pod count, or a percentage of total pods.
You learned how you can create a container-native load balancer through ingress in order to take advantage of more efficient load balancing and routing. You ran a simple load test on a GKE application and observed its baseline CPU and memory utilization, as well as how it responds to spikes in traffic. Additionally you configured liveness and readiness probes along with a pod disruption budget to ensure your applications' availability. These tools and techniques in conjunction with each other contribute to an overall efficiency to how your application can run on GKE by minimizing extraneous network traffic, defining meaningful indicators of a well-behaved application and improving application availability.
Check out these resources to learn more about the topics covered in this lab:
...helps you make the most of Google Cloud technologies. Our classes include technical skills and best practices to help you get up to speed quickly and continue your learning journey. We offer fundamental to advanced level training, with on-demand, live, and virtual options to suit your busy schedule. Certifications help you validate and prove your skill and expertise in Google Cloud technologies.
Manual Last Updated: March 12, 2024
Lab Last Tested: March 12, 2024
Copyright 2025 Google LLC All rights reserved. Google and the Google logo are trademarks of Google LLC. All other company and product names may be trademarks of the respective companies with which they are associated.


This content is not currently available
We will notify you via email when it becomes available

Great!
We will contact you via email if it becomes available

One lab at a time
Confirm to end all existing labs and start this one