

Before you begin
- Labs create a Google Cloud project and resources for a fixed time
- Labs have a time limit and no pause feature. If you end the lab, you'll have to restart from the beginning.
- On the top left of your screen, click Start lab to begin
Total Confirmed Cases
/ 10
Worst Affected Areas
/ 10
Identify hotspots
/ 10
Fatality Ratio
/ 10
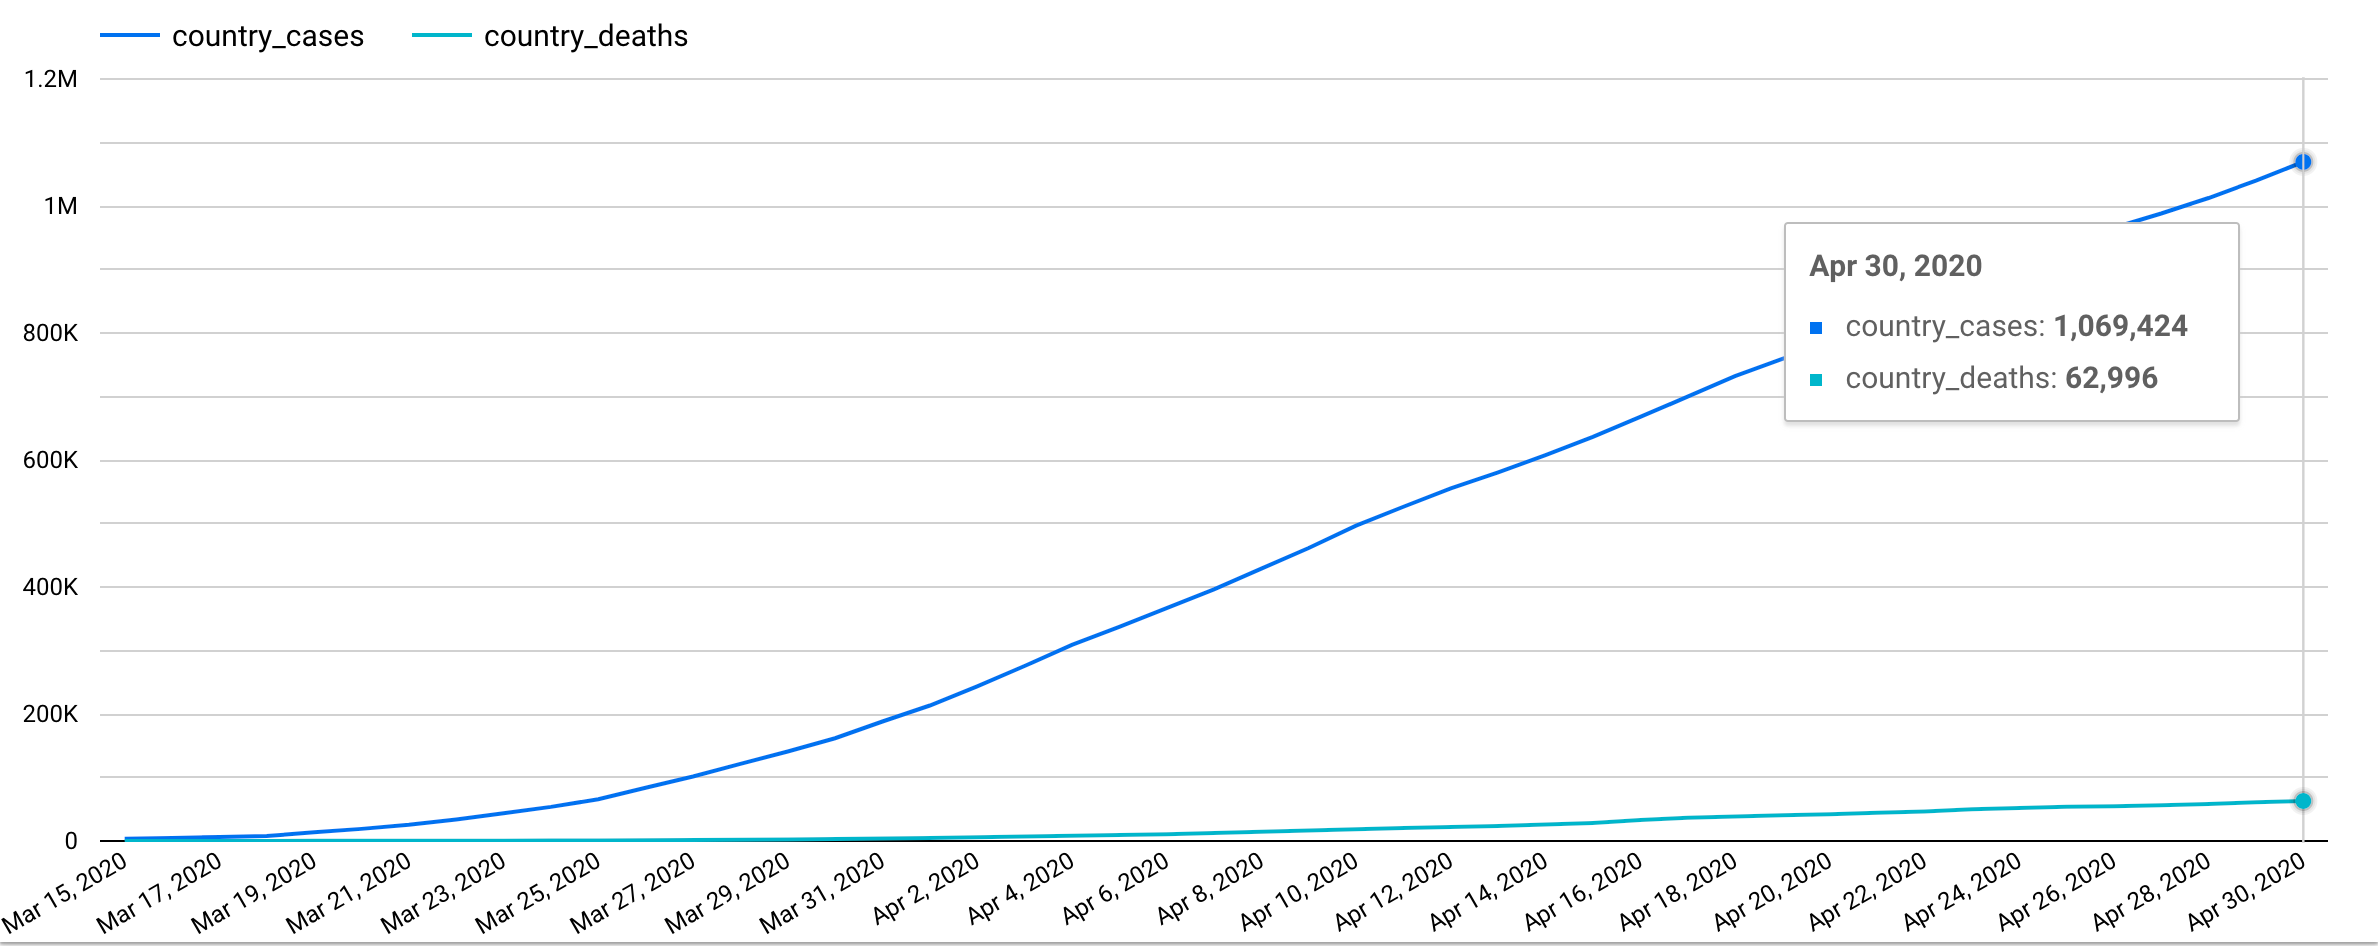
Identify a specific day
/ 10
Find days with zero net new cases
/ 10
Doubling rate
/ 10
Recovery rate
/ 10
CDGR - Cumulative Daily Growth Rate
/ 10
Create a Looker Studio report
/ 10
You must complete a series of tasks within the allocated time period. Instead of following step-by-step instructions, you'll be given a scenario and a set of tasks - you figure out how to complete it on your own! An automated scoring system (shown on this page) will provide feedback on whether you have completed your tasks correctly.
To score 100% you must complete all tasks within the time period!
When you take a Challenge Lab, you will not be taught Google Cloud concepts. To build the solution to the challenge presented, use skills learned from the labs in the course this challenge lab is part of. You will be expected to extend your learned skills; you will be expected to change broken queries.
This lab is recommended for students who have enrolled in the Derive Insights from BigQuery Data skill badge. Are you ready for the challenge?
Read these instructions. Labs are timed and you cannot pause them. The timer, which starts when you click Start Lab, shows how long Google Cloud resources are made available to you.
This hands-on lab lets you do the lab activities in a real cloud environment, not in a simulation or demo environment. It does so by giving you new, temporary credentials you use to sign in and access Google Cloud for the duration of the lab.
To complete this lab, you need:
You're part of a public health organization which is tasked with identifying answers to queries related to the Covid-19 pandemic. Obtaining the right answers will help the organization in planning and focusing healthcare efforts and awareness programs appropriately.
The dataset and table that will be used for this analysis will be : bigquery-public-data.covid19_open_data.covid19_open_data. This repository contains country-level datasets of daily time-series data related to COVID-19 globally. It includes data relating to demographics, economy, epidemiology, geography, health, hospitalizations, mobility, government response, and weather.
Columns to reference:
Click Check my progress to verify the objective.
Columns to reference:
Click Check my progress to verify the objective.
Columns to reference:
Click Check my progress to verify the objective.
Columns to reference:
Click Check my progress to verify the objective.
Columns to reference:
Click Check my progress to verify the objective.
The following query is written to identify the number of days in India between
Click Check my progress to verify the objective.
Using the previous query as a template, write a query to find out the dates on which the confirmed cases increased by more than
Click Check my progress to verify the objective.
Build a query to list the recovery rates of countries arranged in descending order (limit to
Restrict the query to only those countries having more than 50K confirmed cases.
Columns to reference:
Click Check my progress to verify the objective.
The following query is trying to calculate the CDGR on
The CDGR is calculated as:
((last_day_cases/first_day_cases)^1/days_diff)-1)
Where :
last_day_cases is the number of confirmed cases on May 10, 2020
first_day_cases is the number of confirmed cases on Jan 24, 2020
days_diff is the number of days between Jan 24 - May 10, 2020
The query isn’t executing properly. Can you fix the error to make the query execute successfully?
Click Check my progress to verify the objective.
Create a Looker Studio report that plots the following for the United States:
Use the BigQuery connector, authorize access, select Custom Query under your project
Click Check my progress to verify the objective.
This self-paced lab is part of the Derive Insights from BigQuery Data skill badge. Completing this skill badge earns you the badge above, to recognize your achievement. Share your badge on your resume and social platforms, and announce your accomplishment using #GoogleCloudBadge.
This skill badge is part of Google’s Data Analyst learning path. If you have already completed the other skill badges in this learning path, search the Google Cloud Skills Boost catalog for other skill badges in which you can enroll.
...helps you make the most of Google Cloud technologies. Our classes include technical skills and best practices to help you get up to speed quickly and continue your learning journey. We offer fundamental to advanced level training, with on-demand, live, and virtual options to suit your busy schedule. Certifications help you validate and prove your skill and expertise in Google Cloud technologies.
Manual Last Updated October 07, 2025
Lab Last Tested October 07, 2025
Copyright 2025 Google LLC. All rights reserved. Google and the Google logo are trademarks of Google LLC. All other company and product names may be trademarks of the respective companies with which they are associated.


This content is not currently available
We will notify you via email when it becomes available

Great!
We will contact you via email if it becomes available

One lab at a time
Confirm to end all existing labs and start this one