GSP787

Ringkasan
Anda harus menyelesaikan serangkaian tugas dalam jangka waktu yang diberikan. Tidak ada petunjuk langkah demi langkah, tetapi Anda akan diberi suatu skenario dan serangkaian tugas. Anda harus mencari cara untuk menyelesaikannya sendiri. Sistem pemberian skor otomatis (ditampilkan pada halaman ini) akan memberikan masukan tentang apakah Anda telah menyelesaikan tugas dengan benar atau tidak.
Untuk memperoleh skor 100%, Anda harus menyelesaikan semua tugas dalam jangka waktu yang diberikan.
Saat mengikuti Challenge Lab, Anda tidak akan diajari konsep-konsep Google Cloud. Untuk membangun solusi bagi tantangan yang ada, manfaatkan keterampilan yang telah dipelajari dari lab dalam kursus yang menyertakan Challenge Lab ini. Anda diharapkan mampu mengembangkan keterampilan yang telah dipelajari; Anda diharapkan untuk mengubah kueri yang rusak.
Lab ini direkomendasikan bagi siswa yang sudah mengikuti kursus untuk badge keahlian Mendapatkan Insight dari Data BigQuery. Apakah Anda siap menghadapi tantangan ini?
Penyiapan dan persyaratan
Sebelum mengklik tombol Start Lab
Baca petunjuk ini. Lab memiliki timer dan Anda tidak dapat menjedanya. Timer yang dimulai saat Anda mengklik Start Lab akan menampilkan durasi ketersediaan resource Google Cloud untuk Anda.
Lab interaktif ini dapat Anda gunakan untuk melakukan aktivitas lab di lingkungan cloud sungguhan, bukan di lingkungan demo atau simulasi. Untuk mengakses lab ini, Anda akan diberi kredensial baru yang bersifat sementara dan dapat digunakan untuk login serta mengakses Google Cloud selama durasi lab.
Untuk menyelesaikan lab ini, Anda memerlukan:
- Akses ke browser internet standar (disarankan browser Chrome).
Catatan: Gunakan jendela Samaran (direkomendasikan) atau browser pribadi untuk menjalankan lab ini. Hal ini akan mencegah konflik antara akun pribadi Anda dan akun siswa yang dapat menyebabkan tagihan ekstra pada akun pribadi Anda.
- Waktu untuk menyelesaikan lab. Ingat, setelah dimulai, lab tidak dapat dijeda.
Catatan: Hanya gunakan akun siswa untuk lab ini. Jika Anda menggunakan akun Google Cloud yang berbeda, Anda mungkin akan dikenai tagihan ke akun tersebut.
Skenario
Anda adalah bagian dari organisasi kesehatan masyarakat yang bertugas mengidentifikasi jawaban atas pertanyaan terkait pandemi Covid-19. Memperoleh jawaban yang benar akan membantu organisasi Anda merencanakan dan memfokuskan upaya layanan kesehatan serta program peningkatan kesadaran masyarakat dengan tepat.
Set data dan tabel yang akan digunakan untuk analisis ini adalah: bigquery-public-data.covid19_open_data.covid19_open_data. Repositori ini berisi set data tingkat negara dari data deret waktu harian yang terkait dengan COVID-19 secara global. Repositori ini mencakup data seputar demografi, ekonomi, epidemiologi, geografi, kesehatan, hospitalisasi, mobilitas, respons pemerintah, dan cuaca.
Tugas 1. Total kasus terkonfirmasi
- Buat kueri yang akan menjawab "Berapa jumlah total kasus terkonfirmasi pada tanggal ?" Kueri ini harus menampilkan satu baris yang berisi jumlah kasus terkonfirmasi untuk semua negara. Nama kolomnya harus total_cases_worldwide.
Kolom untuk referensi:
- cumulative_confirmed
- date
Klik Periksa progres saya untuk memverifikasi tujuan.
Total Kasus Terkonfirmasi
Tugas 2. Daerah yang terkena dampak paling parah
- Buat kueri untuk menjawab "Berapa banyak negara bagian di AS yang memiliki jumlah kematian lebih dari pada tanggal ?" Kueri ini harus mencantumkan output di kolom count_of_states.
Catatan: Jangan sertakan nilai NULL.
Kolom untuk referensi:
- country_name
- subregion1_name (untuk informasi negara bagian)
- cumulative_deceased
Klik Periksa progres saya untuk memverifikasi tujuan.
Daerah yang Terkena Dampak Paling Parah
Tugas 3. Mengidentifikasi hotspot
- Buat kueri yang akan menjawab "Daftar semua negara bagian di Amerika Serikat yang memiliki lebih dari kasus terkonfirmasi pada tanggal ?" Kueri ini harus menampilkan Nama Negara Bagian dan kasus terkonfirmasi terkait yang disusun dalam urutan menurun. Nama kolom yang akan ditampilkan adalah state dan total_confirmed_cases.
Kolom untuk referensi:
- country_code
- subregion1_name (untuk informasi negara bagian)
- cumulative_confirmed
Klik Periksa progres saya untuk memverifikasi tujuan.
Mengidentifikasi Hotspot
Tugas 4. Rasio kematian
- Buat kueri yang akan menjawab "Berapa rasio kematian kasus di Italia pada bulan 2020?" Rasio kematian kasus di sini ditentukan dengan (total kematian/total kasus terkonfirmasi) * 100.
- Tulis kueri guna menampilkan rasio untuk bulan 2020 dan berisi kolom berikut dalam output: total_confirmed_cases, total_deaths, case_fatality_ratio.
Kolom untuk referensi:
- country_name
- cumulative_confirmed
- cumulative_deceased
Klik Periksa progres saya untuk memverifikasi tujuan.
Rasio Kematian
Tugas 5. Mengidentifikasi hari tertentu
- Buat kueri yang akan menjawab: "Pada hari manakah jumlah total kematian di Italia melebihi ?" Kueri harus menampilkan tanggal dalam format yyyy-mm-dd.
Kolom untuk referensi:
- country_name
- cumulative_deceased
Klik Periksa progres saya untuk memverifikasi tujuan.
Mengidentifikasi Hotspot
Tugas 6. Menemukan hari tanpa kasus baru
Kueri berikut ditulis untuk mengidentifikasi jumlah hari di India antara dan yang tidak mengalami peningkatan jumlah kasus terkonfirmasi. Namun, kueri itu tidak dijalankan dengan benar.
- Anda perlu memperbarui kueri untuk melengkapinya dan mendapatkan hasilnya:
WITH india_cases_by_date AS (
SELECT
date,
SUM(cumulative_confirmed) AS cases
FROM
`bigquery-public-data.covid19_open_data.covid19_open_data`
WHERE
country_name="India"
AND date between '{{{project_0.startup_script.start_date_india_code}}}' and '{{{project_0.startup_script.close_date_india_code}}}'
GROUP BY
date
ORDER BY
date ASC
)
, india_previous_day_comparison AS
(SELECT
date,
cases,
LAG(cases) OVER(ORDER BY date) AS previous_day,
cases - LAG(cases) OVER(ORDER BY date) AS net_new_cases
FROM india_cases_by_date
)
Klik Periksa progres saya untuk memverifikasi tujuan.
Menemukan hari tanpa kasus baru
Tugas 7. Tingkat penggandaan
-
Menggunakan kueri sebelumnya sebagai template, tulis kueri untuk mengetahui tanggal dengan kasus terkonfirmasi meningkat lebih dari % dibandingkan hari sebelumnya (yang menandakan kenaikan dua kali lipat selama sekitar 7 hari) di AS antara tanggal 22 Maret 2020 dan 20 April 2020. Kueri ini harus menampilkan daftar tanggal, kasus terkonfirmasi pada hari itu, kasus terkonfirmasi pada hari sebelumnya, dan persentase peningkatan kasus di antara hari-hari tersebut.
- Gunakan nama berikut untuk kolom yang ditampilkan: Date, Confirmed_Cases_On_Day, Confirmed_Cases_Previous_Day, dan Percentage_Increase_In_Cases.
Klik Periksa progres saya untuk memverifikasi tujuan.
Tingkat penggandaan
Tugas 8. Tingkat pemulihan
-
Buat kueri untuk mencantumkan tingkat pemulihan negara-negara yang disusun dalam urutan menurun (batasi hingga ) pada tanggal 10 Mei 2020.
-
Batasi kueri hanya pada negara-negara yang memiliki lebih dari 50 ribu kasus terkonfirmasi.
- Kueri ini harus menampilkan kolom berikut: country, recovered_cases, confirmed_cases, recovery_rate.
Kolom untuk referensi:
- country_name
- cumulative_confirmed
- cumulative_recovered
Klik Periksa progres saya untuk memverifikasi tujuan.
Tingkat pemulihan
Tugas 9. CDGR - Tingkat pertumbuhan harian kumulatif
((last_day_cases/first_day_cases)^1/days_diff)-1)
Dengan:
-
last_day_cases adalah jumlah kasus terkonfirmasi pada 10 Mei 2020
-
first_day_cases adalah jumlah kasus terkonfirmasi pada 24 Januari 2020
-
days_diff adalah jumlah hari antara 24 Januari - 10 Mei 2020
-
Kueri belum dapat dijalankan dengan benar. Bisakah Anda memperbaiki error agar kueri berhasil dijalankan?
WITH
france_cases AS (
SELECT
date,
SUM(cumulative_confirmed) AS total_cases
FROM
`bigquery-public-data.covid19_open_data.covid19_open_data`
WHERE
country_name="France"
AND date IN ('2020-01-24',
'{{{project_0.startup_script.date_code}}}')
GROUP BY
date
ORDER BY
date)
, summary as (
SELECT
total_cases AS first_day_cases,
LEAD(total_cases) AS last_day_cases,
DATE_DIFF(LEAD(date) OVER(ORDER BY date),date, day) AS days_diff
FROM
france_cases
LIMIT 1
)
select first_day_cases, last_day_cases, days_diff, SQRT((last_day_cases/first_day_cases),(1/days_diff))-1 as cdgr
from summary
Catatan: Lihat Dokumentasi fungsi, operator, dan kondisional berikut untuk mempelajari lebih lanjut fungsi SQL yang direferensikan `LEAD()`.
Klik Periksa progres saya untuk memverifikasi tujuan.
CDGR - Tingkat Pertumbuhan Harian Kumulatif
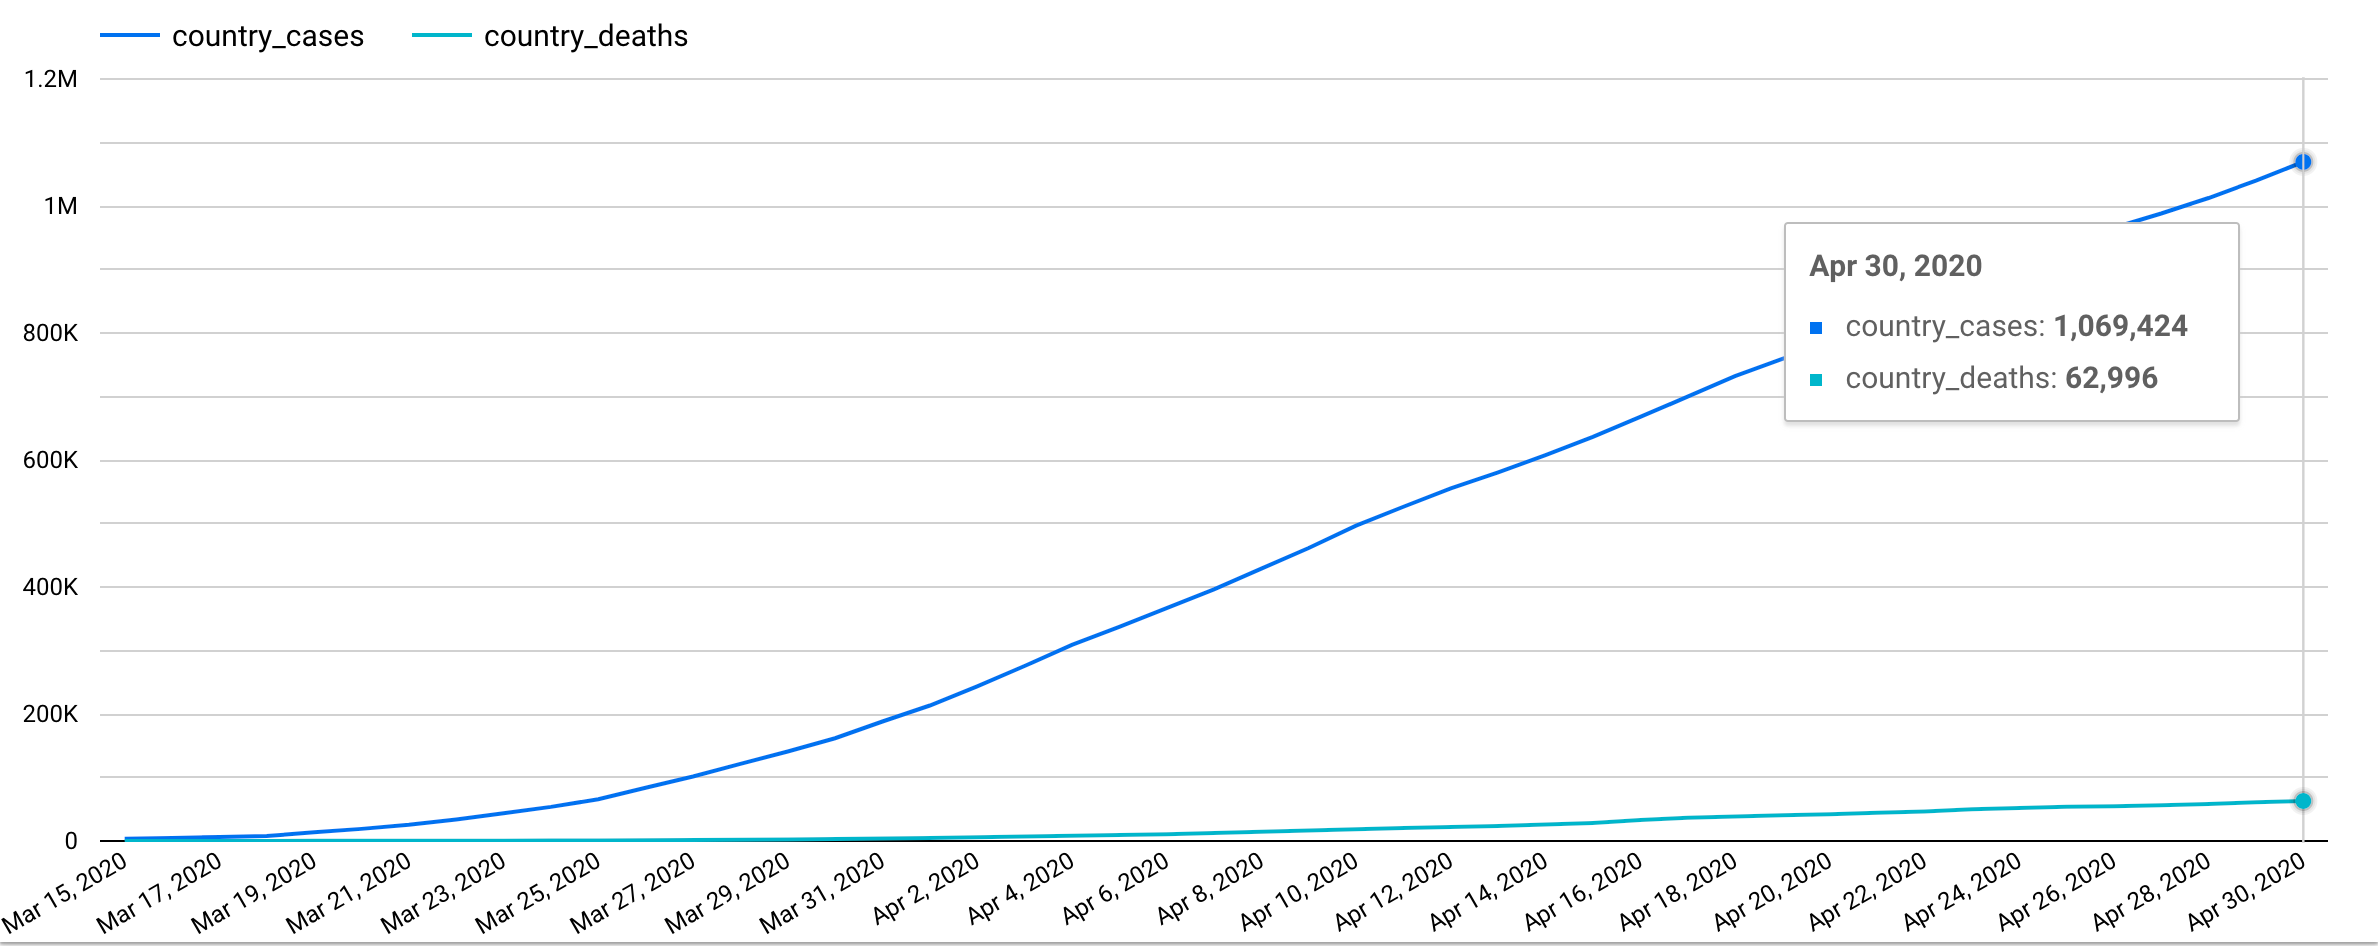
Tugas 10. Membuat laporan Looker Studio
-
Buat laporan Looker Studio yang menyusun hal berikut untuk Amerika Serikat:
-
Gunakan konektor BigQuery, otorisasi akses, pilih Custom Query di project Anda , masukkan kueri, lalu klik Add dan Add to report.
- Jumlah Kasus Terkonfirmasi
- Jumlah Kematian
- Rentang tanggal:
Klik Periksa progres saya untuk memverifikasi tujuan.
Membuat laporan Looker Studio
Catatan: Gunakan gambar di bawah ini sebagai referensi saat membuat laporan dan pastikan bahwa laporan Anda mirip dengannya.
Catatan: Jangan gunakan opsi Explore with Looker Studio dari BigQuery.
Selamat!

Mendapatkan badge keahlian Anda berikutnya
Lab mandiri ini adalah bagian dari badge keahlian Mendapatkan Insight dari Data BigQuery. Dengan menyelesaikan badge keahlian ini, Anda akan mendapatkan badge di atas sebagai pengakuan atas pencapaian Anda. Tampilkan badge di resume atau platform media sosial Anda, dan umumkan pencapaian Anda menggunakan hashtag #GoogleCloudBadge.
Badge keahlian ini adalah bagian dari alur pembelajaran Analis Data Google. Jika Anda sudah menyelesaikan badge keahlian lain di alur pembelajaran ini, telusuri katalog Google Cloud Skills Boost untuk menemukan badge keahlian lainnya yang dapat Anda ikuti.
Sertifikasi dan pelatihan Google Cloud
...membantu Anda mengoptimalkan teknologi Google Cloud. Kelas kami mencakup keterampilan teknis dan praktik terbaik untuk membantu Anda memahami dengan cepat dan melanjutkan proses pembelajaran. Kami menawarkan pelatihan tingkat dasar hingga lanjutan dengan opsi on demand, live, dan virtual untuk menyesuaikan dengan jadwal Anda yang sibuk. Sertifikasi membantu Anda memvalidasi dan membuktikan keterampilan serta keahlian Anda dalam teknologi Google Cloud.
Manual Terakhir Diperbarui pada 4 September 2025
Lab Terakhir Diuji pada 4 September 2025
Hak cipta 2025 Google LLC. Semua hak dilindungi undang-undang. Google dan logo Google adalah merek dagang dari Google LLC. Semua nama perusahaan dan produk lain mungkin adalah merek dagang masing-masing perusahaan yang bersangkutan.


