


Before you begin
- Labs create a Google Cloud project and resources for a fixed time
- Labs have a time limit and no pause feature. If you end the lab, you'll have to restart from the beginning.
- On the top left of your screen, click Start lab to begin
Deploy an application
/ 30
Create a logs-based metric
/ 30
Create an alerting policy
/ 40
Cloud Logging, and its companion tool, Cloud Monitoring, are full featured products that are both deeply integrated into Google Kubernetes Engine (GKE). This lab teaches you how Cloud Logging works with GKE clusters and applications as well as some best practices for log collection through common logging use cases.
In this lab, you learn how to perform the following tasks:
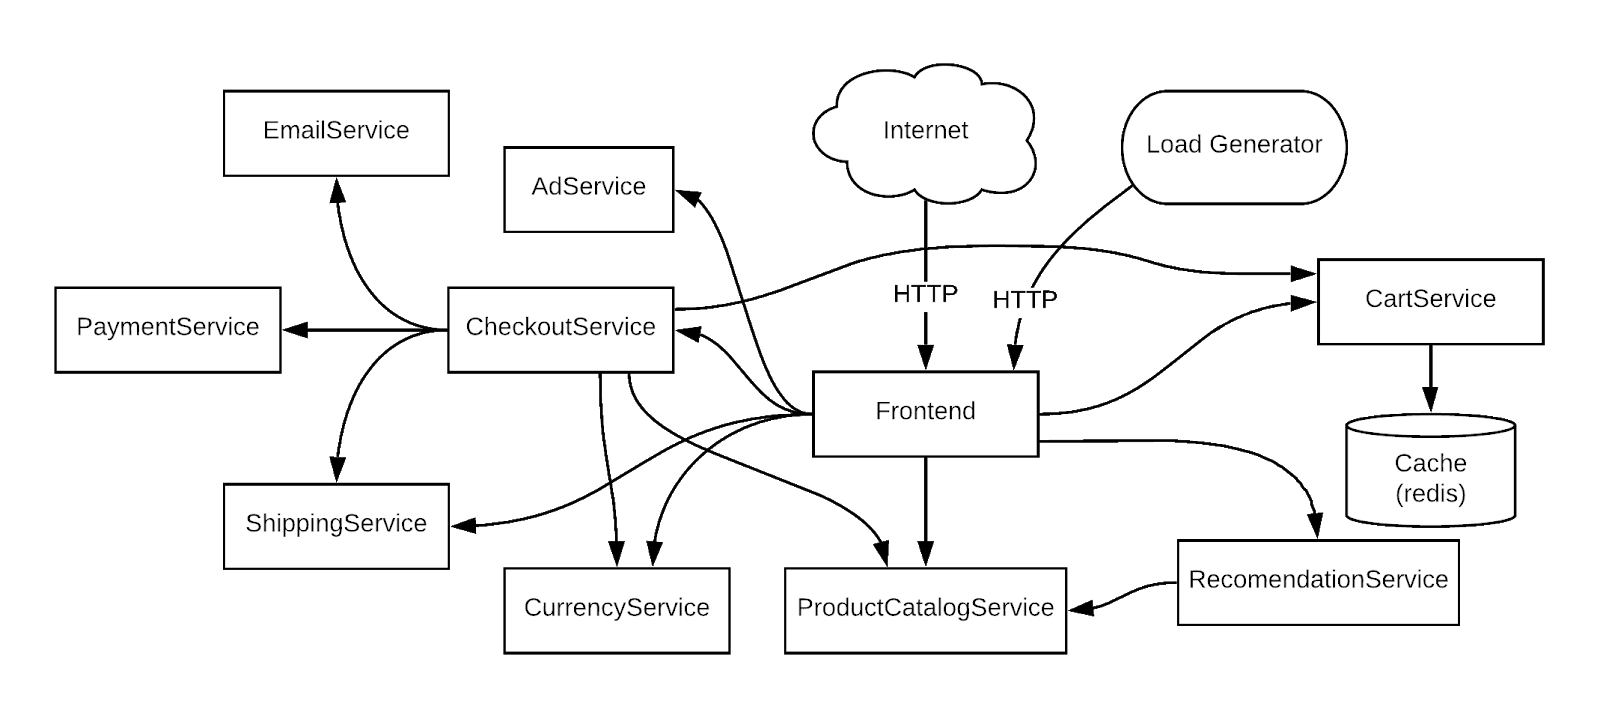
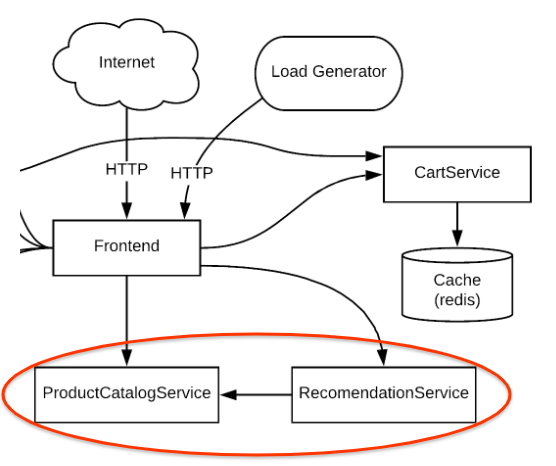
To use a concrete example, you will troubleshoot a sample microservices demo app deployed to a GKE cluster. In this demo app, there are many microservices and dependencies among them. You will generate traffic using a loadgenerator and then use Logging, Monitoring, and GKE to notice the error (alert/metrics), identify a root cause with Logging, and then fix/confirm the issue is fixed with Logging and Monitoring.
Read these instructions. Labs are timed and you cannot pause them. The timer, which starts when you click Start Lab, shows how long Google Cloud resources are made available to you.
This hands-on lab lets you do the lab activities in a real cloud environment, not in a simulation or demo environment. It does so by giving you new, temporary credentials you use to sign in and access Google Cloud for the duration of the lab.
To complete this lab, you need:
Click the Start Lab button. If you need to pay for the lab, a dialog opens for you to select your payment method. On the left is the Lab Details pane with the following:
Click Open Google Cloud console (or right-click and select Open Link in Incognito Window if you are running the Chrome browser).
The lab spins up resources, and then opens another tab that shows the Sign in page.
Tip: Arrange the tabs in separate windows, side-by-side.
If necessary, copy the Username below and paste it into the Sign in dialog.
You can also find the Username in the Lab Details pane.
Click Next.
Copy the Password below and paste it into the Welcome dialog.
You can also find the Password in the Lab Details pane.
Click Next.
Click through the subsequent pages:
After a few moments, the Google Cloud console opens in this tab.

Cloud Shell is a virtual machine that is loaded with development tools. It offers a persistent 5GB home directory and runs on the Google Cloud. Cloud Shell provides command-line access to your Google Cloud resources.
Click Activate Cloud Shell 
Click through the following windows:
When you are connected, you are already authenticated, and the project is set to your Project_ID,
gcloud is the command-line tool for Google Cloud. It comes pre-installed on Cloud Shell and supports tab-completion.
Output:
Output:
gcloud, in Google Cloud, refer to the gcloud CLI overview guide.
Connect to a Google Kubernetes Engine cluster and validate that it's been created correctly.
The cluster status will say PROVISIONING.
Wait a moment and run the above command again until the status is RUNNING. This could take several minutes.
Verify that the cluster named central has been created.
You can also monitor the progress in the Cloud console by navigating to Navigation menu > Kubernetes Engine > Clusters.
Output:
Your output should resemble the following.
Output:
You can use Gemini Code Assist in an integrated development environment (IDE) such as Cloud Shell to receive guidance on code or solve problems with your code. Before you can start using Gemini Code Assist, however, you need to enable it.
In the Cloud Shell Editor, navigate to Cloud Code > Help and Feedback > Change Settings.
In the Settings, search for Gemini Code Assist.
Locate and ensure that the checkbox is selected for Geminicodeassist: Enable, and close the Settings.
Click Cloud Code - No Project in the status bar at the bottom of the screen.
Authorize the plugin as instructed. If a project is not automatically selected, click Select a Google Cloud Project, and choose
Verify that your Google Cloud project (
Next, deploy a microservices application called Hipster Shop to your cluster to create a workload you can monitor.
microservices-demo directory with the following command:You can use the AI-powered features of Gemini Code Assist to make changes to your code directly in your code editor. In this instance, you decide to let Gemini Code Assist help explain the kubernetes-manifests.yaml file to support the onboarding of a new member in your team.
Open the kubernetes-manifests.yaml file. This action enables Gemini Code Assist, as indicated by the presence of the 
Click the Gemini Code Assist: Smart Actions
Gemini Code Assist opens a chat pane with the prefilled prompt of Explain this. In the inline text box of the Code Assist chat, replace the prefilled prompt with the following, and click Send:
The explanation for the code in the kubernetes-manifests.yaml file appears in the Gemini Code Assist chat.
kubectl:The output should look similar to the output below.
Output:
Click Check my progress to verify the objective.
Your confirmation should resemble the following output.
Output:
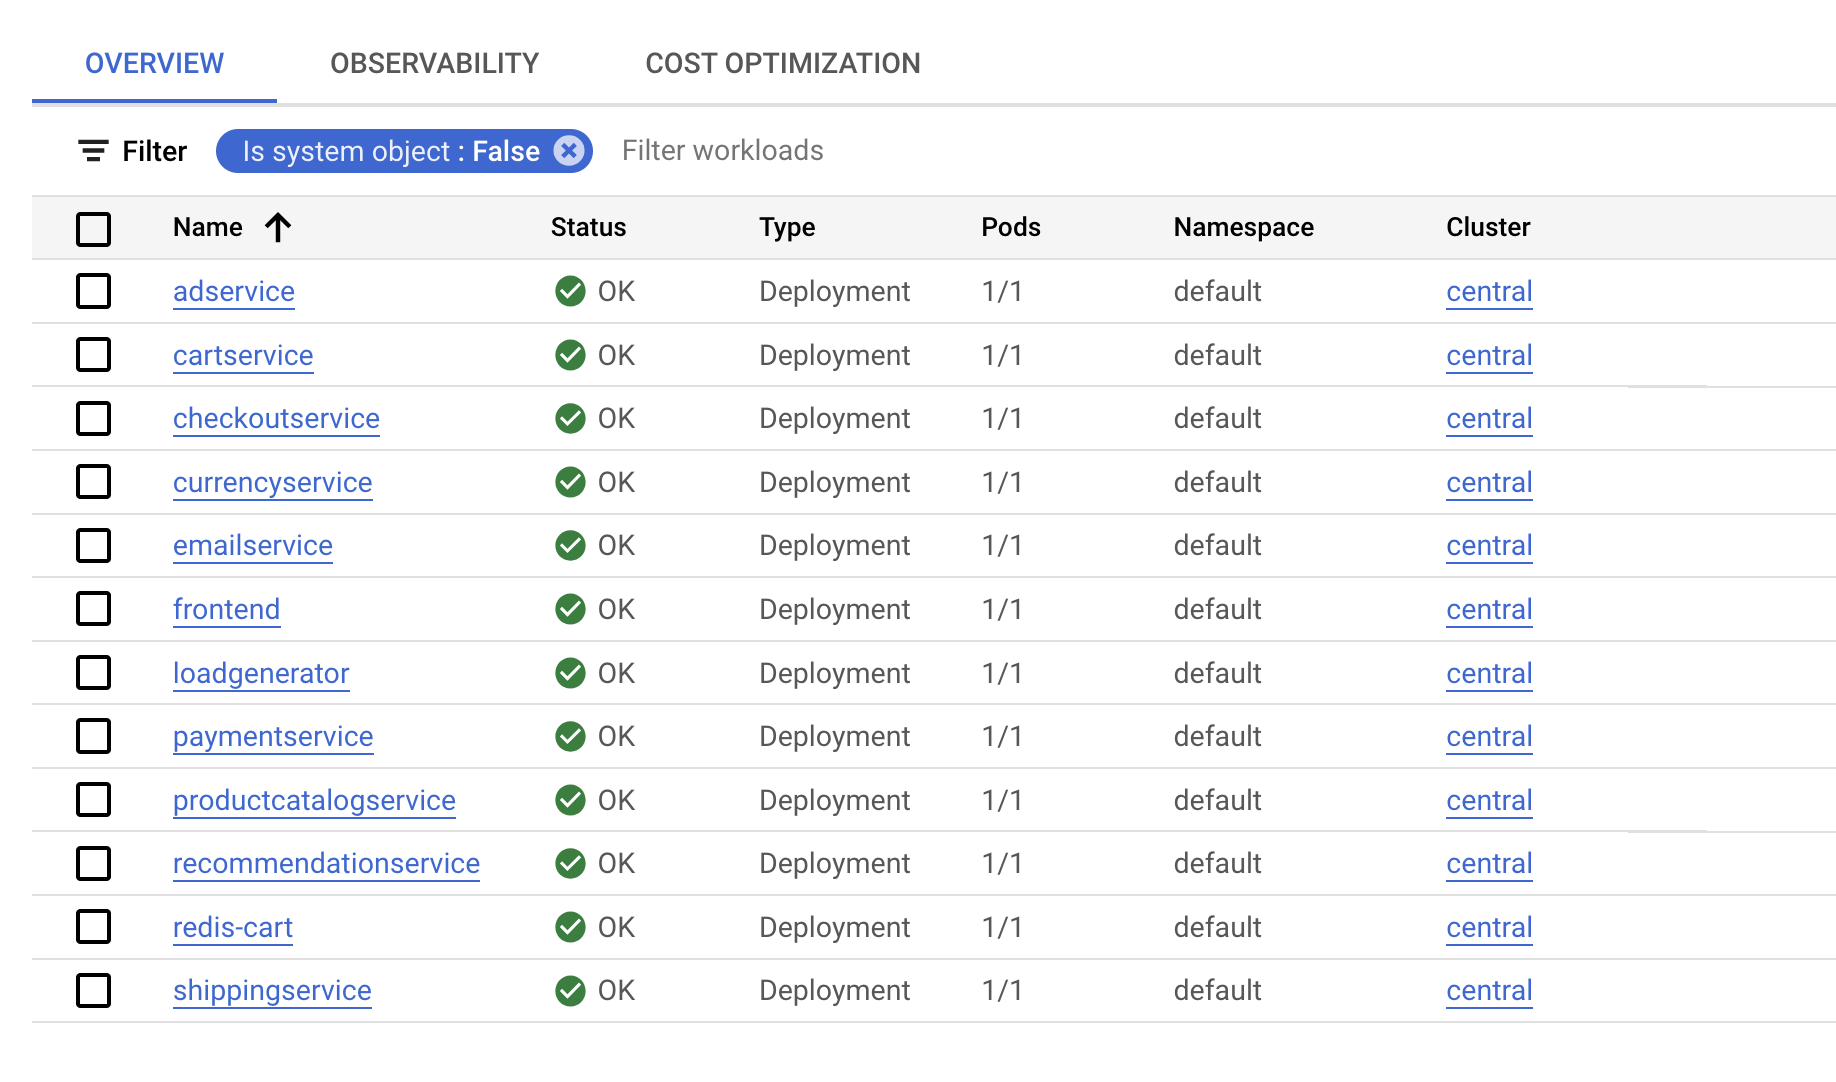
After the application is deployed, you can also go to the Cloud console and view the status.
In the Kubernetes Engine > Workloads page, you'll see that all of the pods are OK.
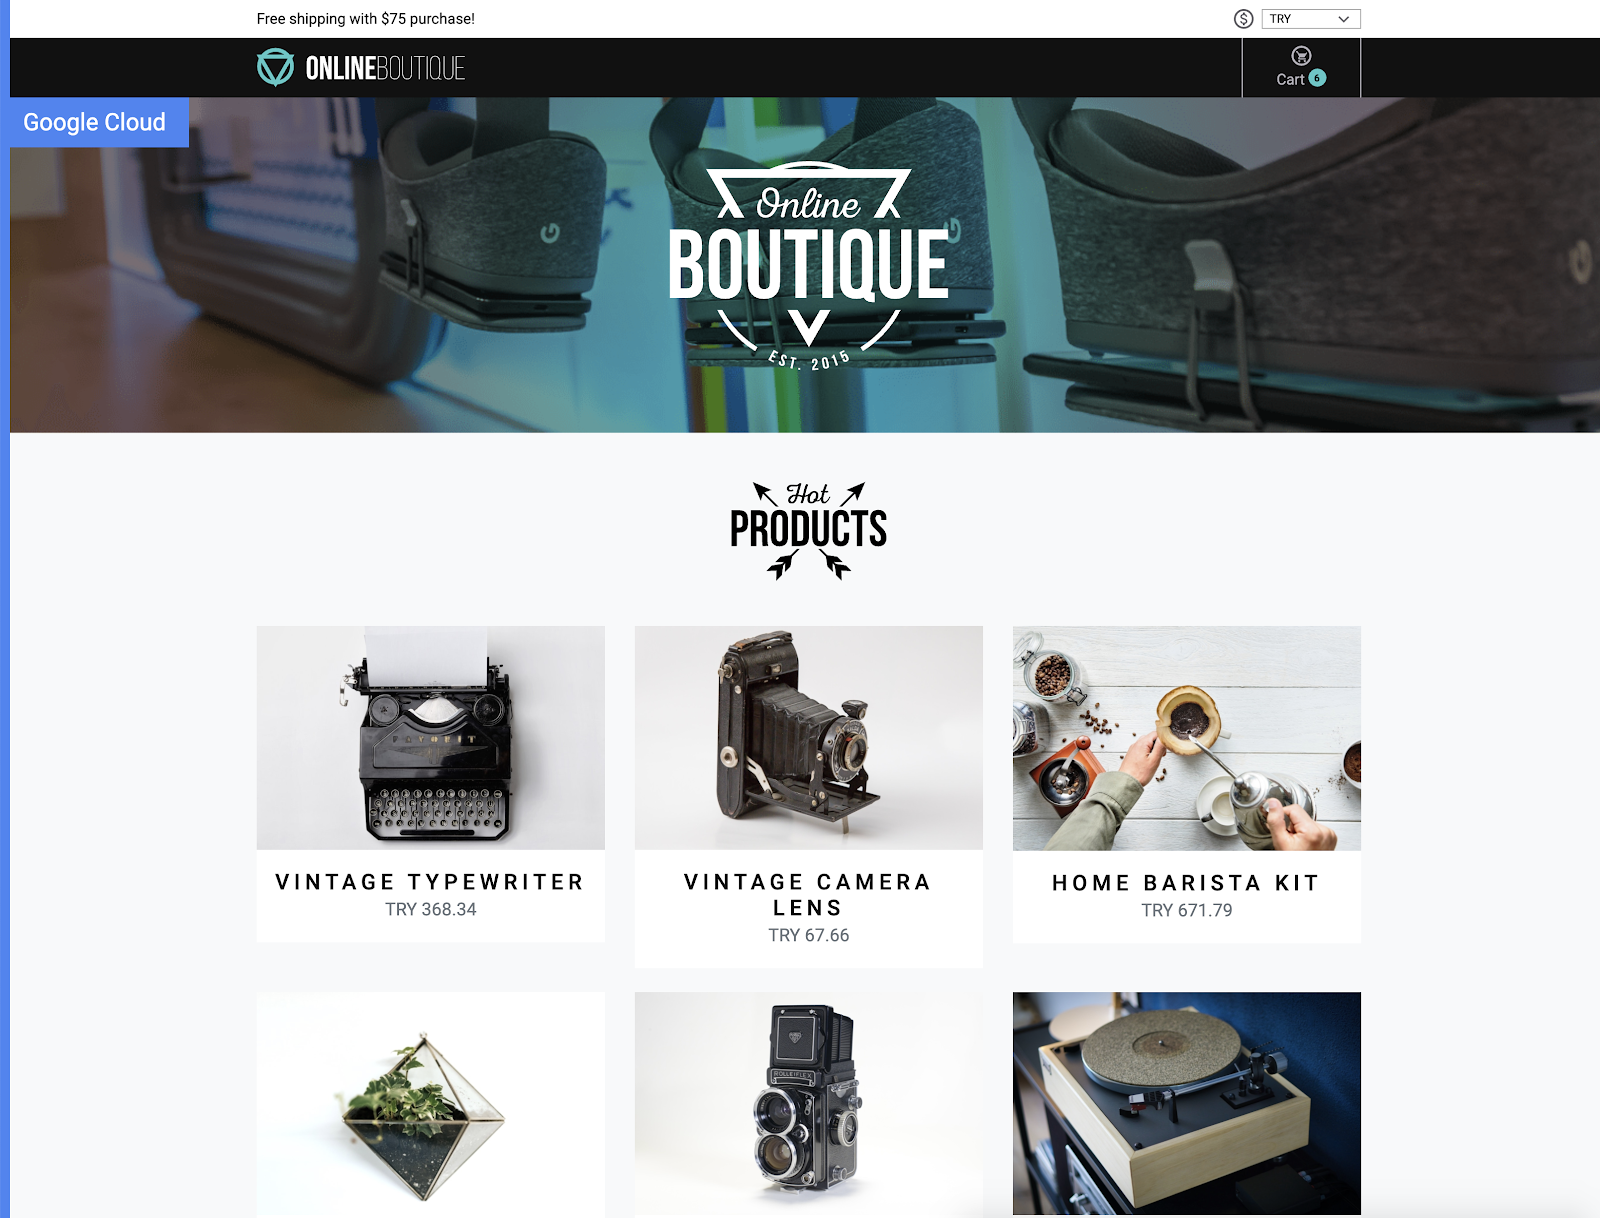
It should open the application to display a page like the following:
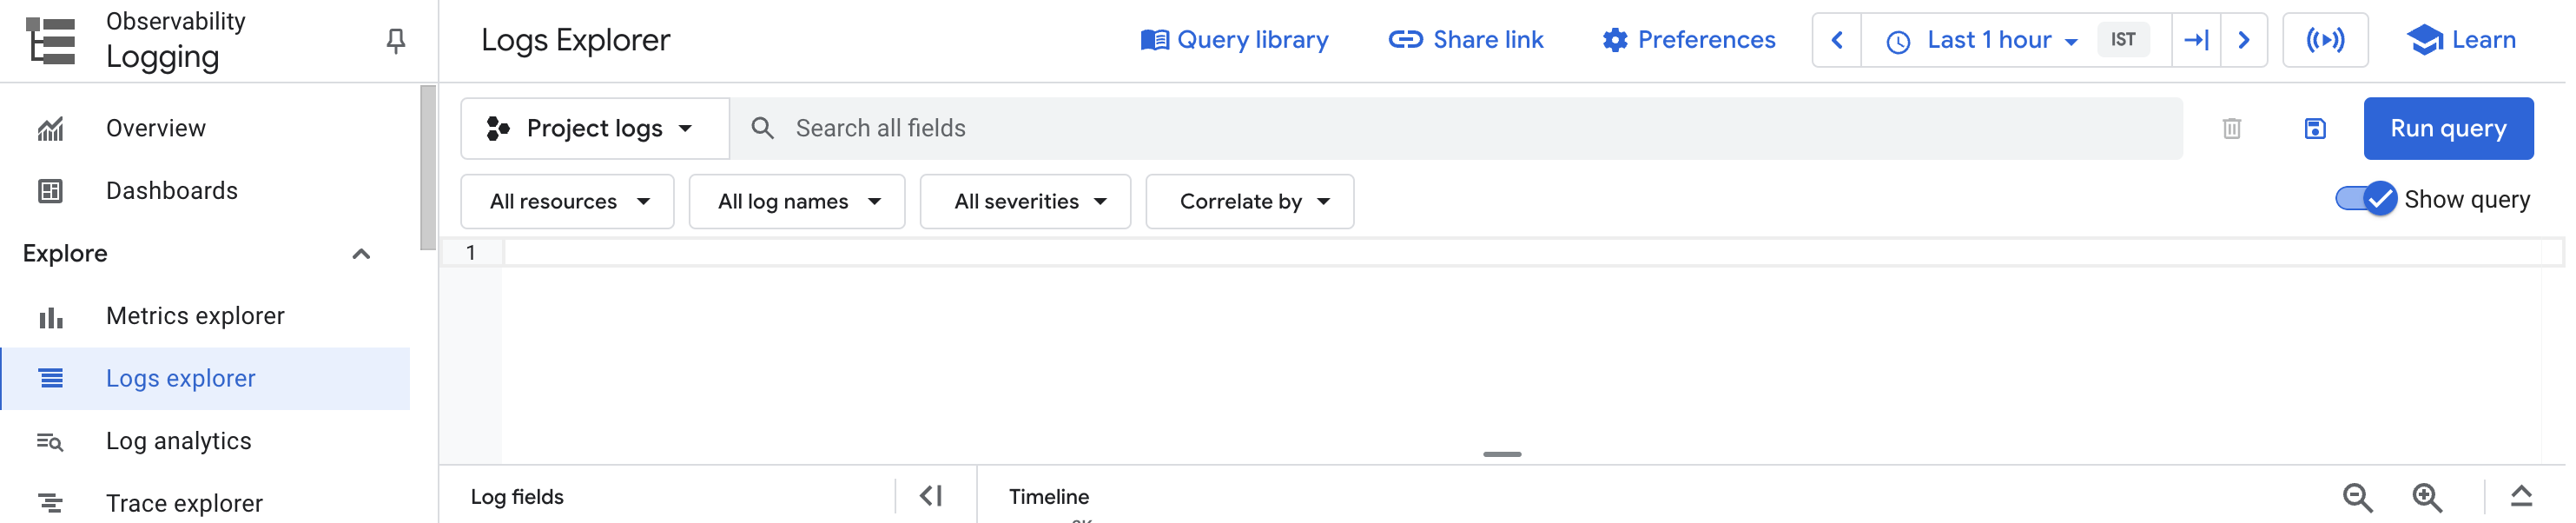
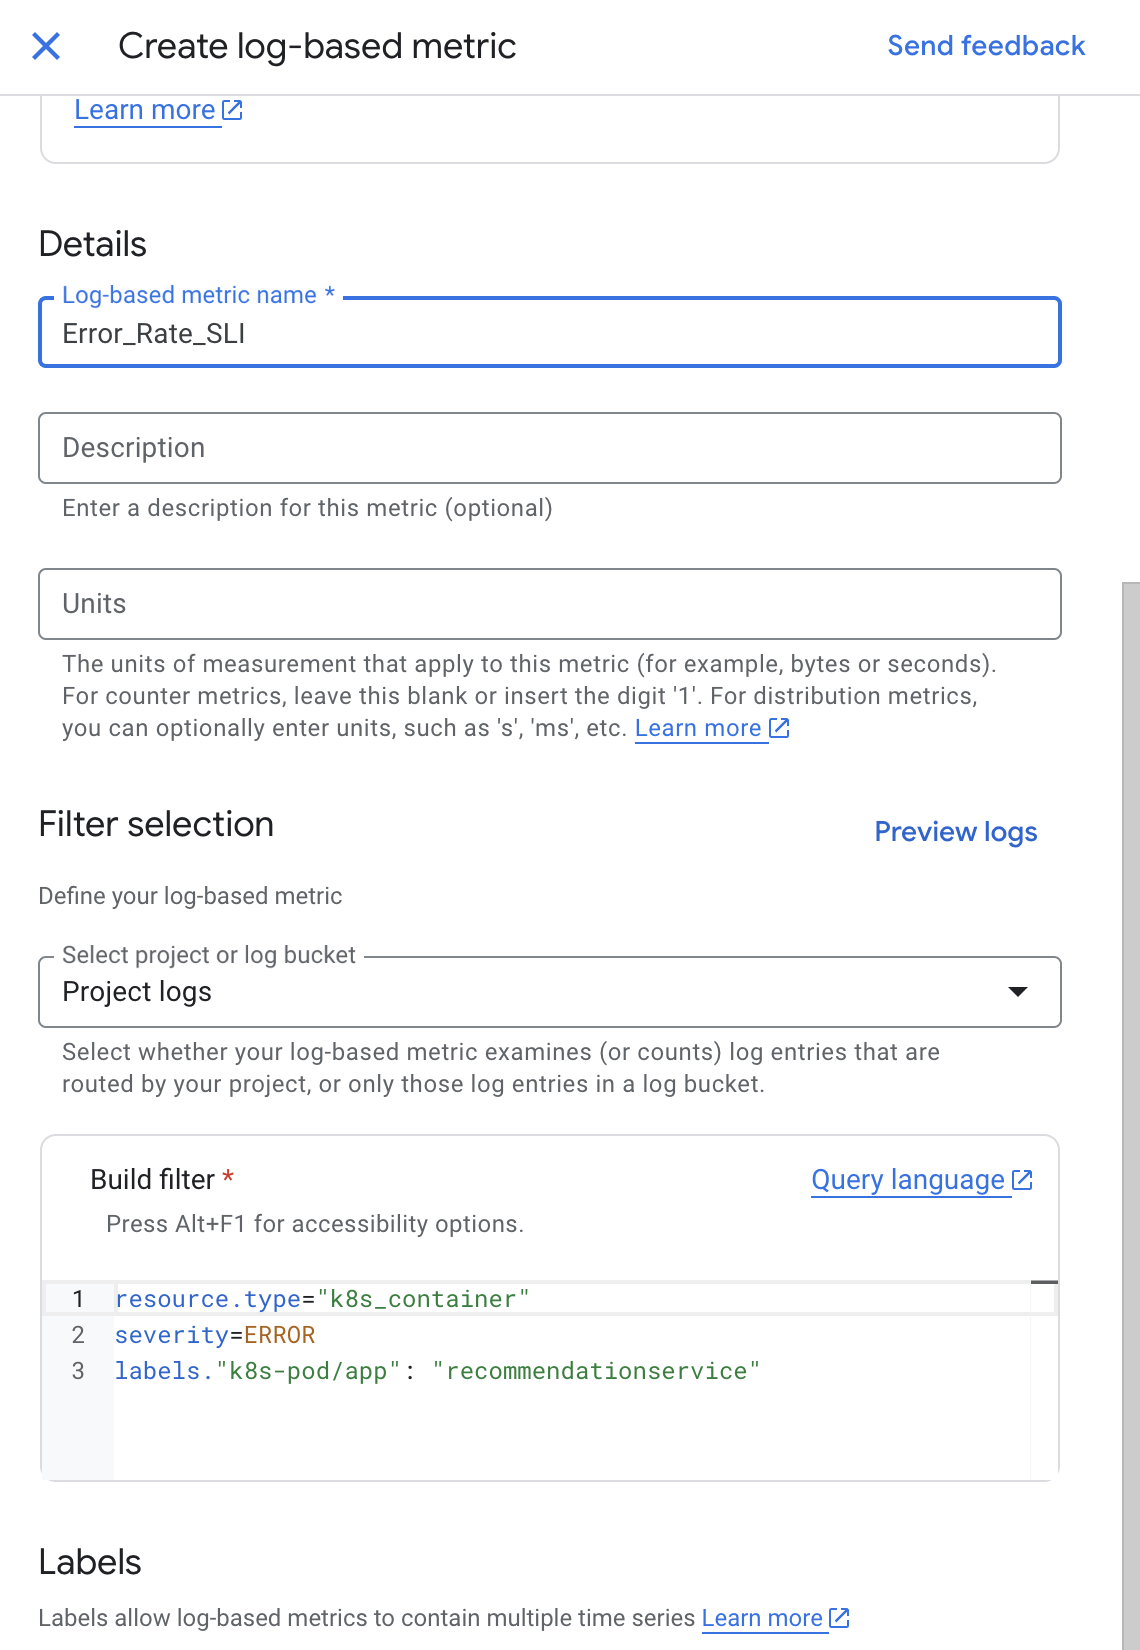
In this task, you configure Cloud Logging to create a logs-based metric, which is a custom metric in Cloud Monitoring made from log entries. Logs-based metrics are good for counting the number of log entries and tracking the distribution of a value in your logs.
In this case, you use the logs-based metric to count the number of errors in your frontend service. You can then use the metric in both dashboards and alerting.
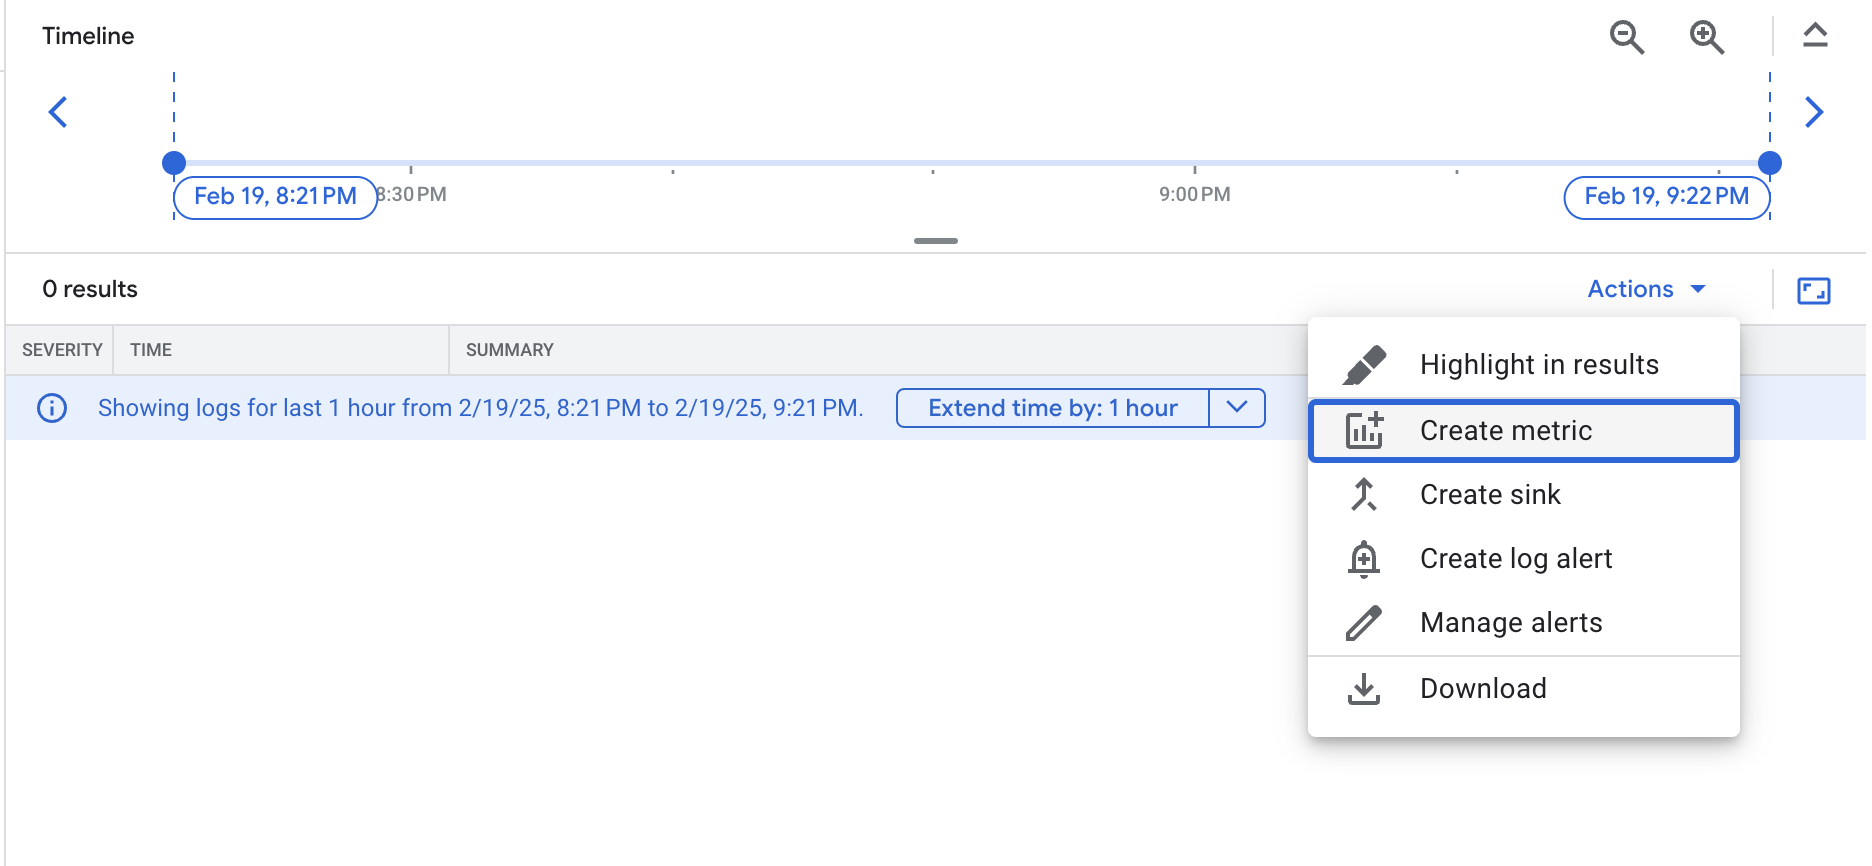
The query you are using lets you find all errors from the frontend pod. However, you shouldn't see any results now since there are no errors yet.
The metric is now listed under User-defined Metrics on the Logs-based Metrics page.
Click Check my progress to verify the objective.
Alerting gives timely awareness to problems in your cloud applications so you can resolve the problems quickly.
In this task, you use Cloud Monitoring to monitor your frontend service availability by creating an alerting policy based on the frontend errors logs-based metric that you created previously. When the condition of the alerting policy is met, Cloud Monitoring creates and displays an incident in the Cloud console.
In the Navigation menu, open Monitoring, then click Alerting.
After the workspace is created, click Create Policy at the top.
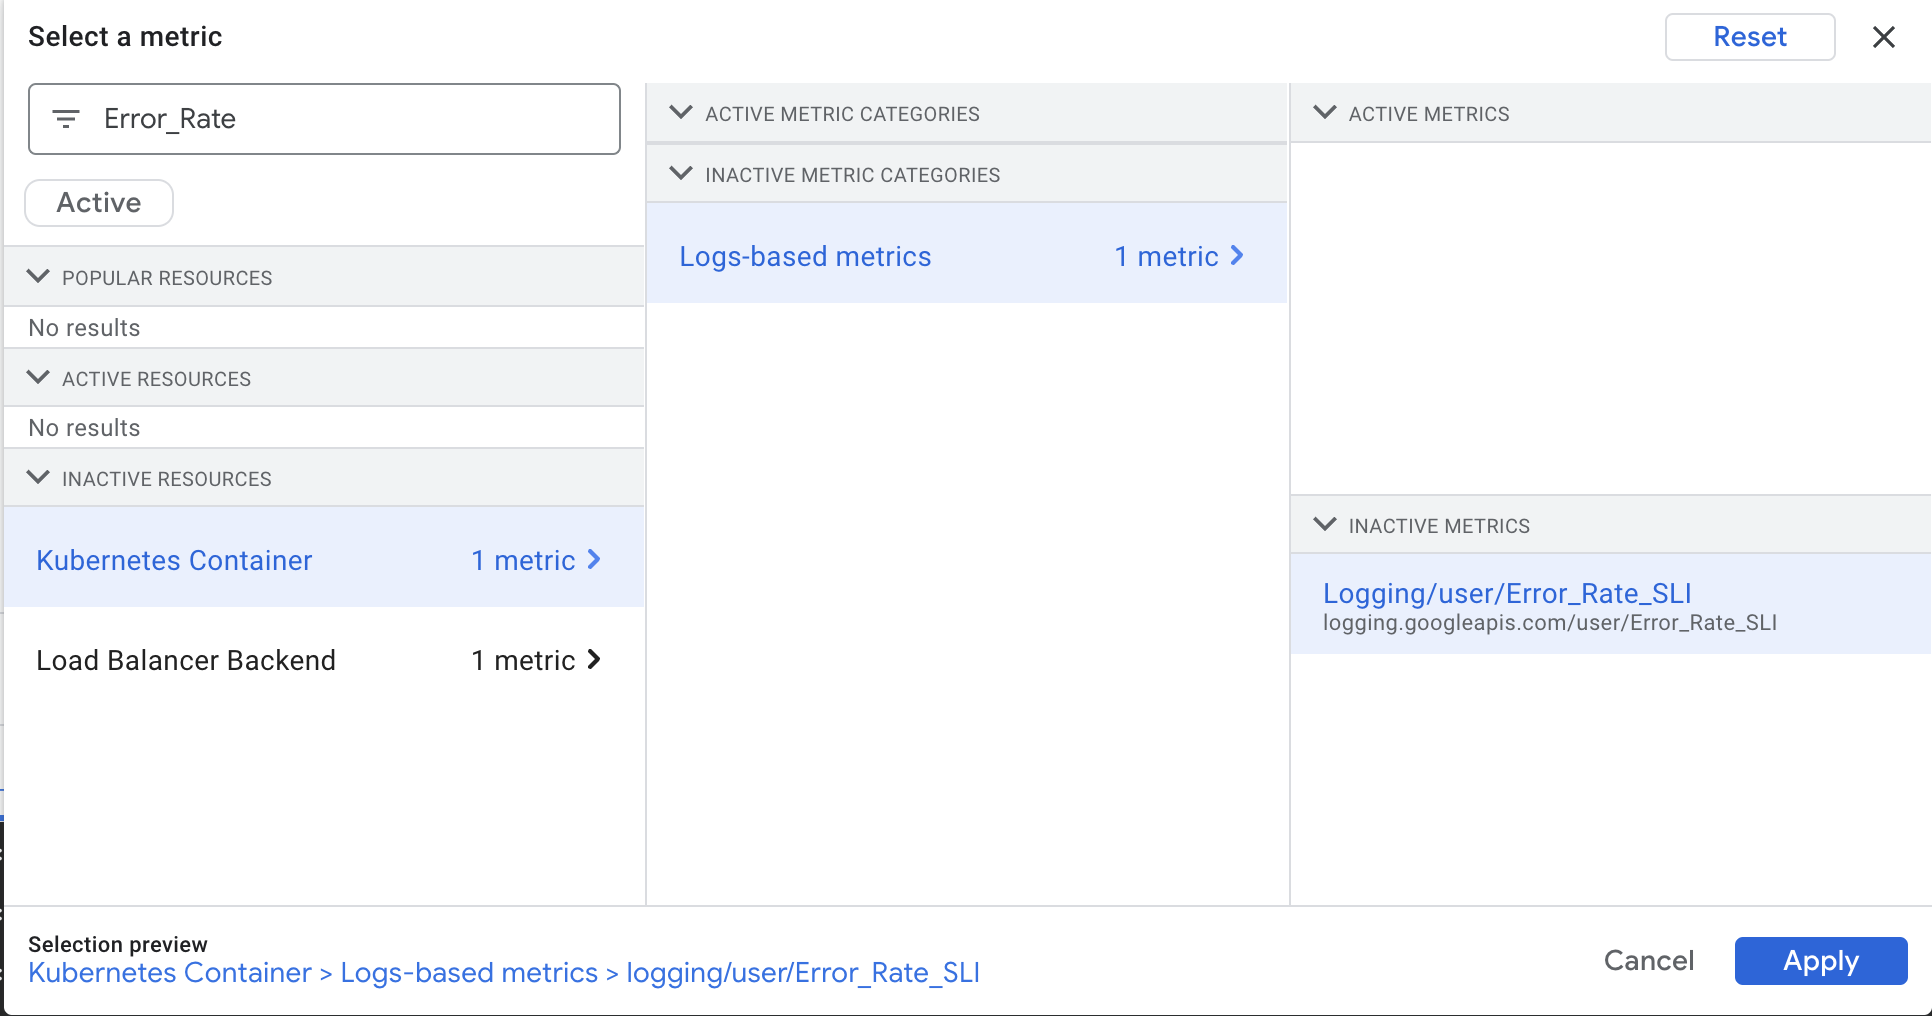
Click on the Select a metric dropdown. Deselect the Active checkbox.
In the filter by resource and metric name field, type Error_Rate.
Click on Kubernetes Container > Logs-Based Metric. Select logging/user/Error_Rate_SLI and click Apply.
Your screen should look like this:
Set Rolling windows function to Rate.
Click Next.
Set 0.5 as your Threshold value.
As expected, there are no failures, and your application is meeting its availability Service Level Objective (SLO).
Click Next again.
Disable Use notification channel.
Provide an alert name such as Error Rate SLI then click Next.
Review the alert and click Create Policy.
Click Check my progress to verify the objective.
In this section, you use a load generator to create some traffic for your web application. Since there is a bug that has been intentionally introduced into this version of the application, a certain amount of traffic volume triggers errors. You work through the steps to identify and fix the bug.
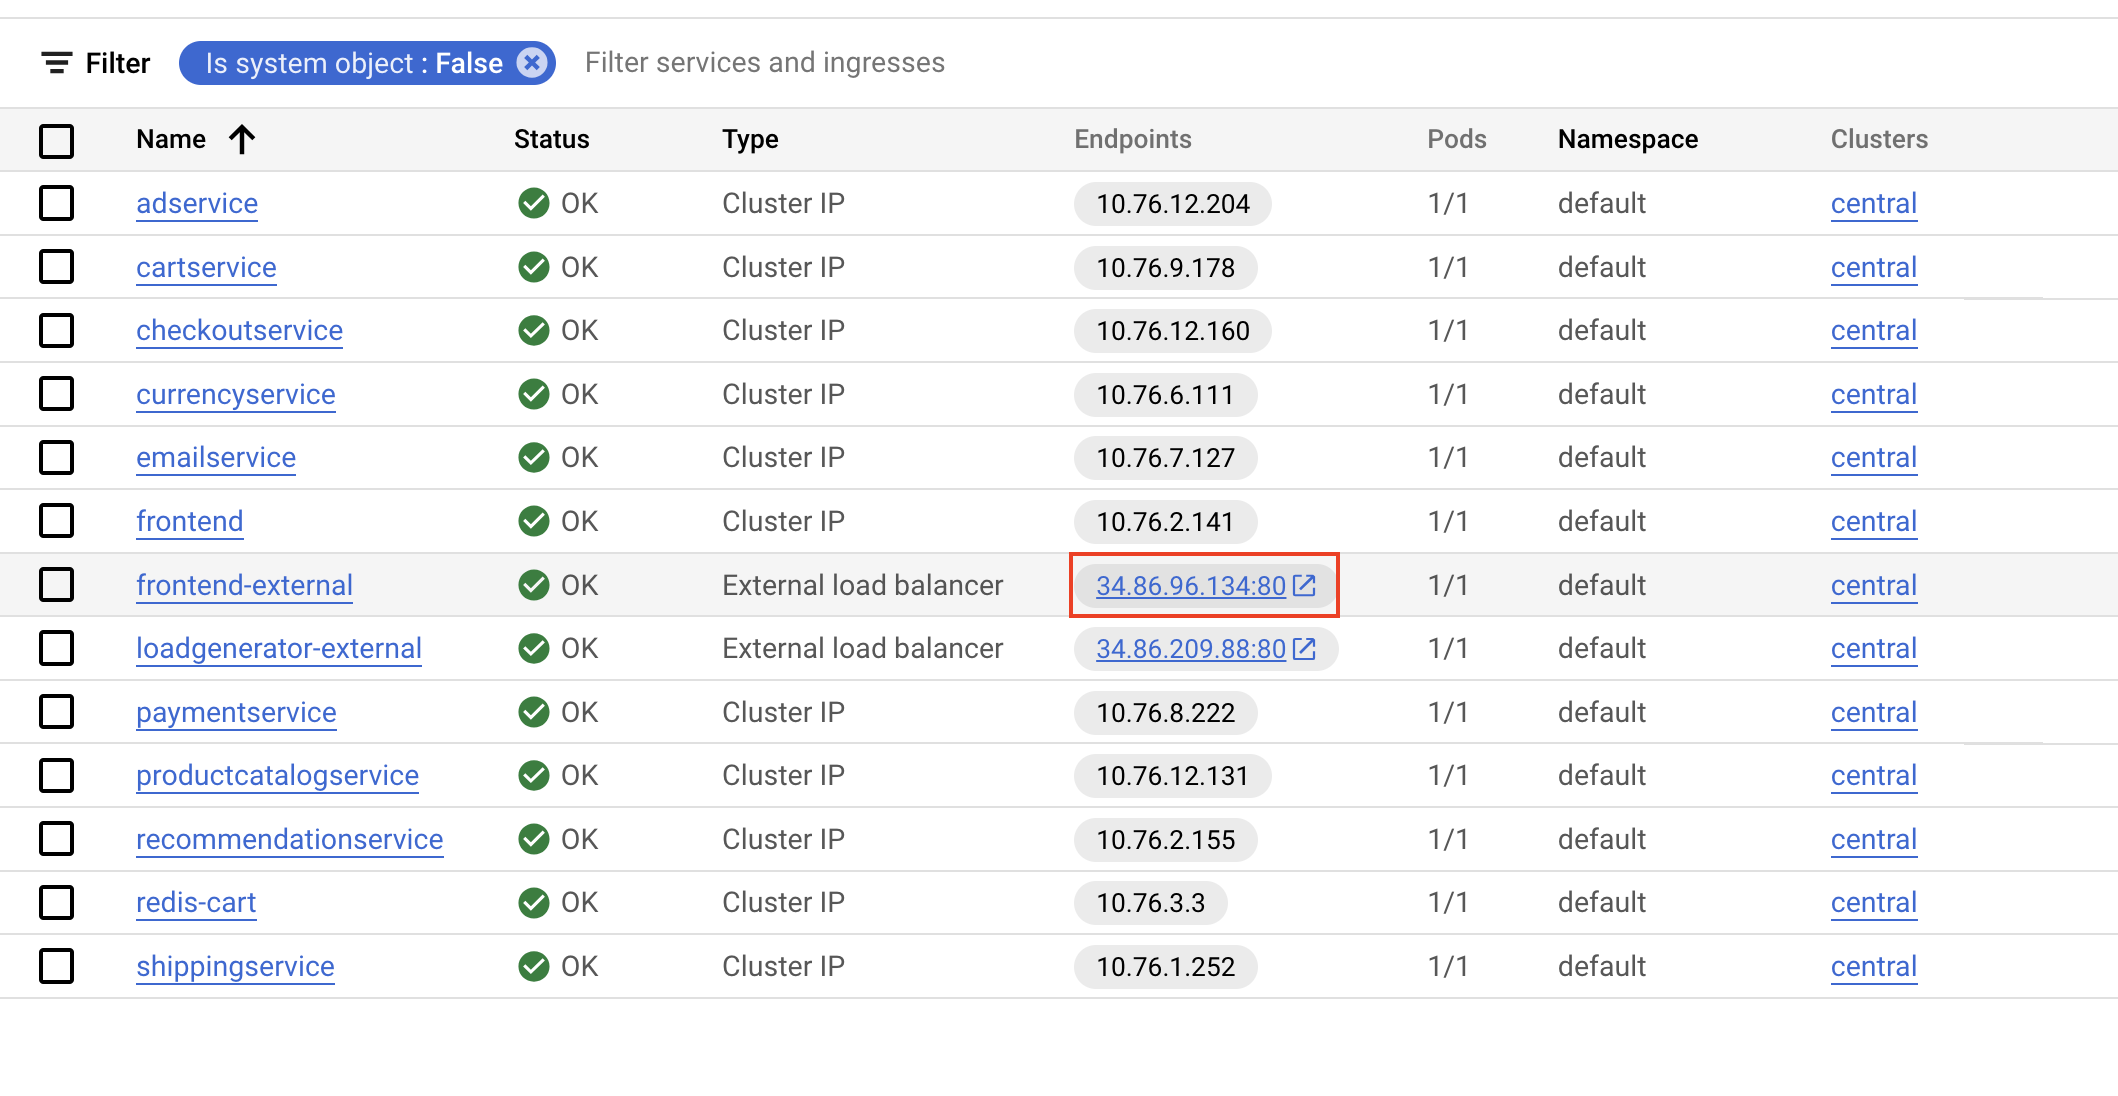
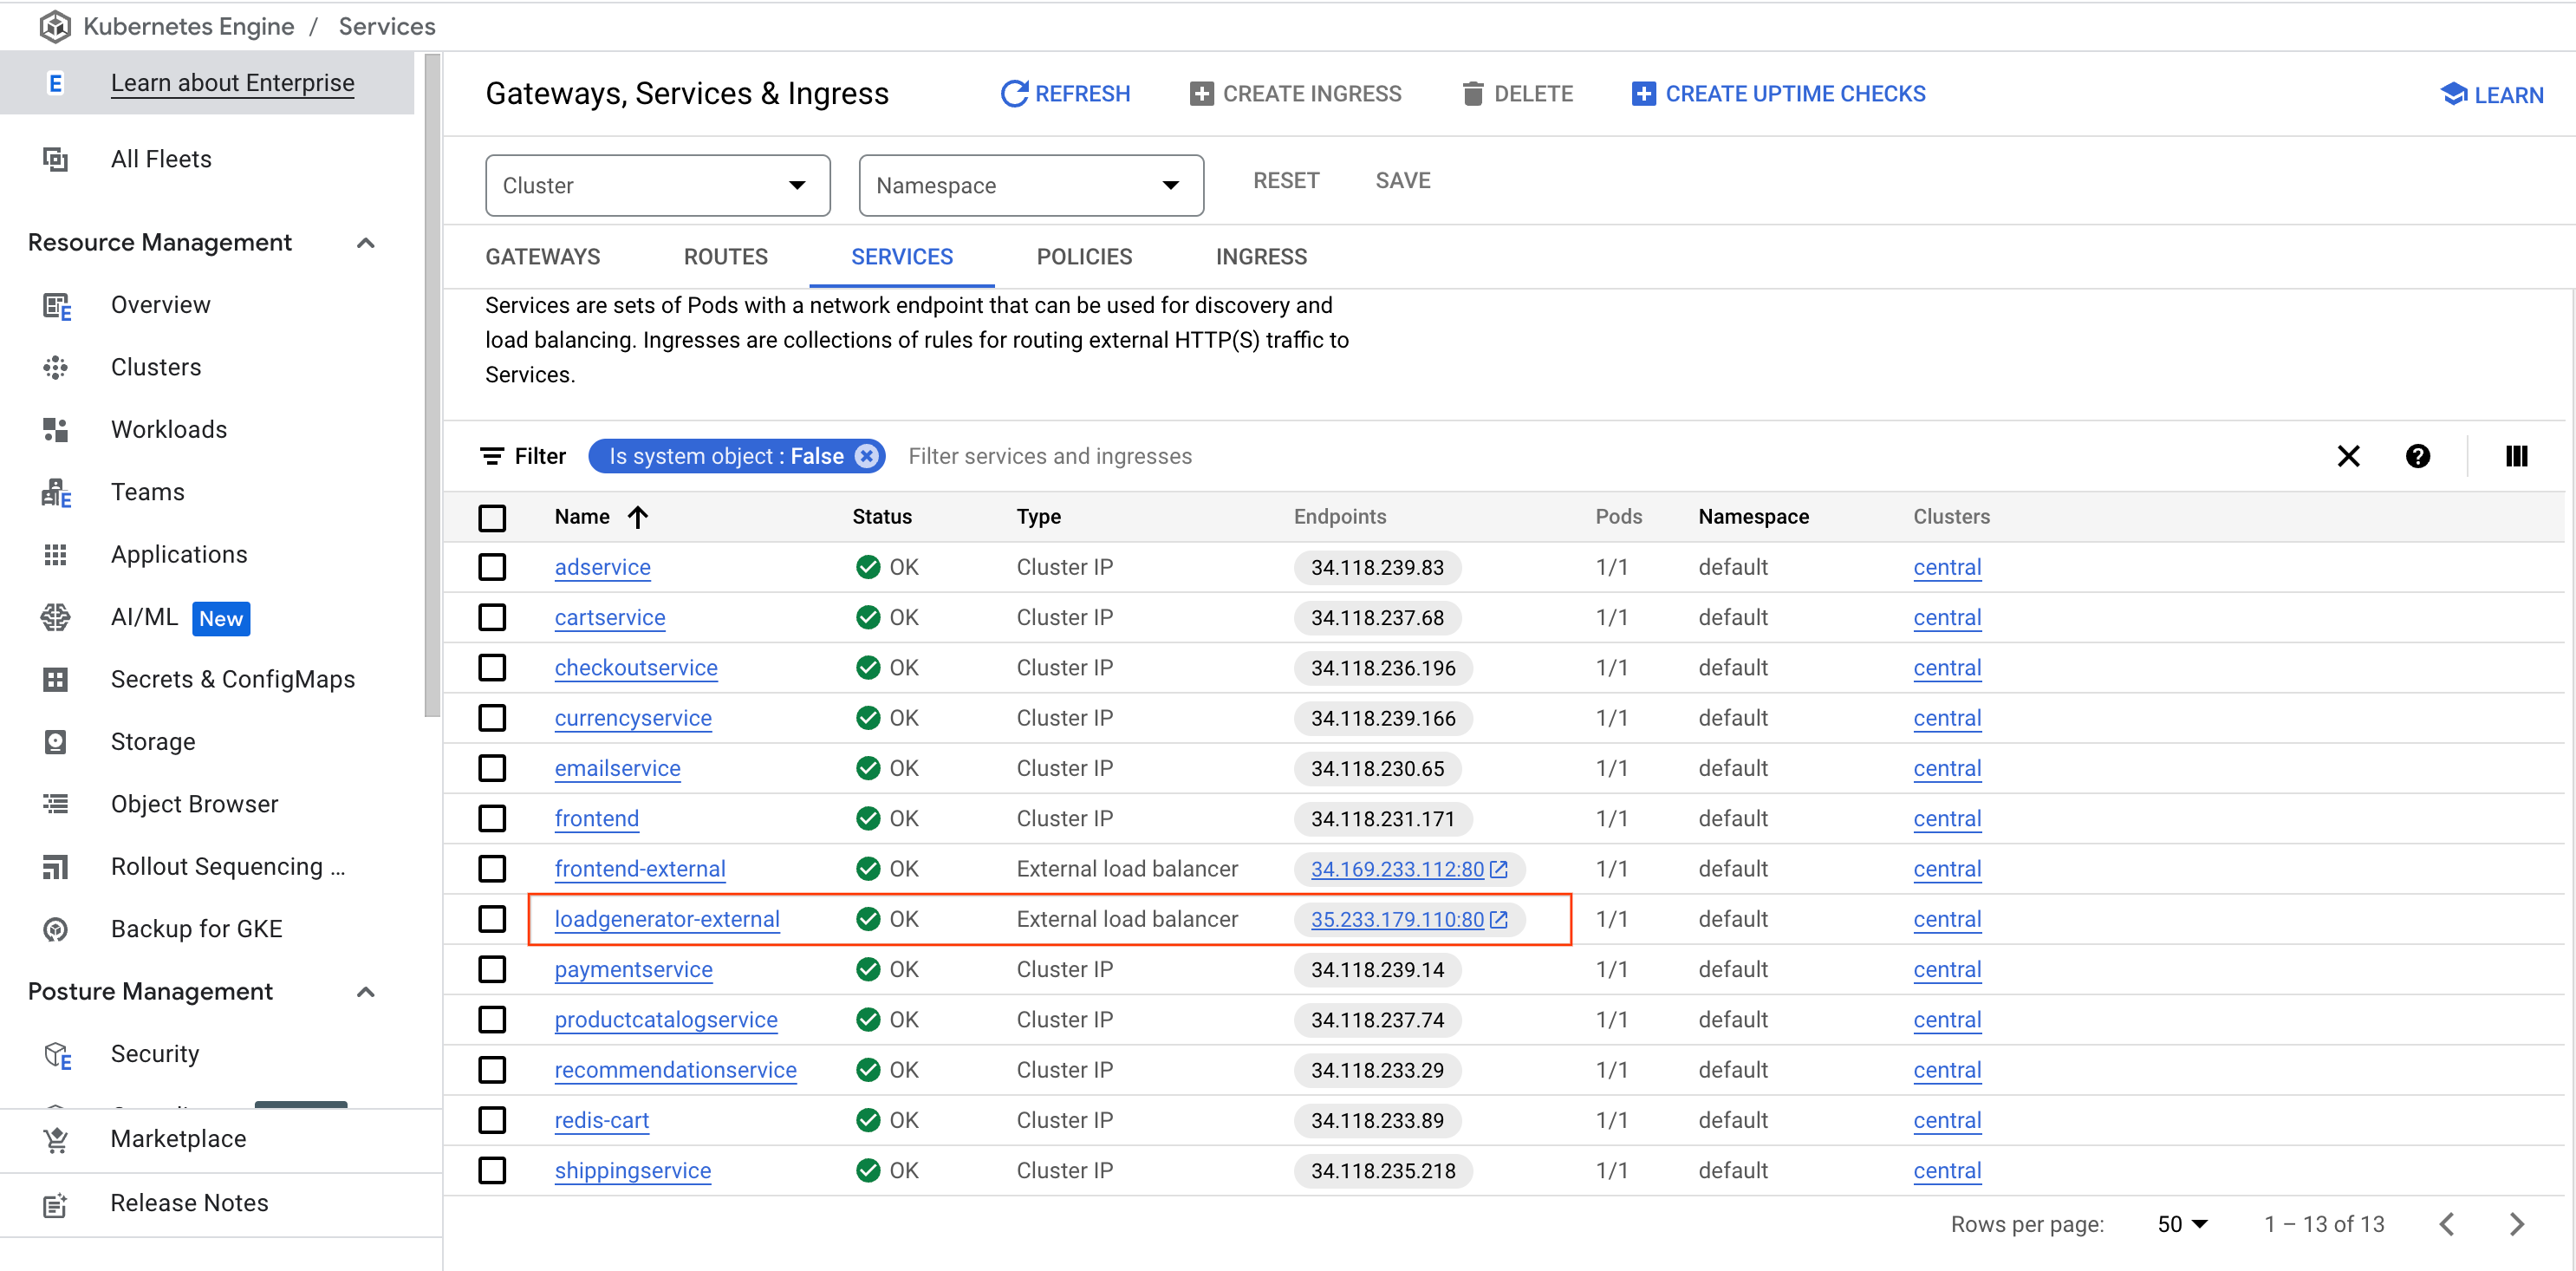
From the Navigation menu, select Kubernetes Engine, then Gateways, Services & Ingress, and click the Services tab.
Find the loadgenerator-external service, then click on the endpoints link.
Alternatively, you can open a new browser tab or window, copy/paste the IP to the URL field, for example: http://\[loadgenerator-external-ip\].
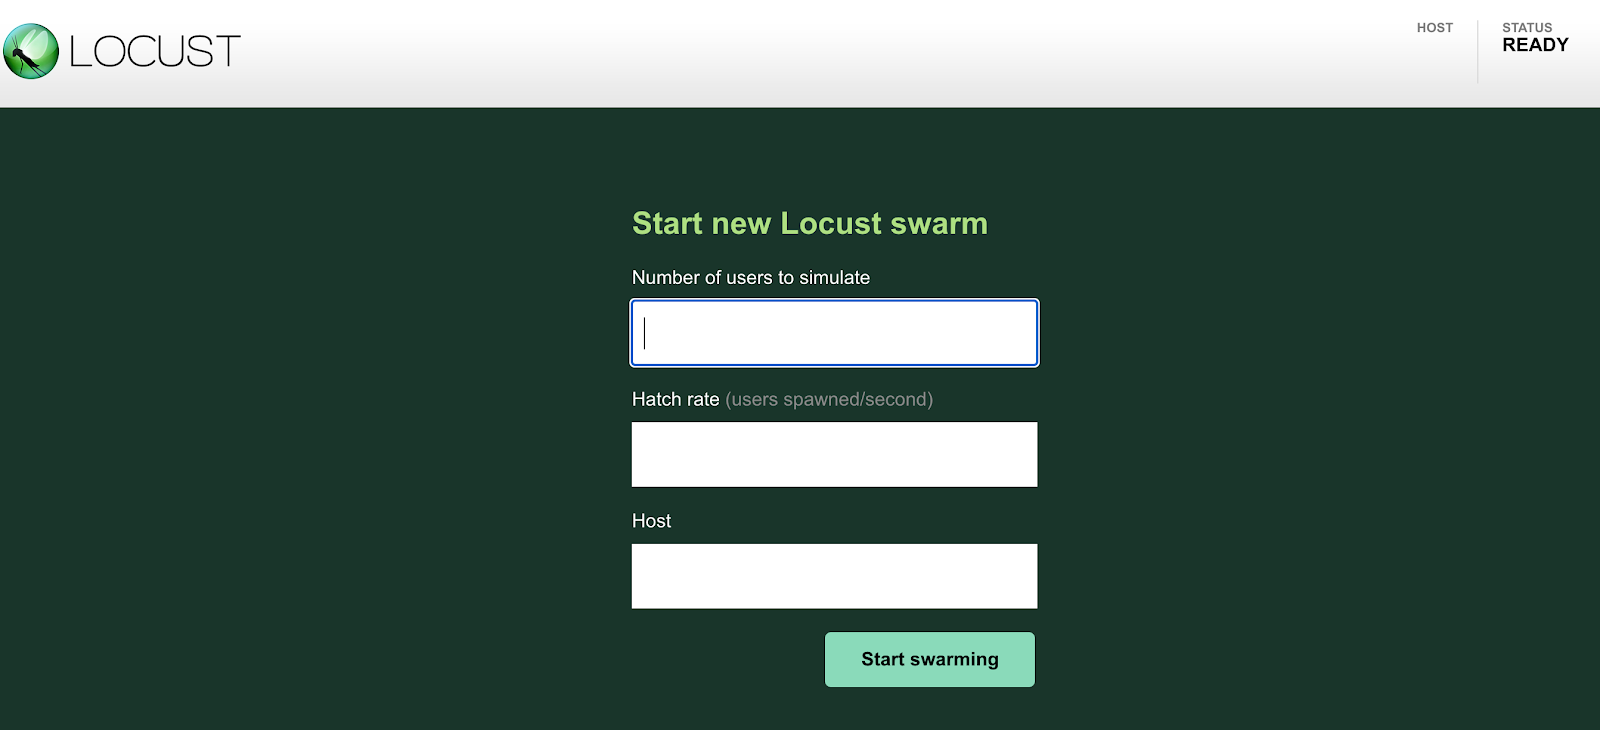
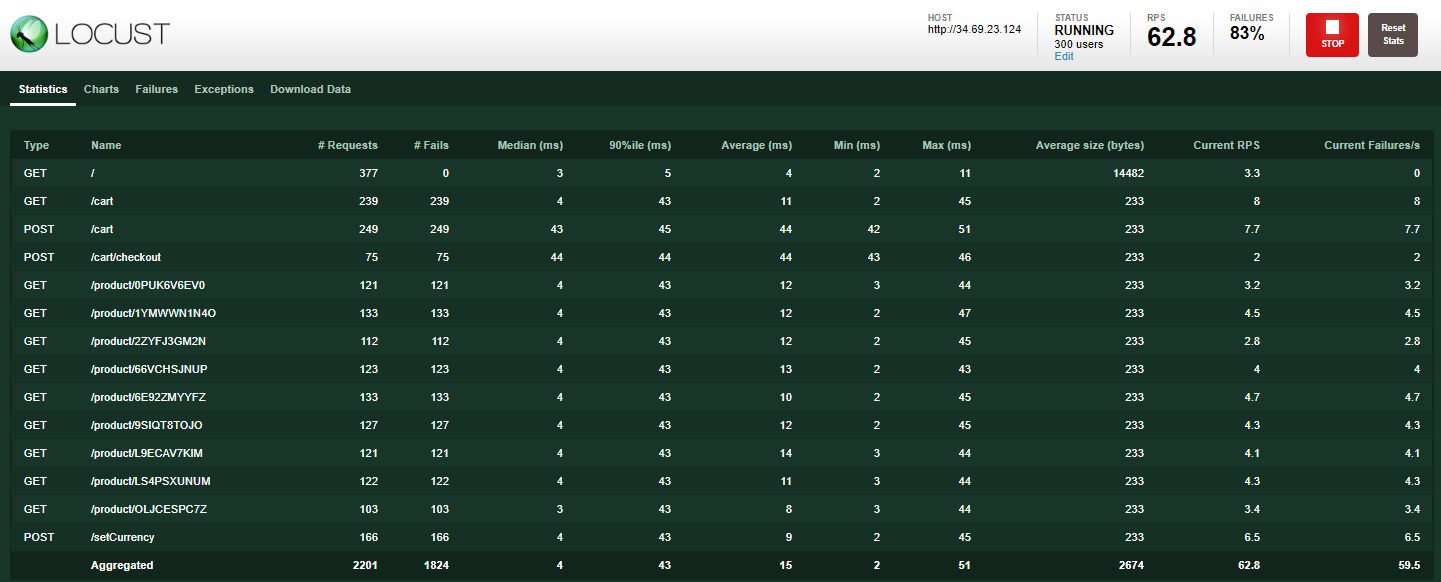
You should now be on the Locust load generator page:
Locust is an open-source load generator, which allows you to load test a web app. It can simulate a number of users simultaneously hitting your application endpoints at a certain rate.
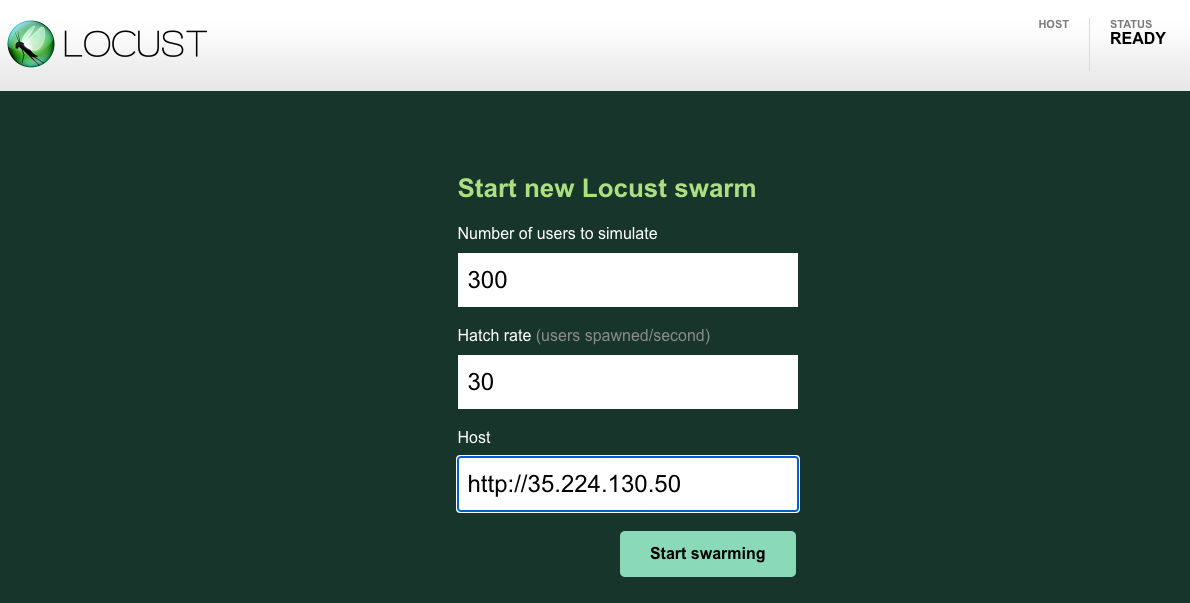
Simulate 300 users hitting the app with a hatch rate of 30. Locust adds 30 users per second until it reaches 300 users.
For the host field, you use the frontend-external. Copy the URL from the Gateways, Services & Ingress page; be sure to exclude the port. For example:
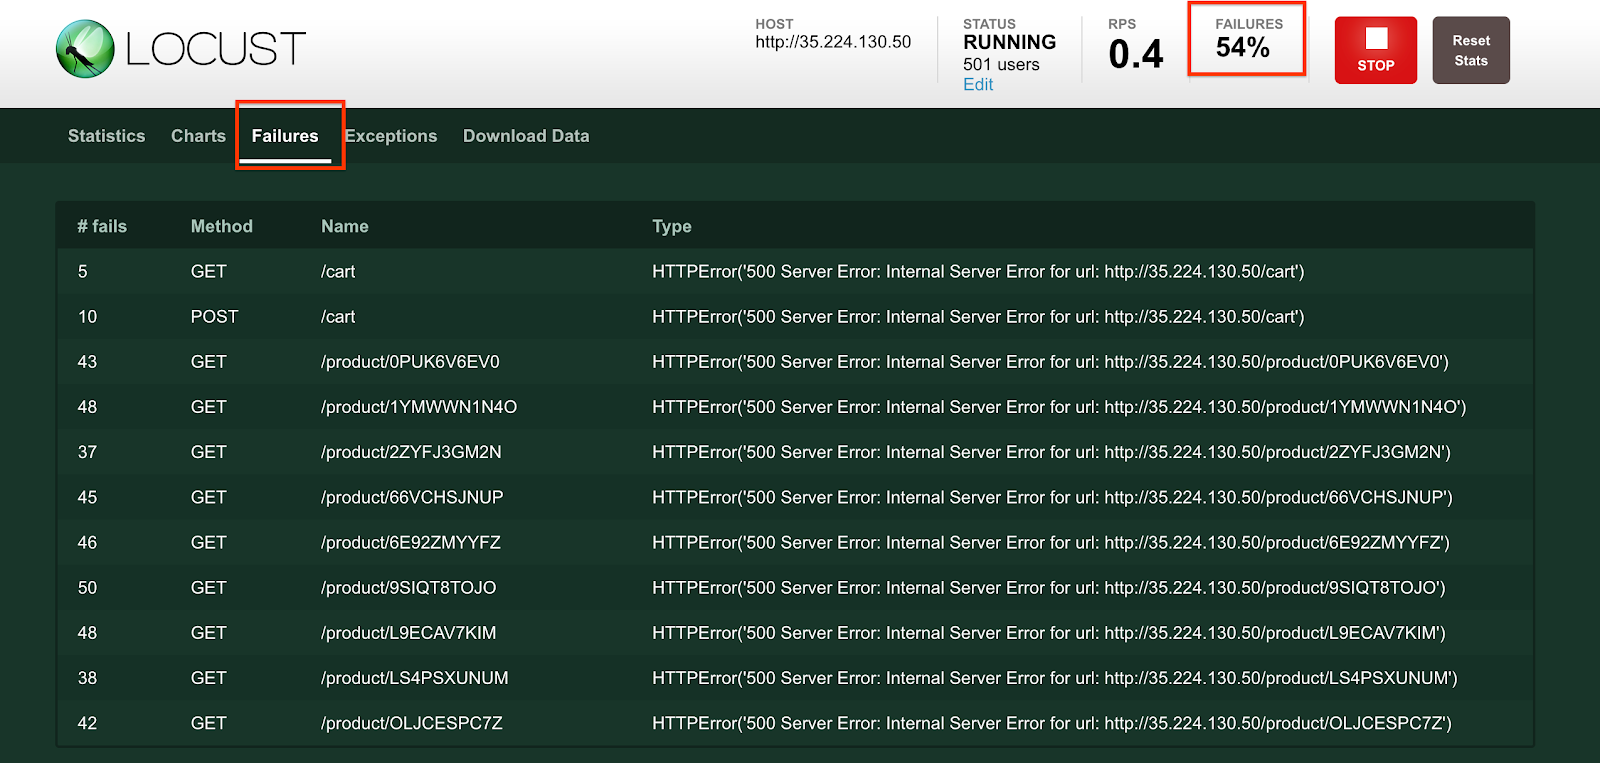
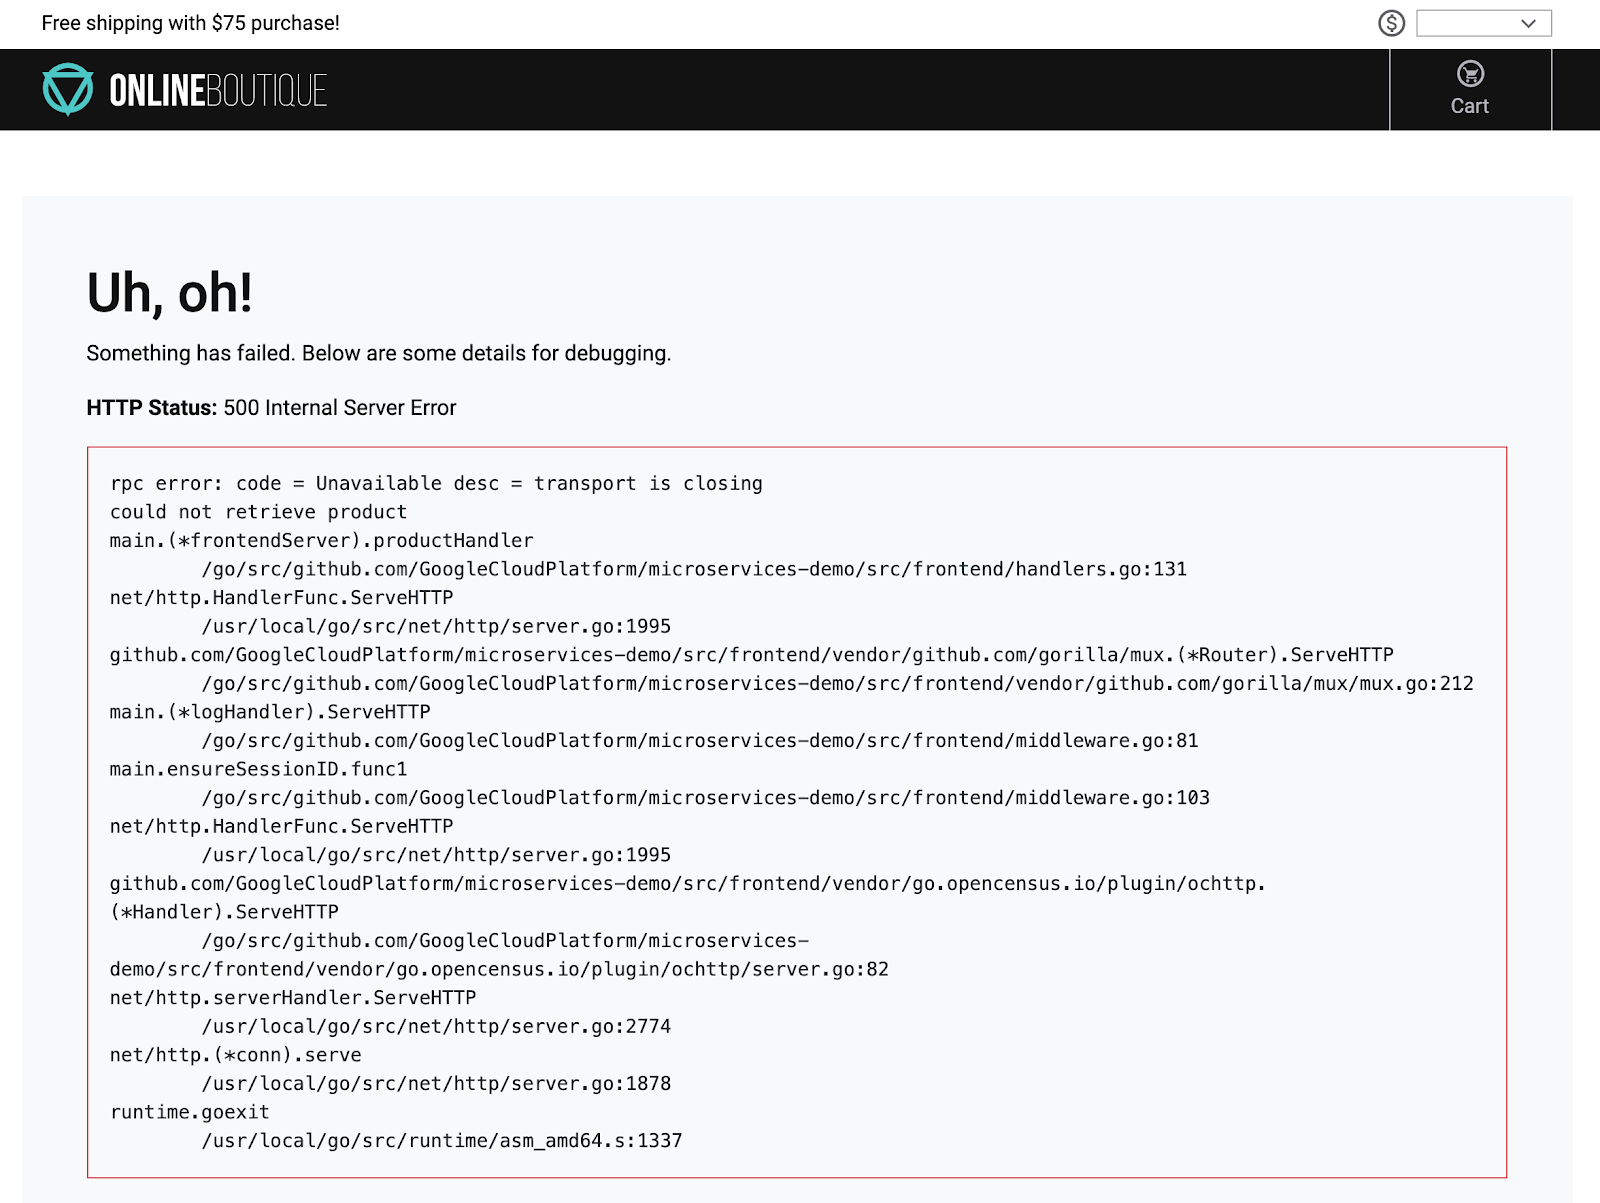
Meanwhile, if you click any product on the home page, it's either noticeably slow or you receive errors like the following if you click on a product:
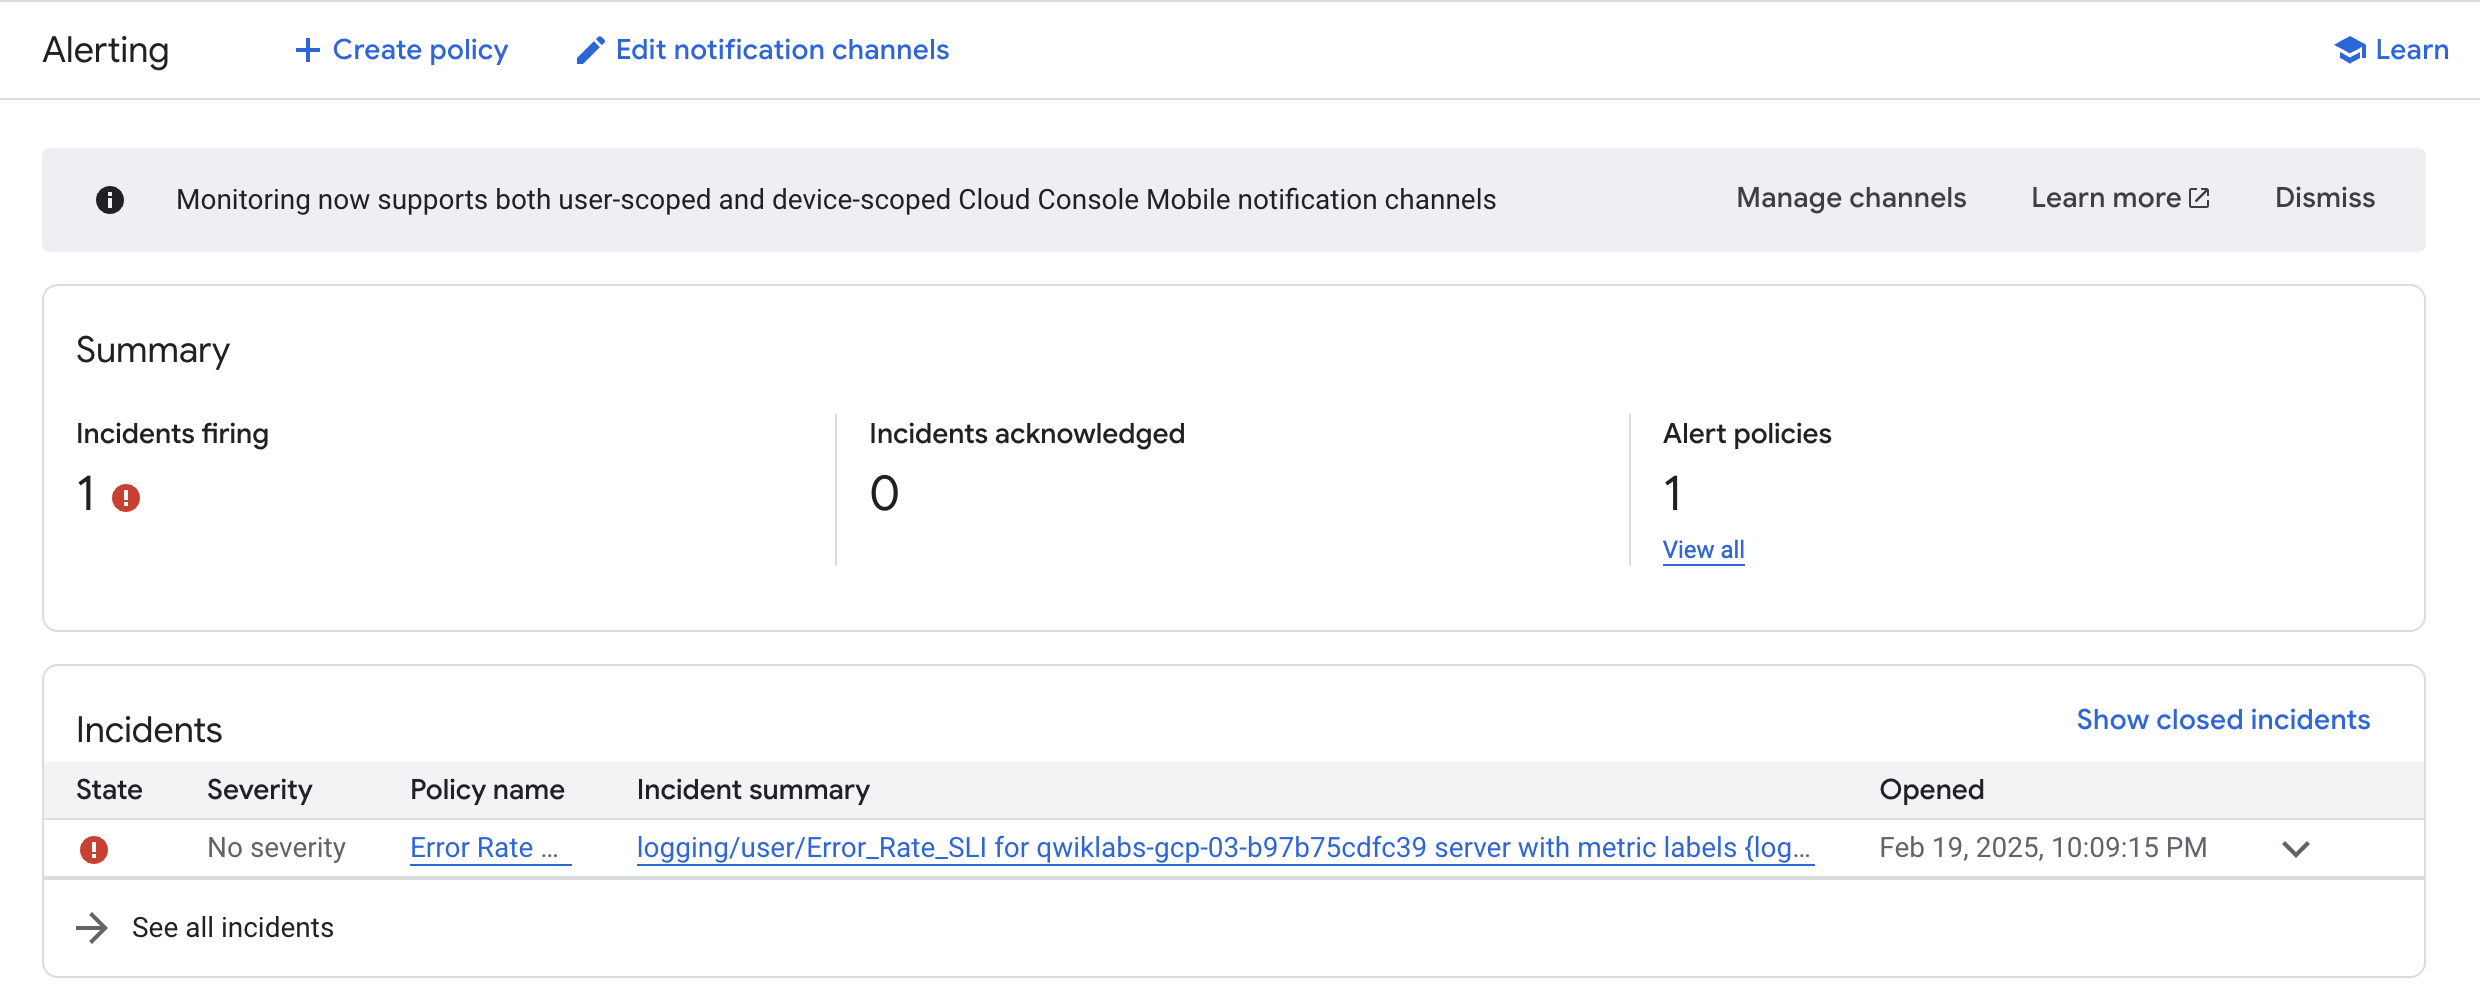
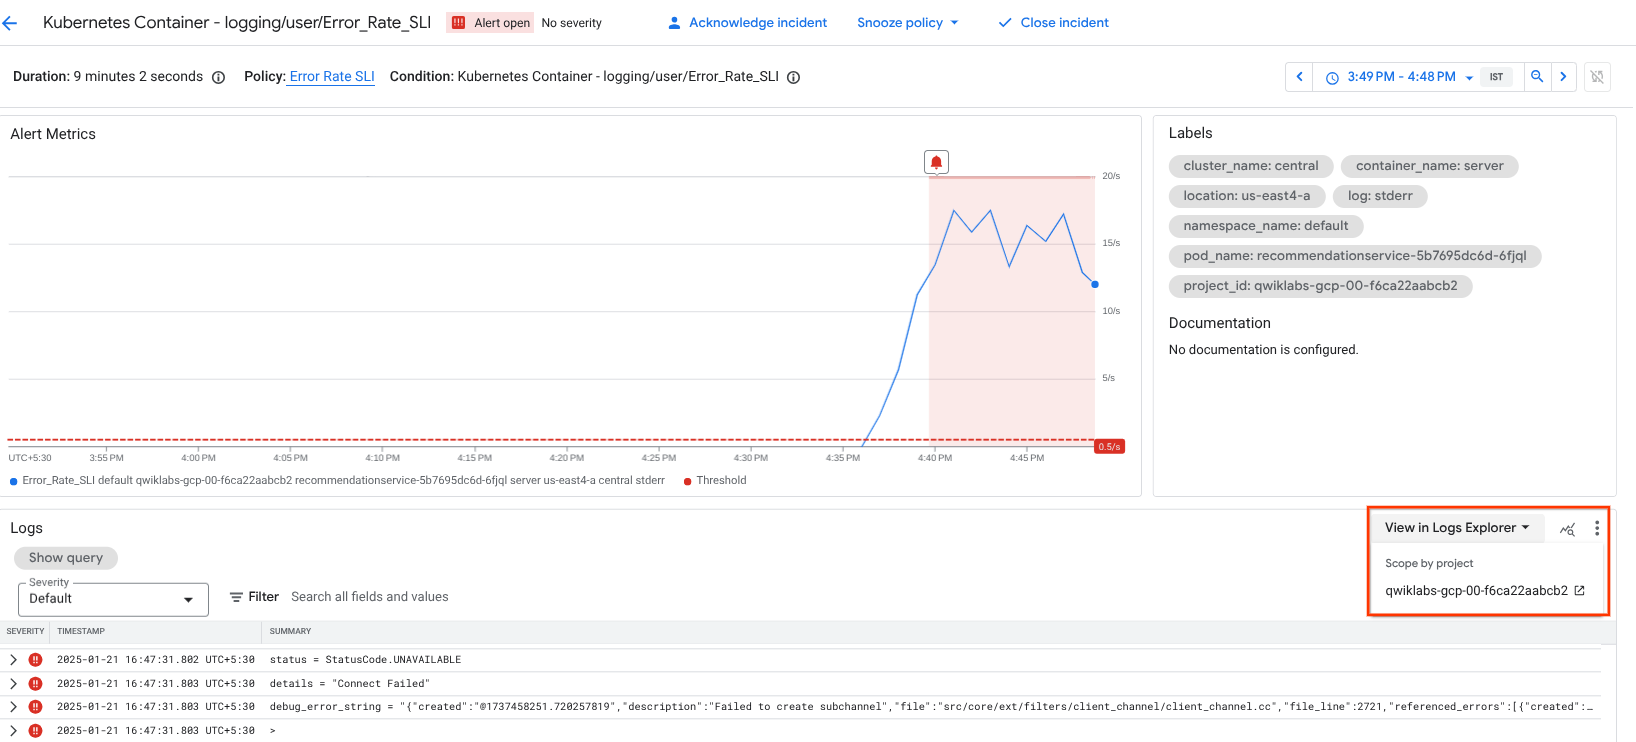
In the console, from the Navigation menu, click Monitoring, then Alerting. You should see an incident soon regarding logging/user/Error_Rate_SLI. If you don't see an incident right away, wait a minute or two and refresh your page. It can take up to 5 minutes for the alert to fire.
Click the link of the incident:
It brings you to the details page.
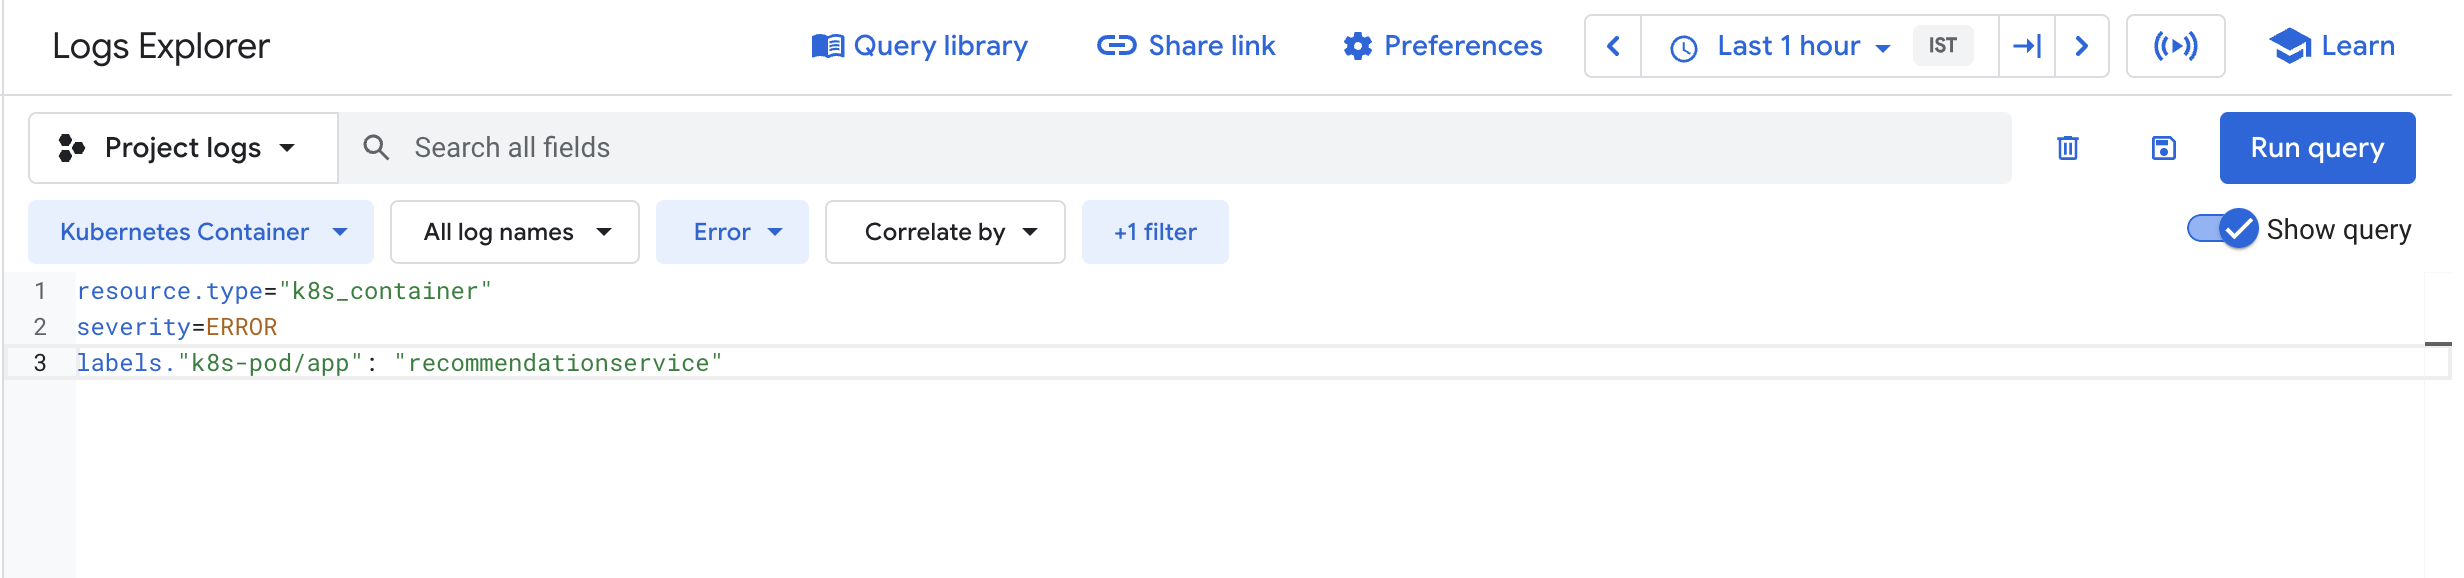
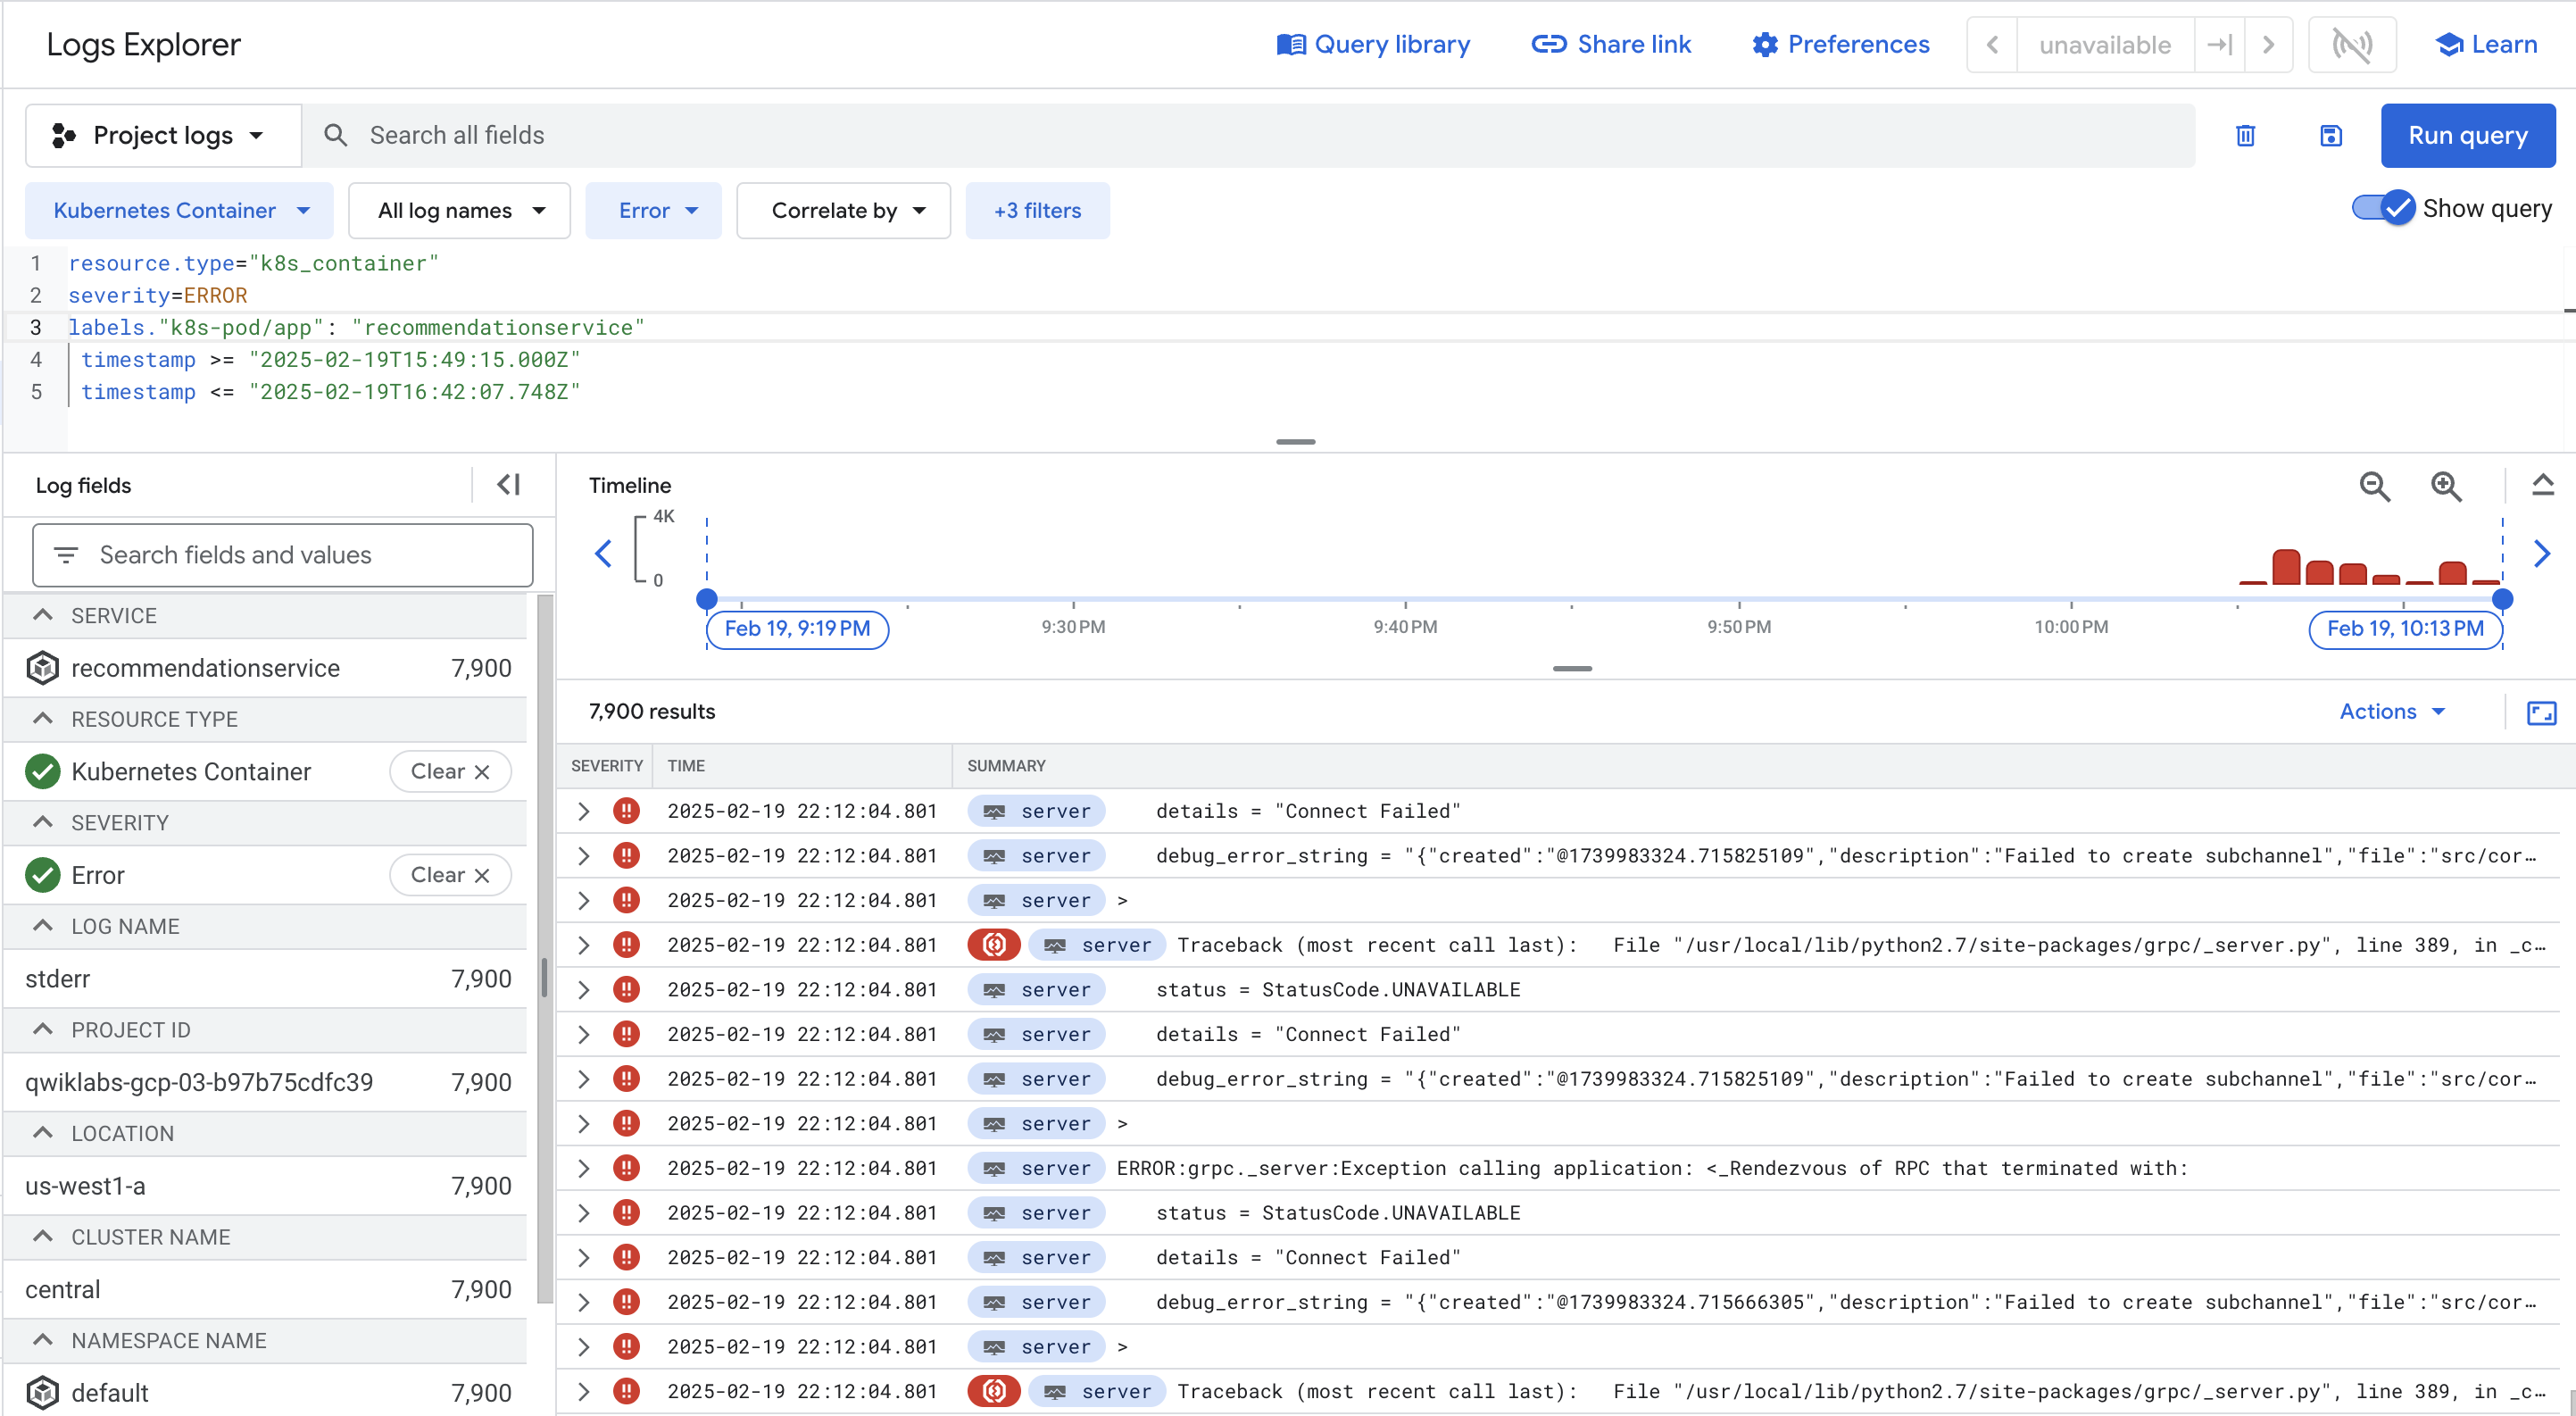
Alternatively, you can click into the Query preview field to show the query builder, then click the Severity dropdown, add Error to the query. Click the Add button, then click Run Query. The dropdown menu allows adding multiple severity values.
The result either way is adding severity=ERROR to your query. Once you do that, you should have all the errors for the recommendationservice pod.
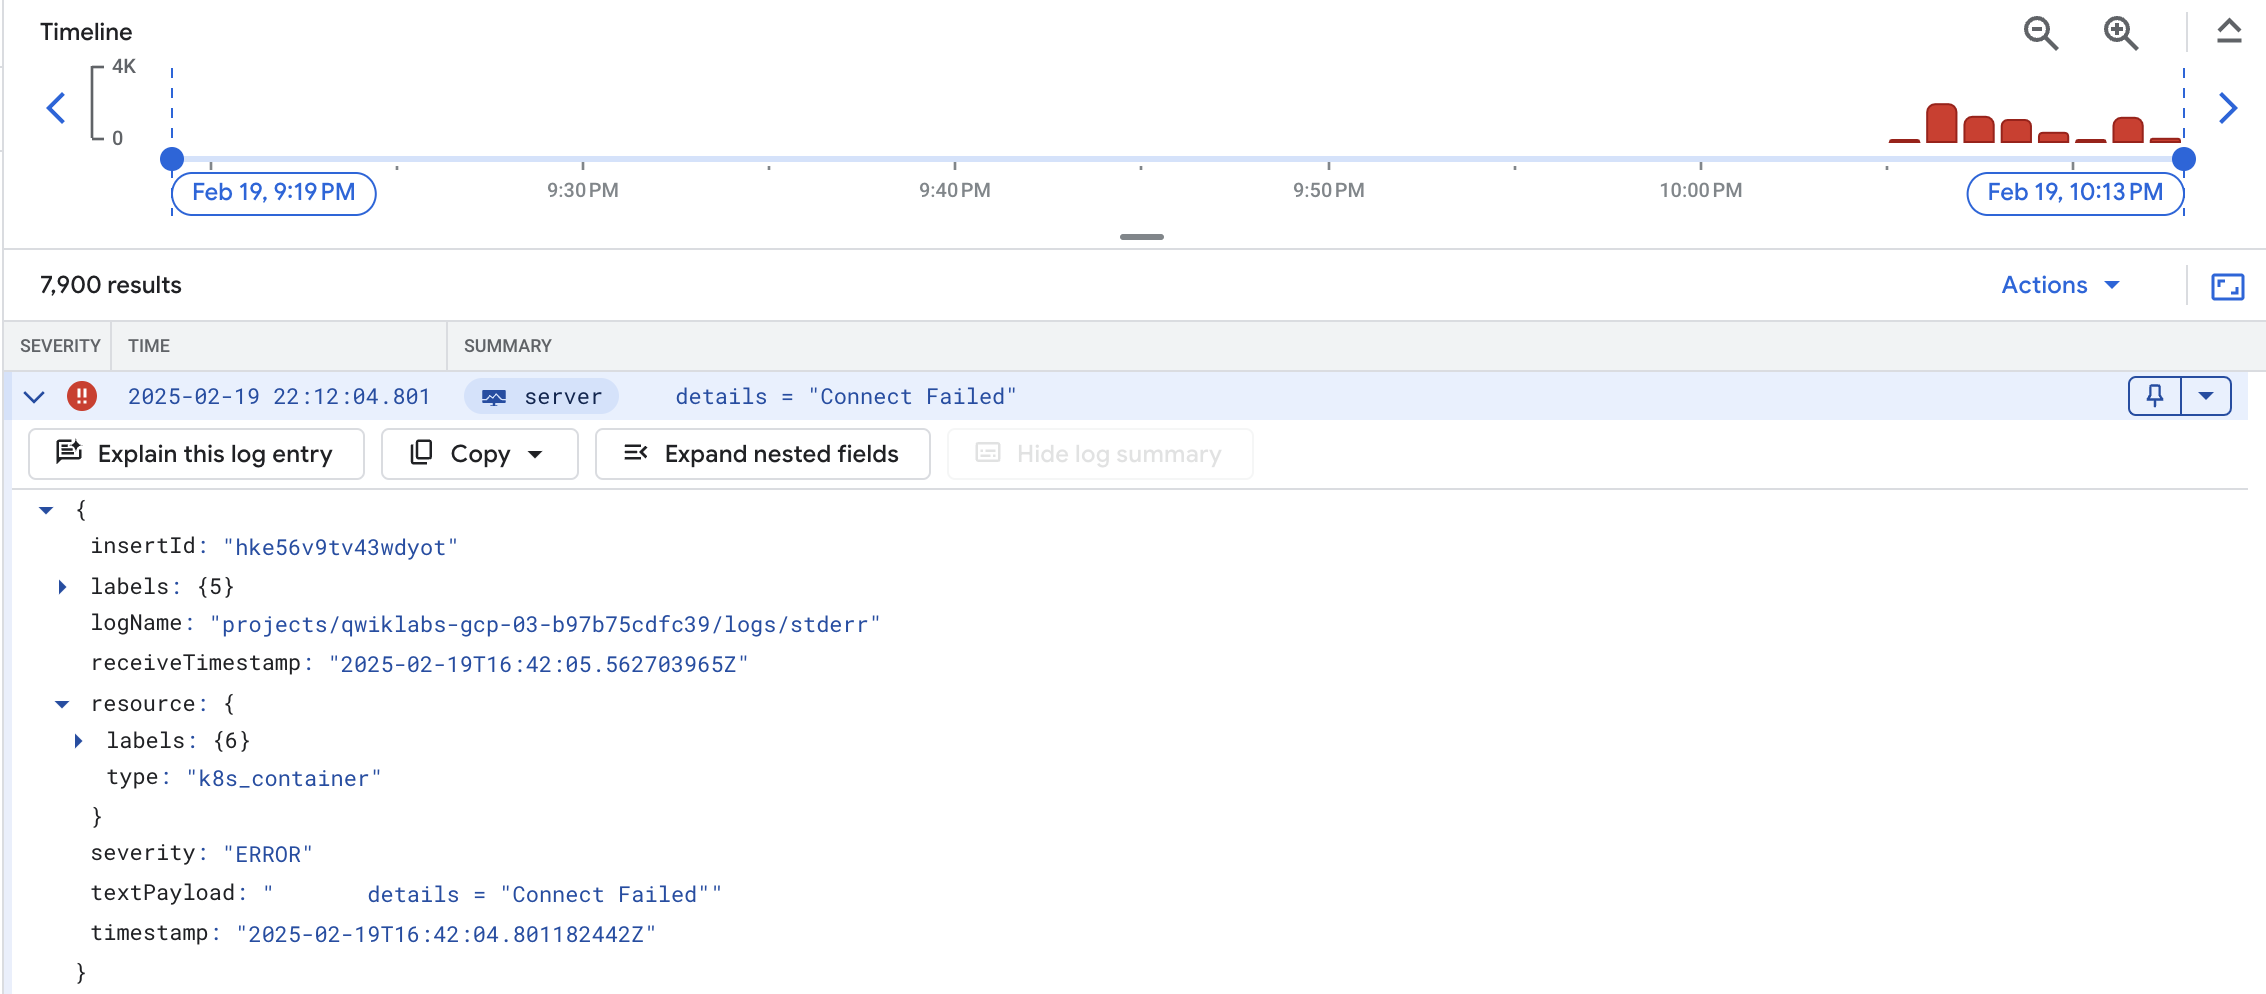
Expand the textPayload.
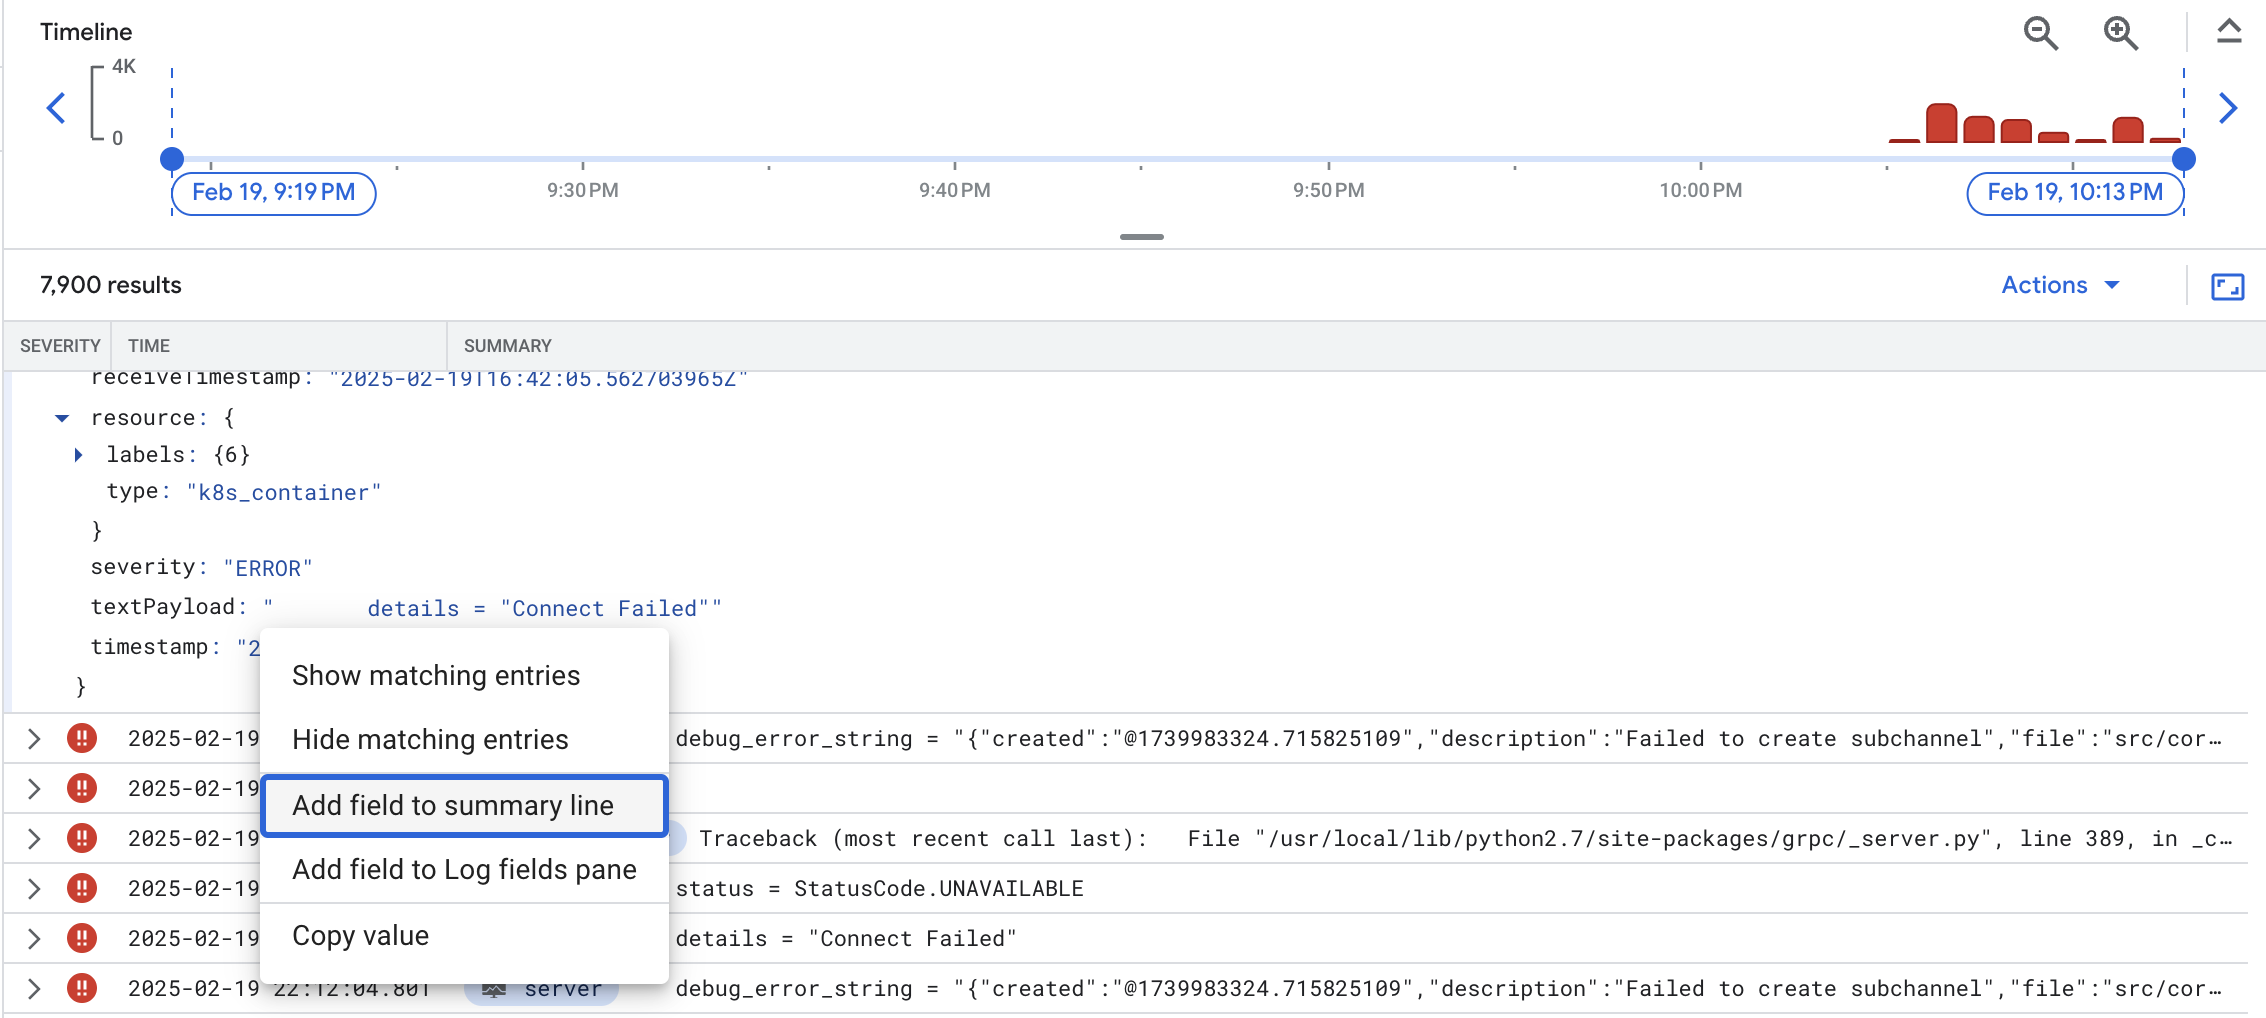
Click the error message and select Add field to summary line to have the error messages appearing as a summary field:
From there, you can confirm there are indeed many errors for the RecommendationService service. Based on the error messages, it appears the RecommendationService couldn't connect to some downstream services to either get products or recommendations. However, it's still not clear what the root cause is for the errors.
If you revisit the architecture diagram, the RecommendationService provides a list of recommendations to the Frontend services. However, both the Frontend service and the RecommendationService invoke ProductCatalogService for a list of products.
For the next step, you will look at the metrics of the main suspect, the ProductCatalogService, for any anomalies. Regardless, you can drill down in the logs to get some insights.
One of the first places that you can look at the metrics is the Kubernetes Engine section of the Monitoring console (Navigation menu > Monitoring> Dashboards > GKE).
View the Workloads section.
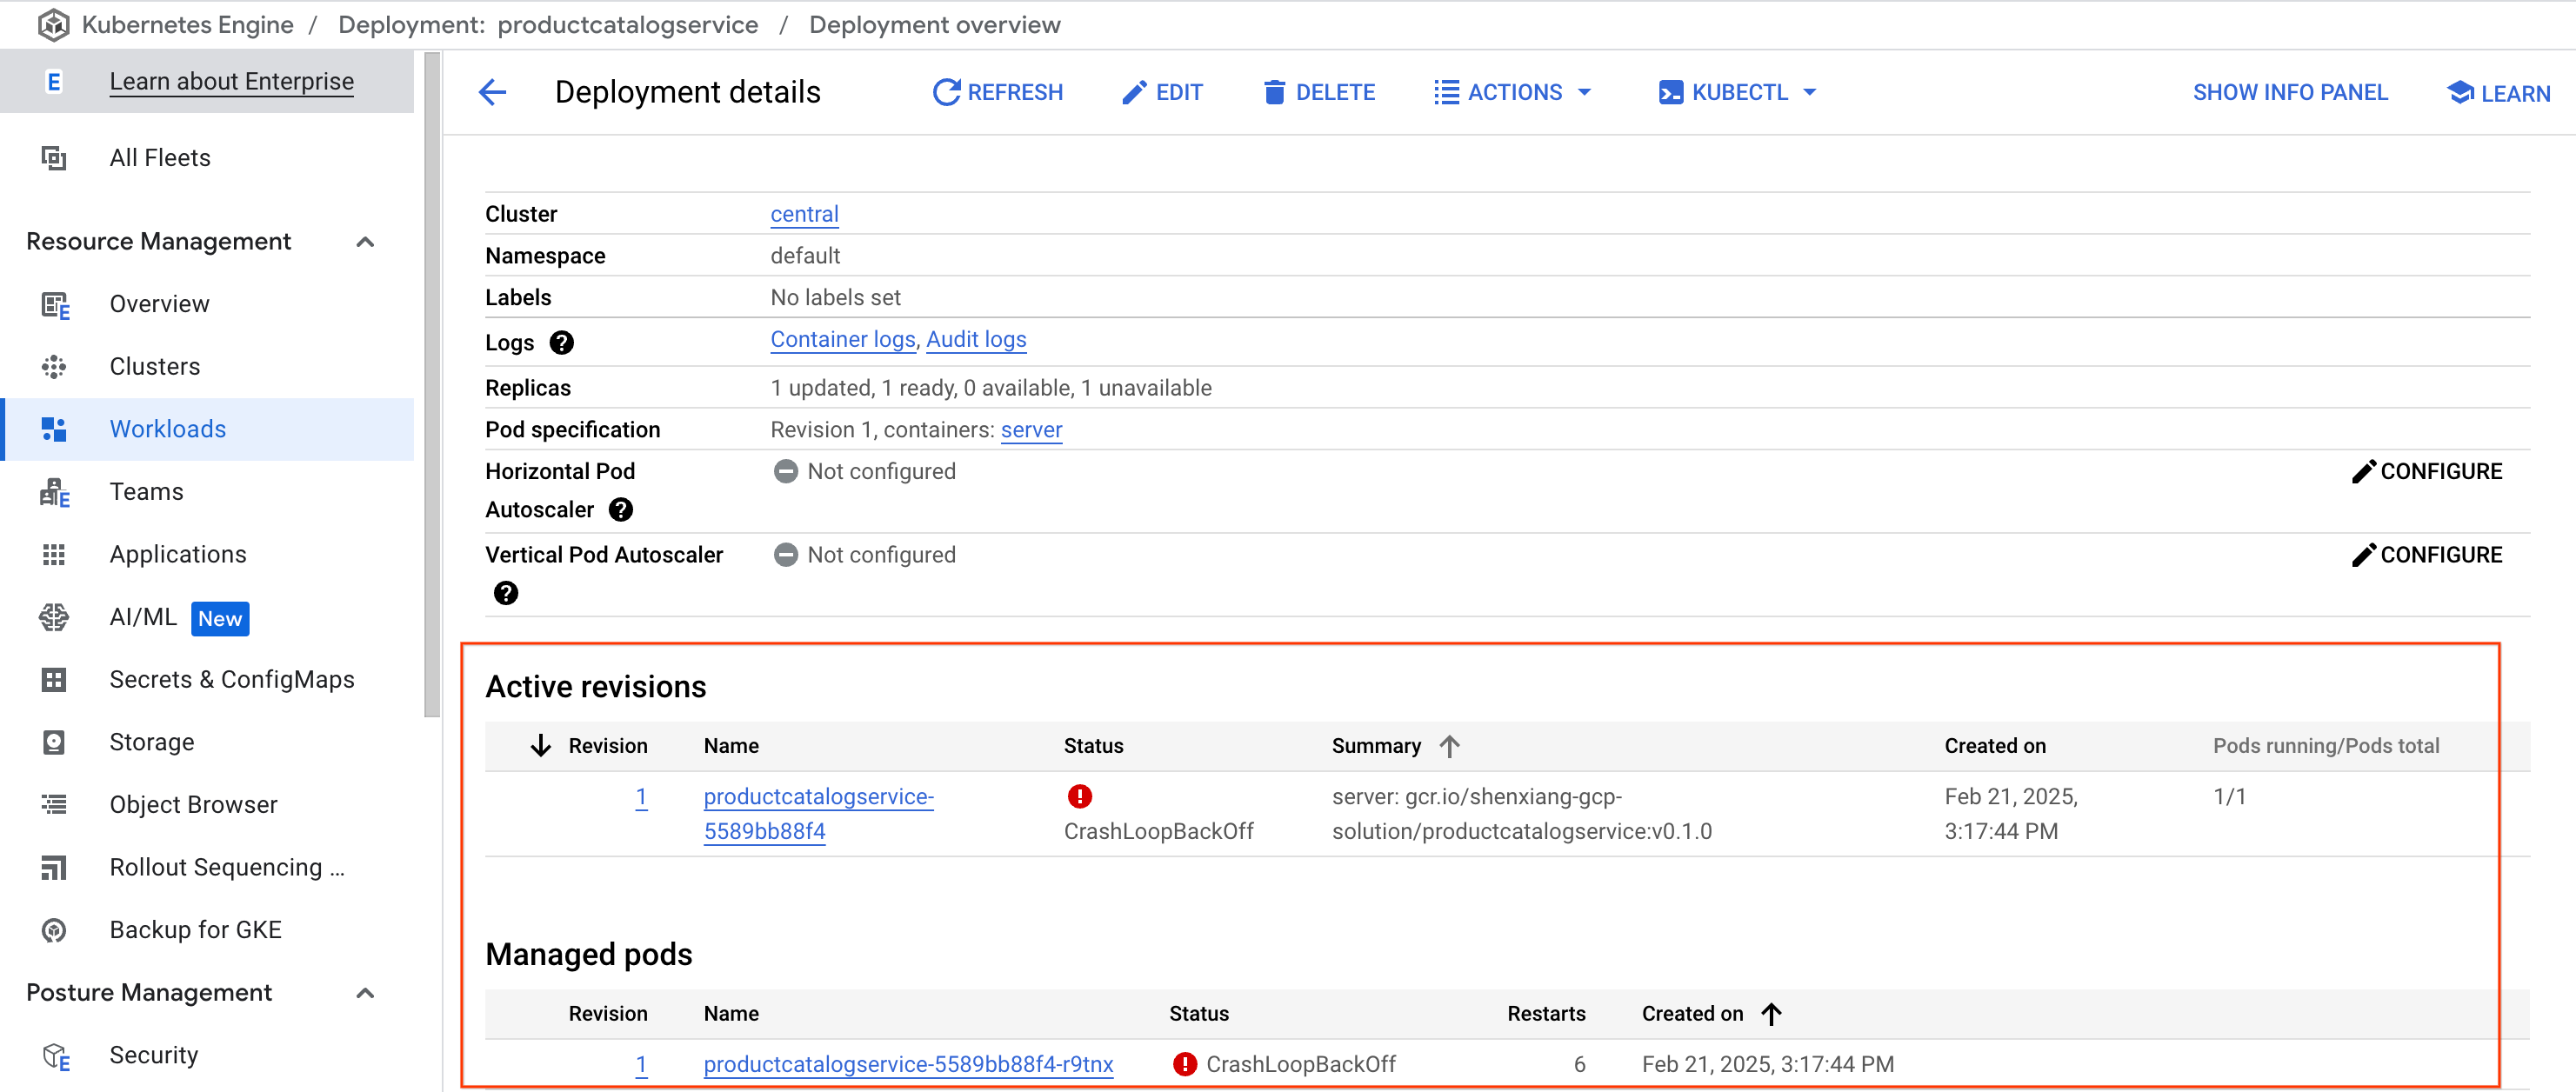
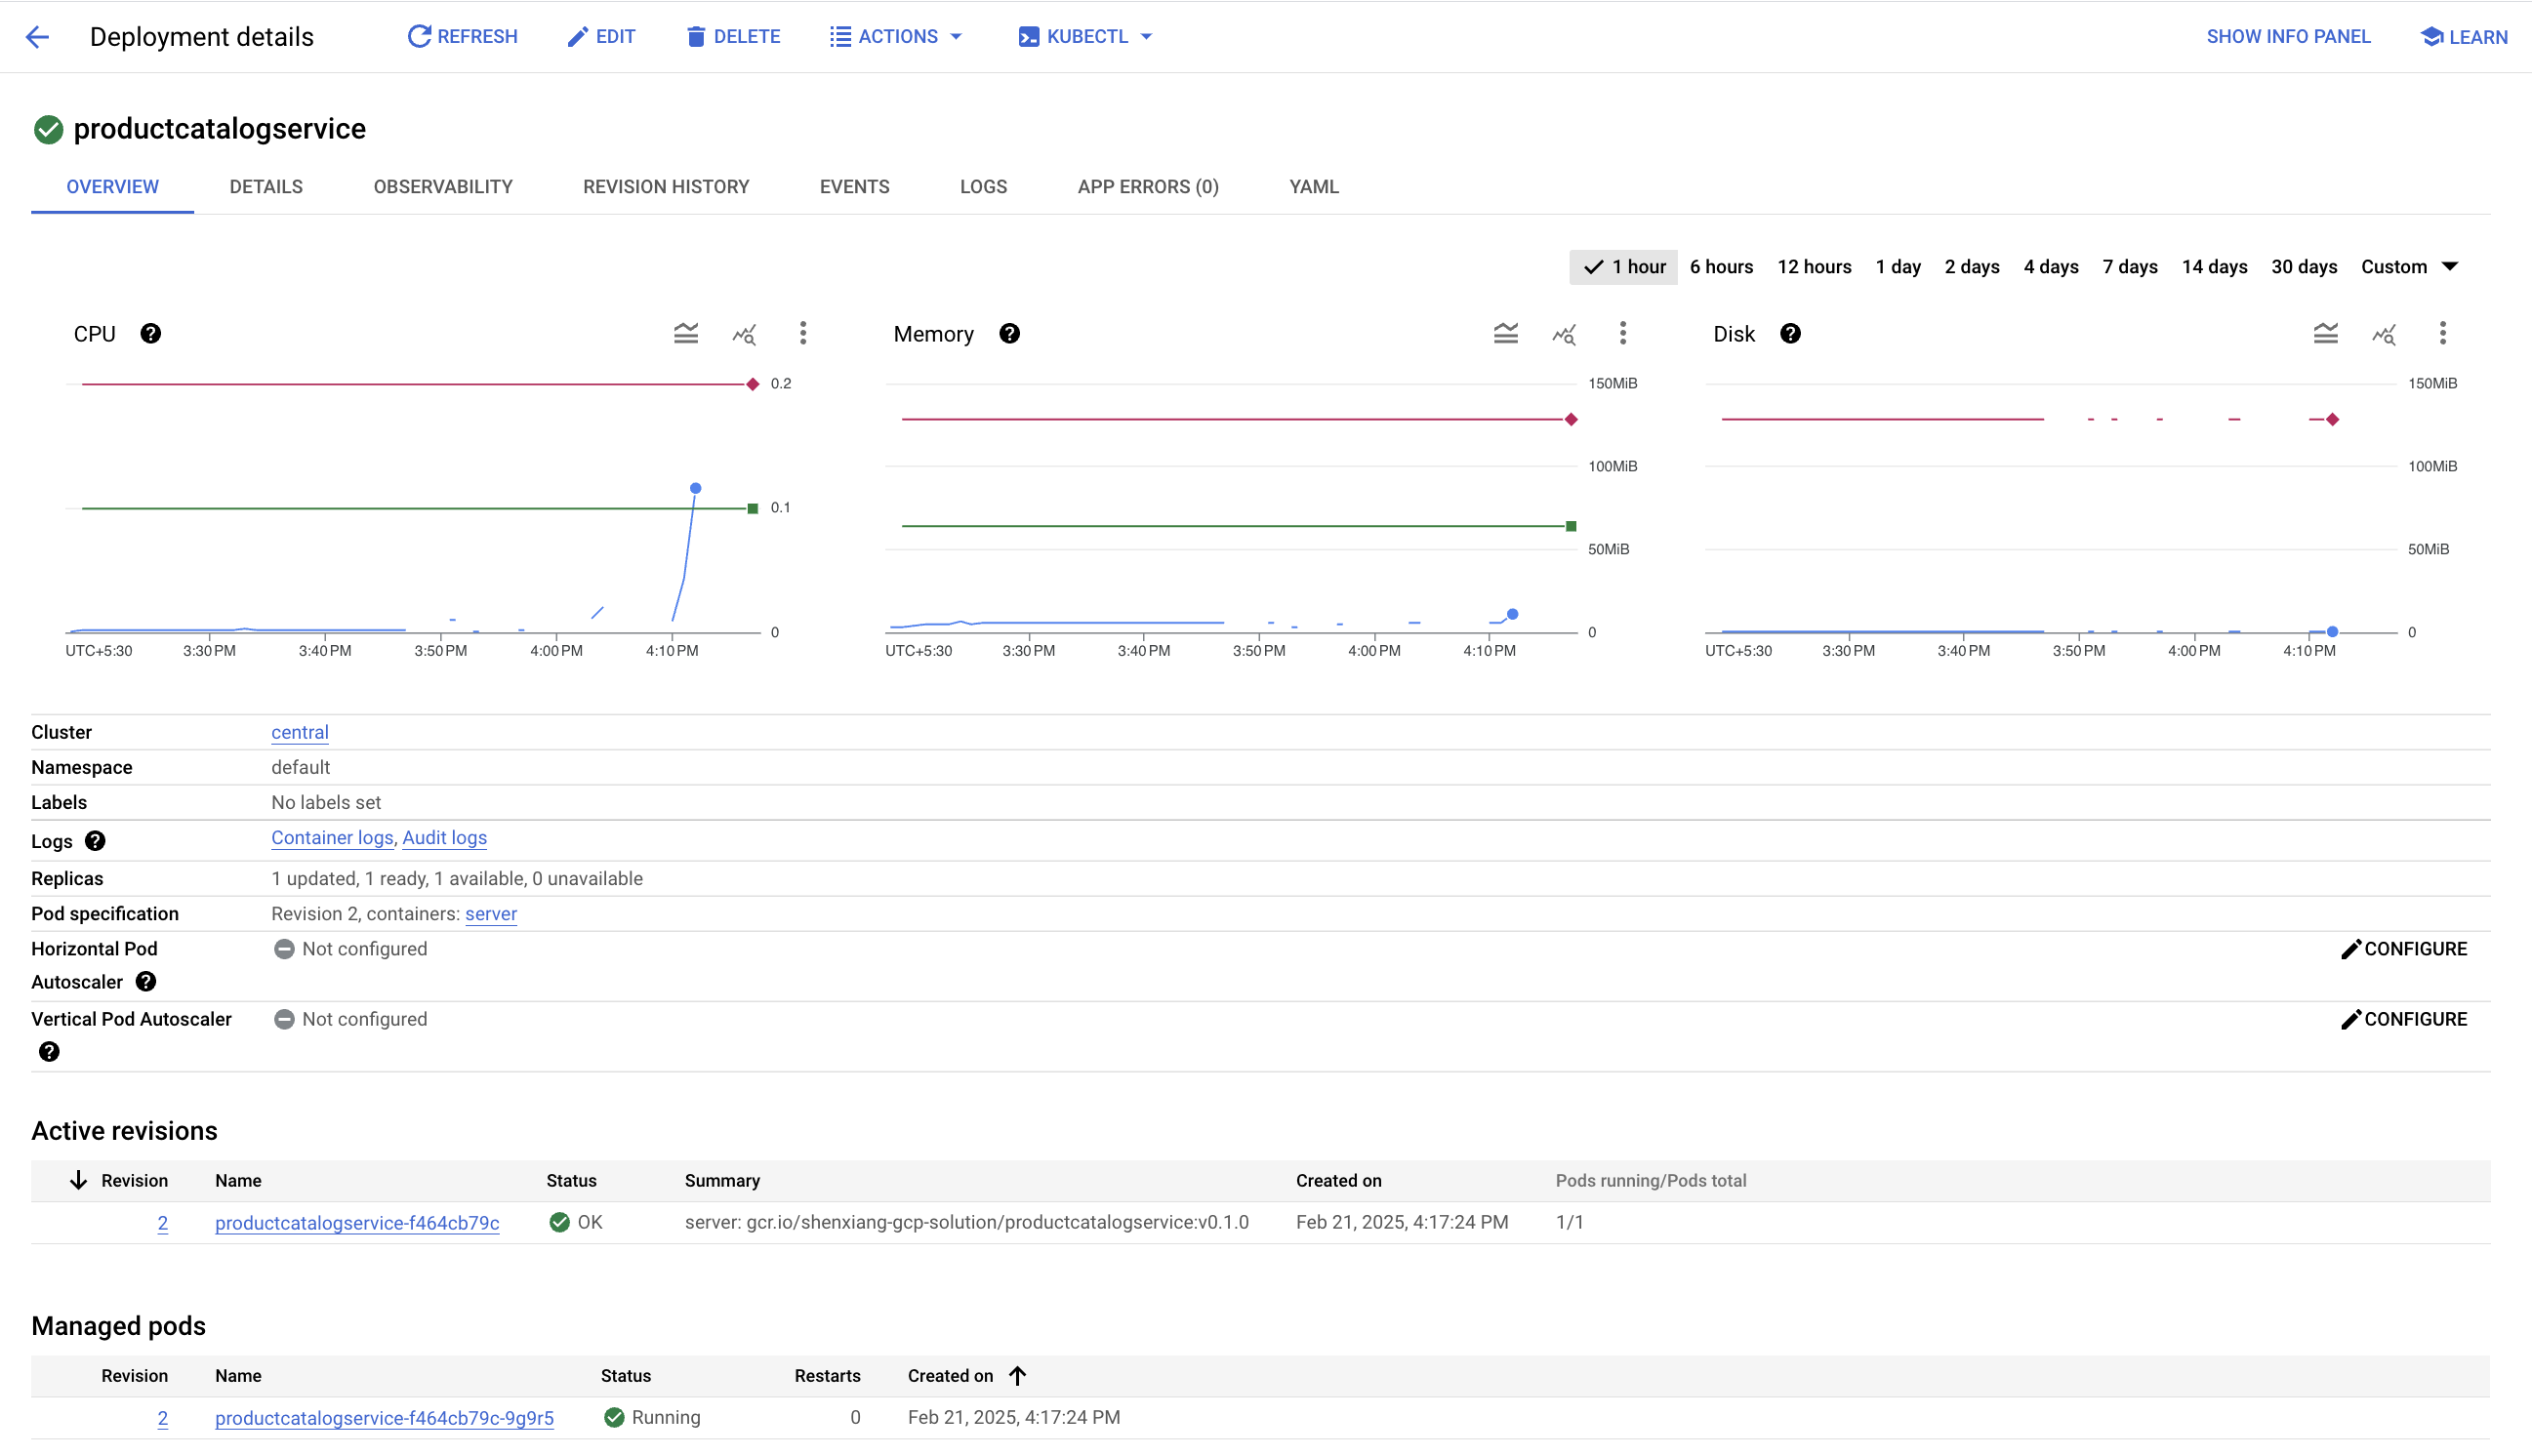
Navigate to Kubernetes Engine > Workloads > productcatalogservice. You can see the pod for the service is constantly crashing and restarting.
Next, see if there is anything interesting in the logs.
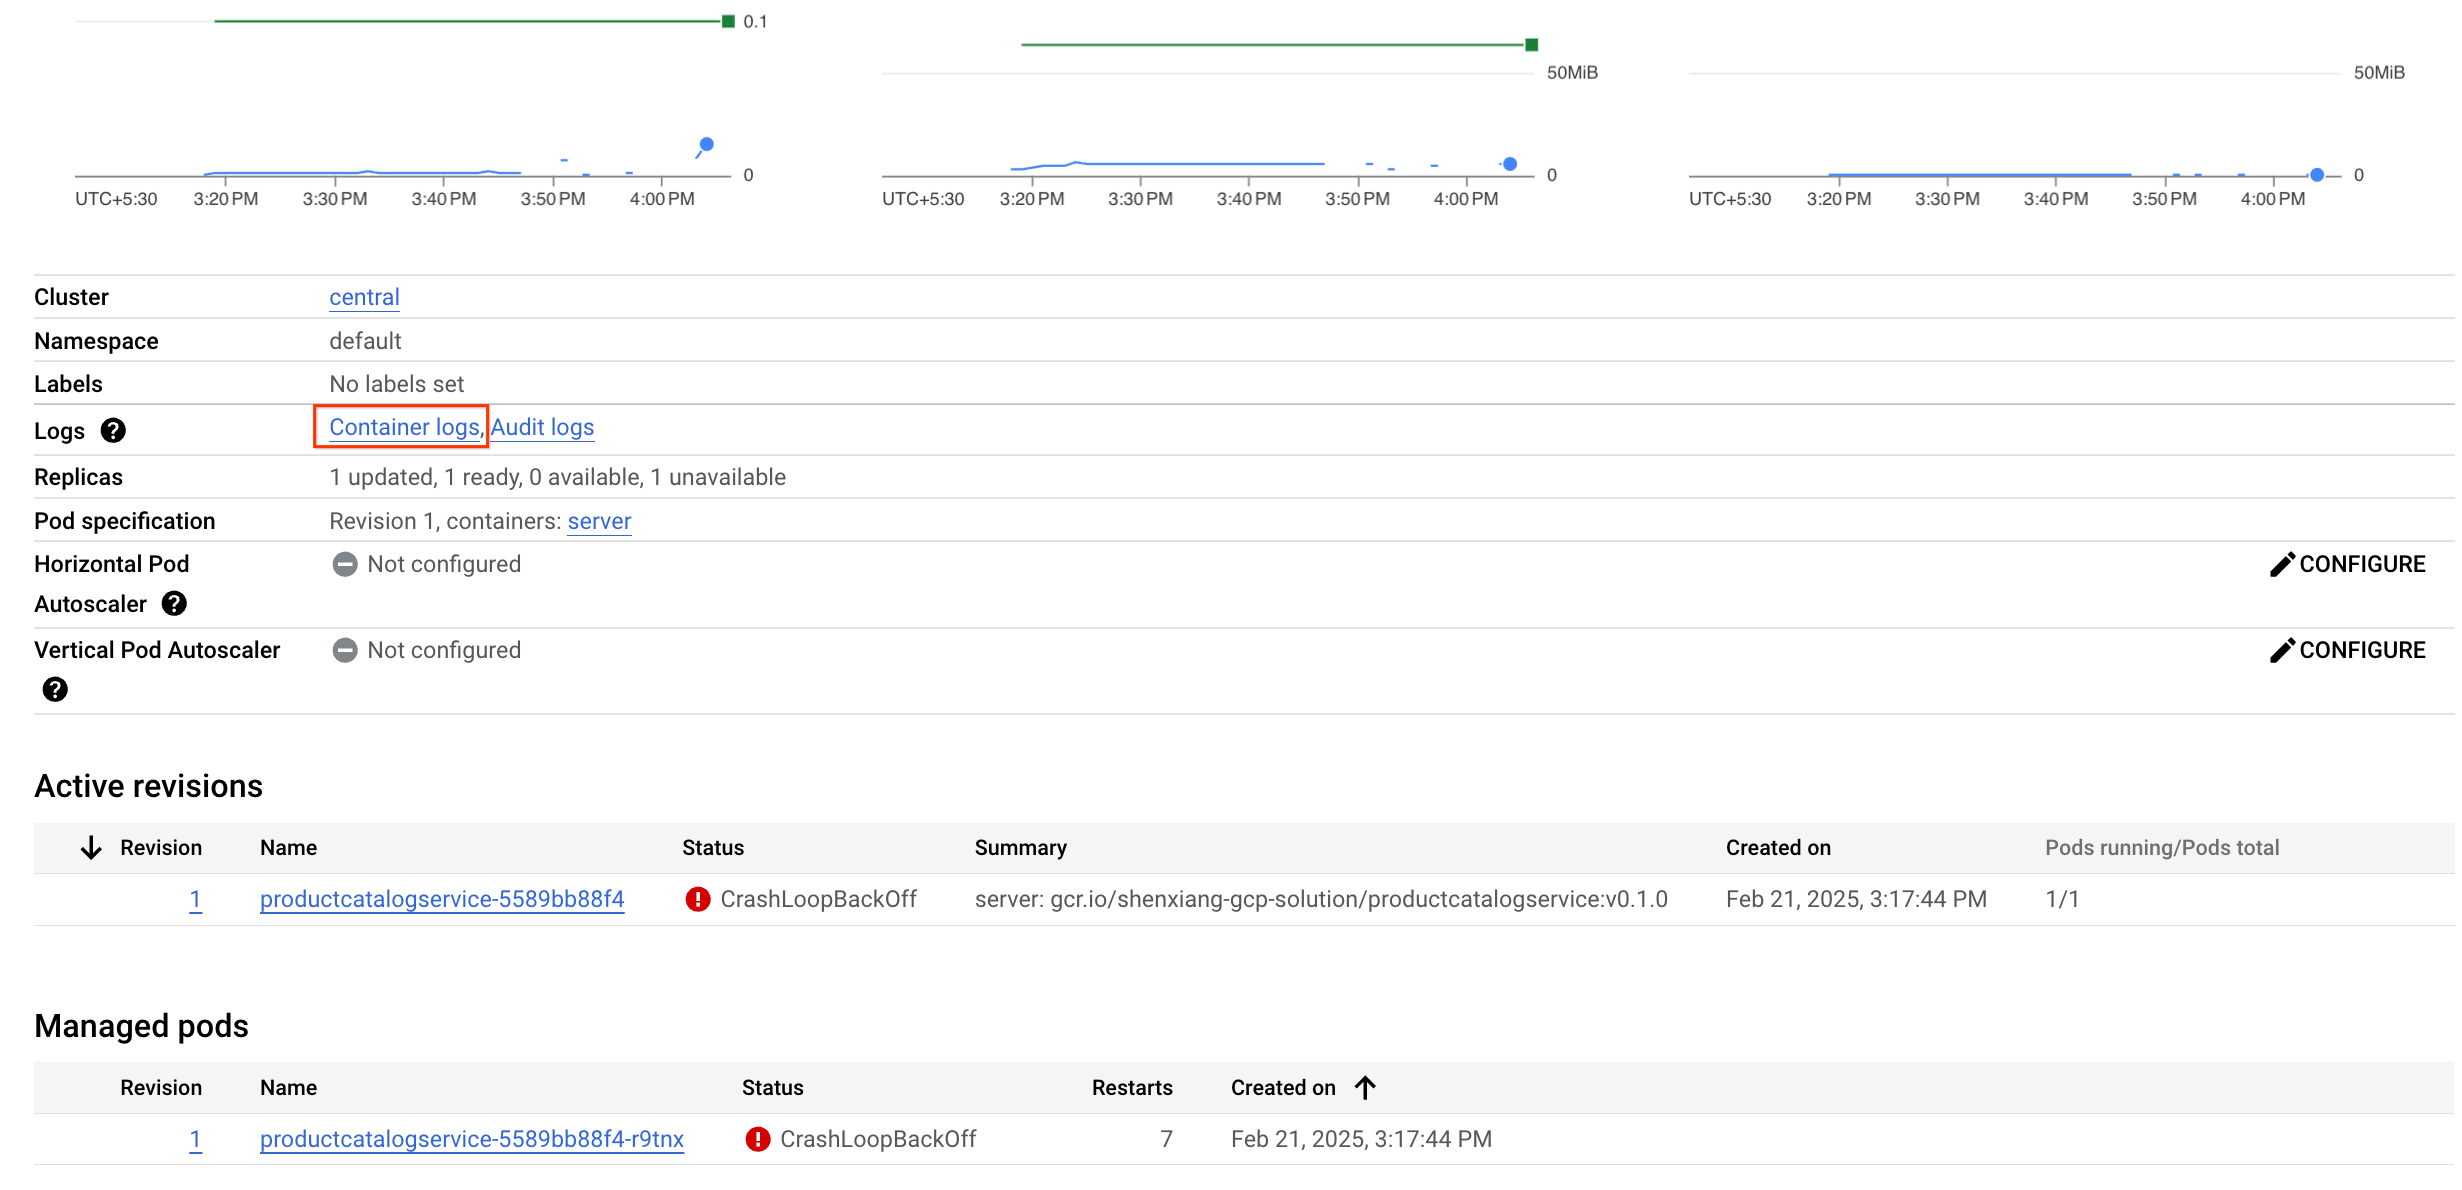
There are 2 ways to easily get to your container logs:
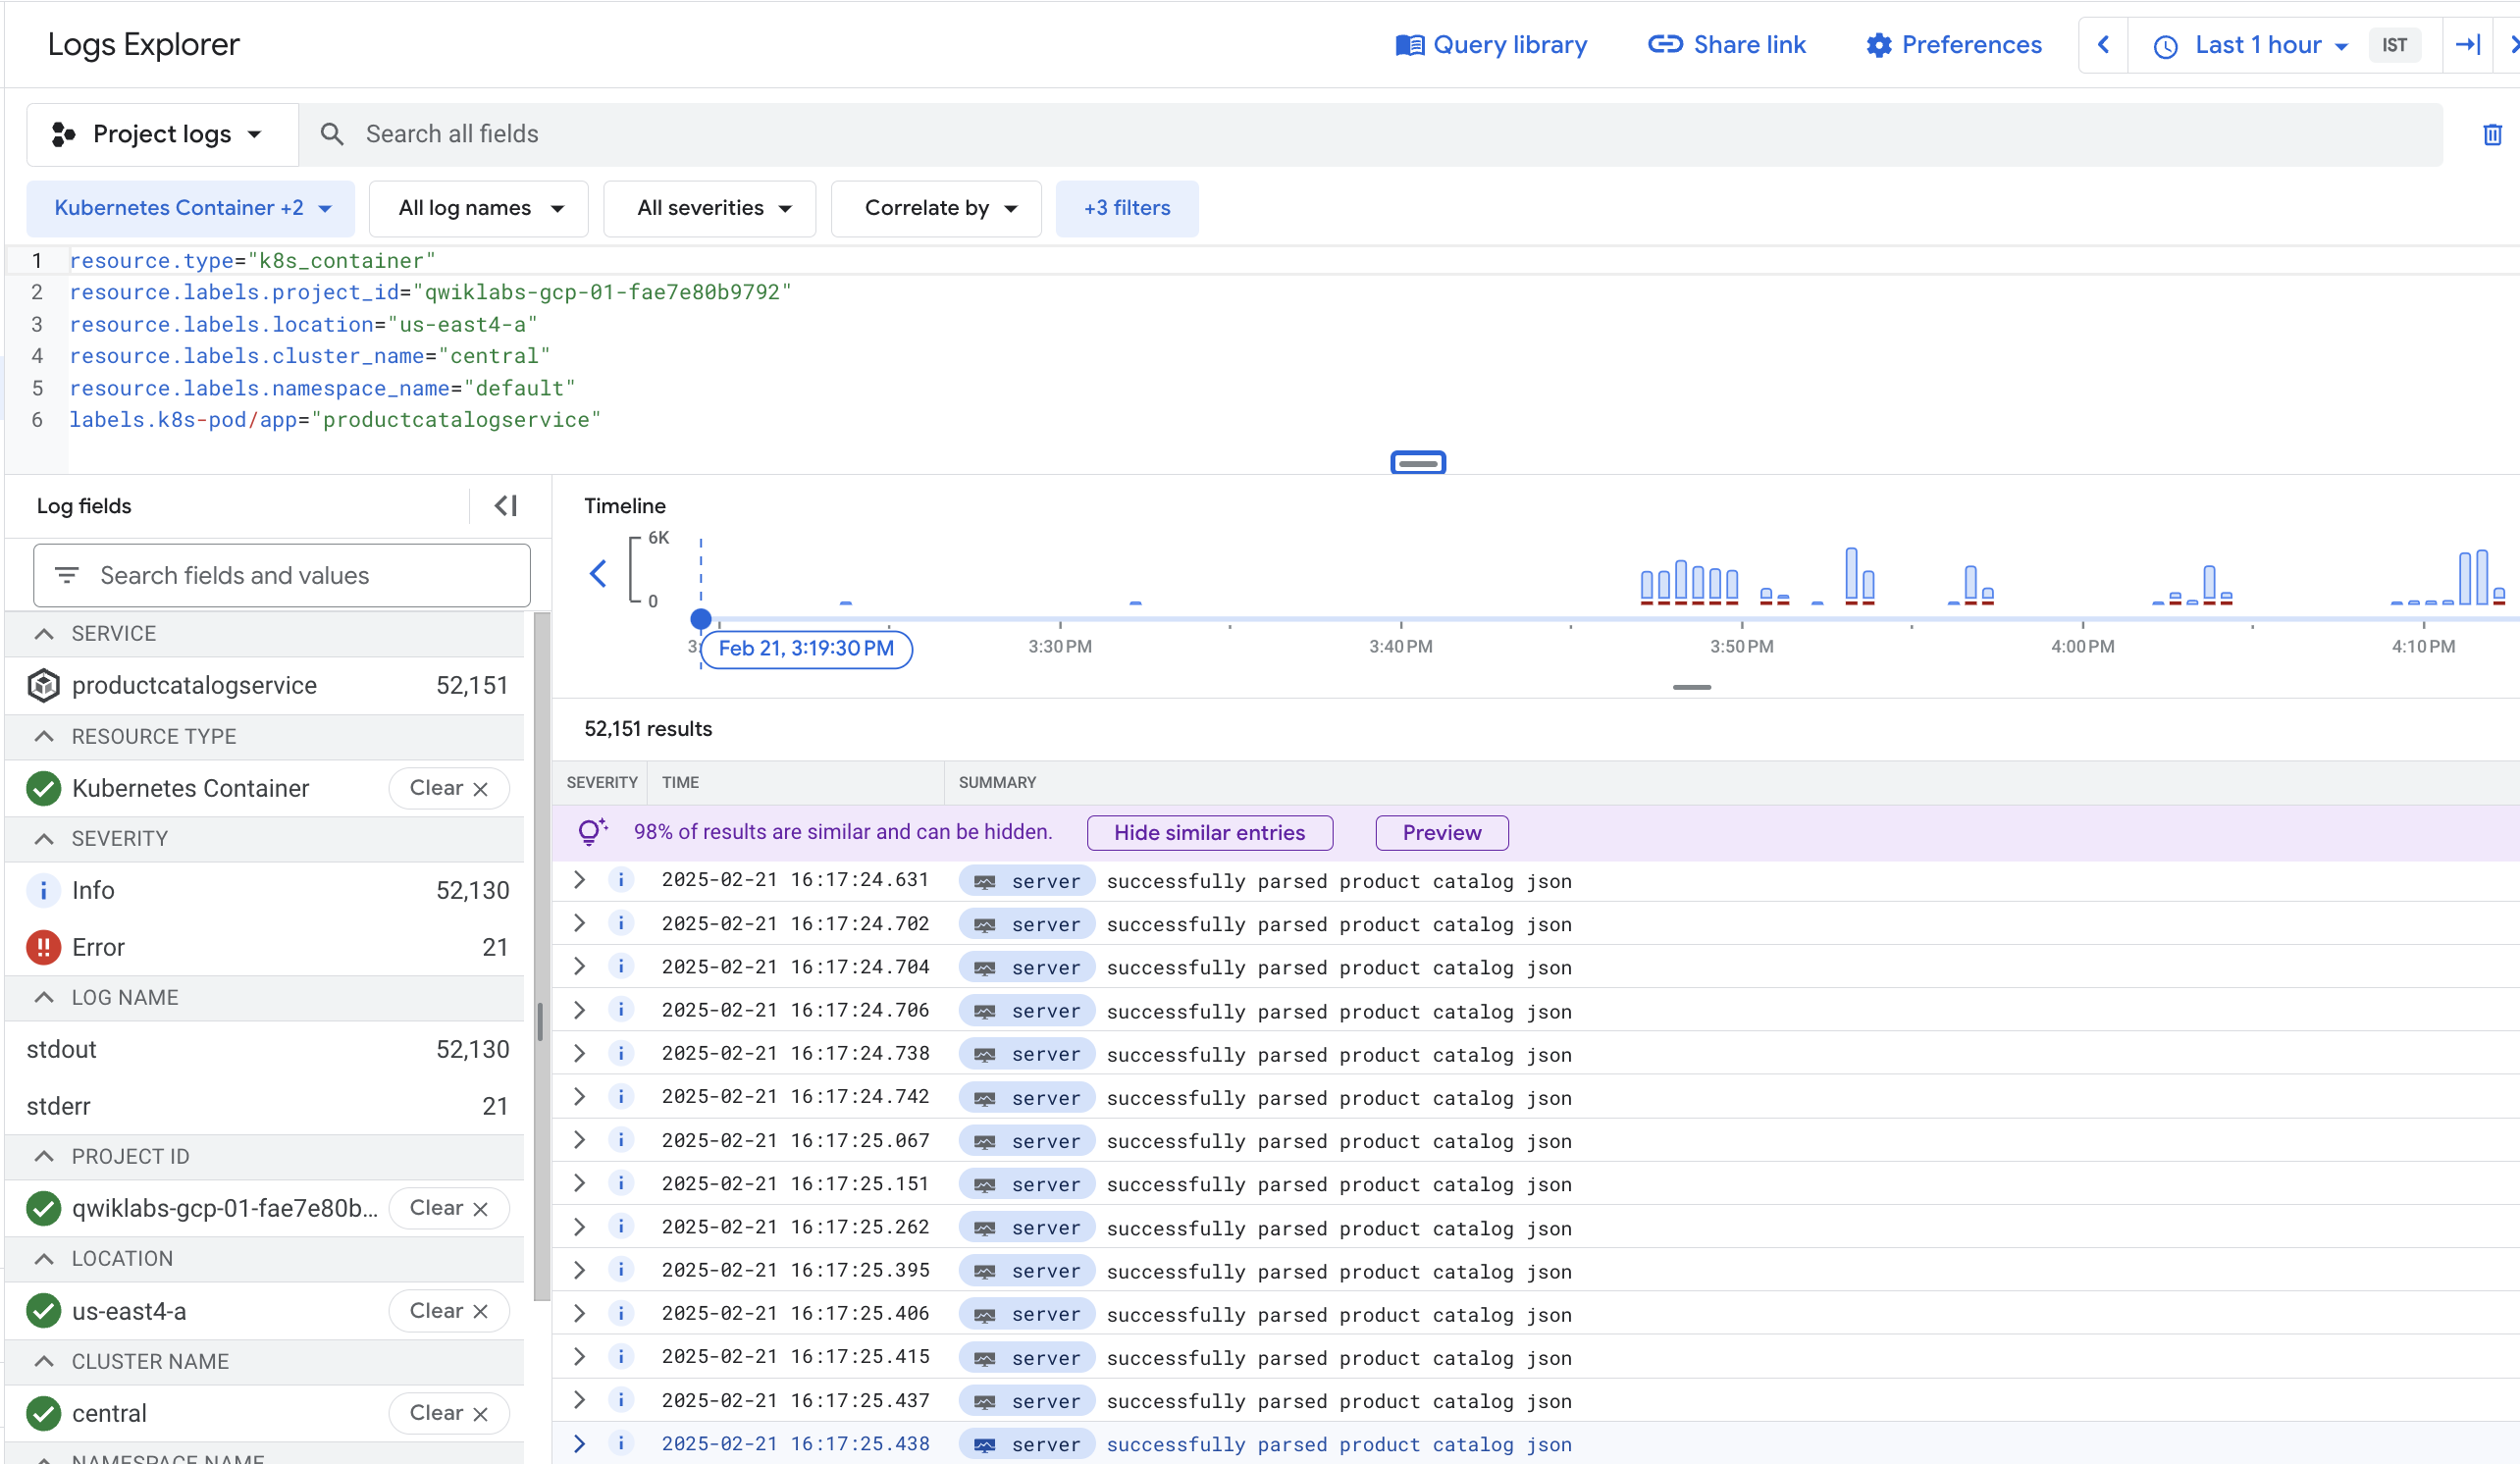
You are on the Logs Explorer page again, now with a predefined query specifically filtered for the logs from the container you were viewing in GKE.
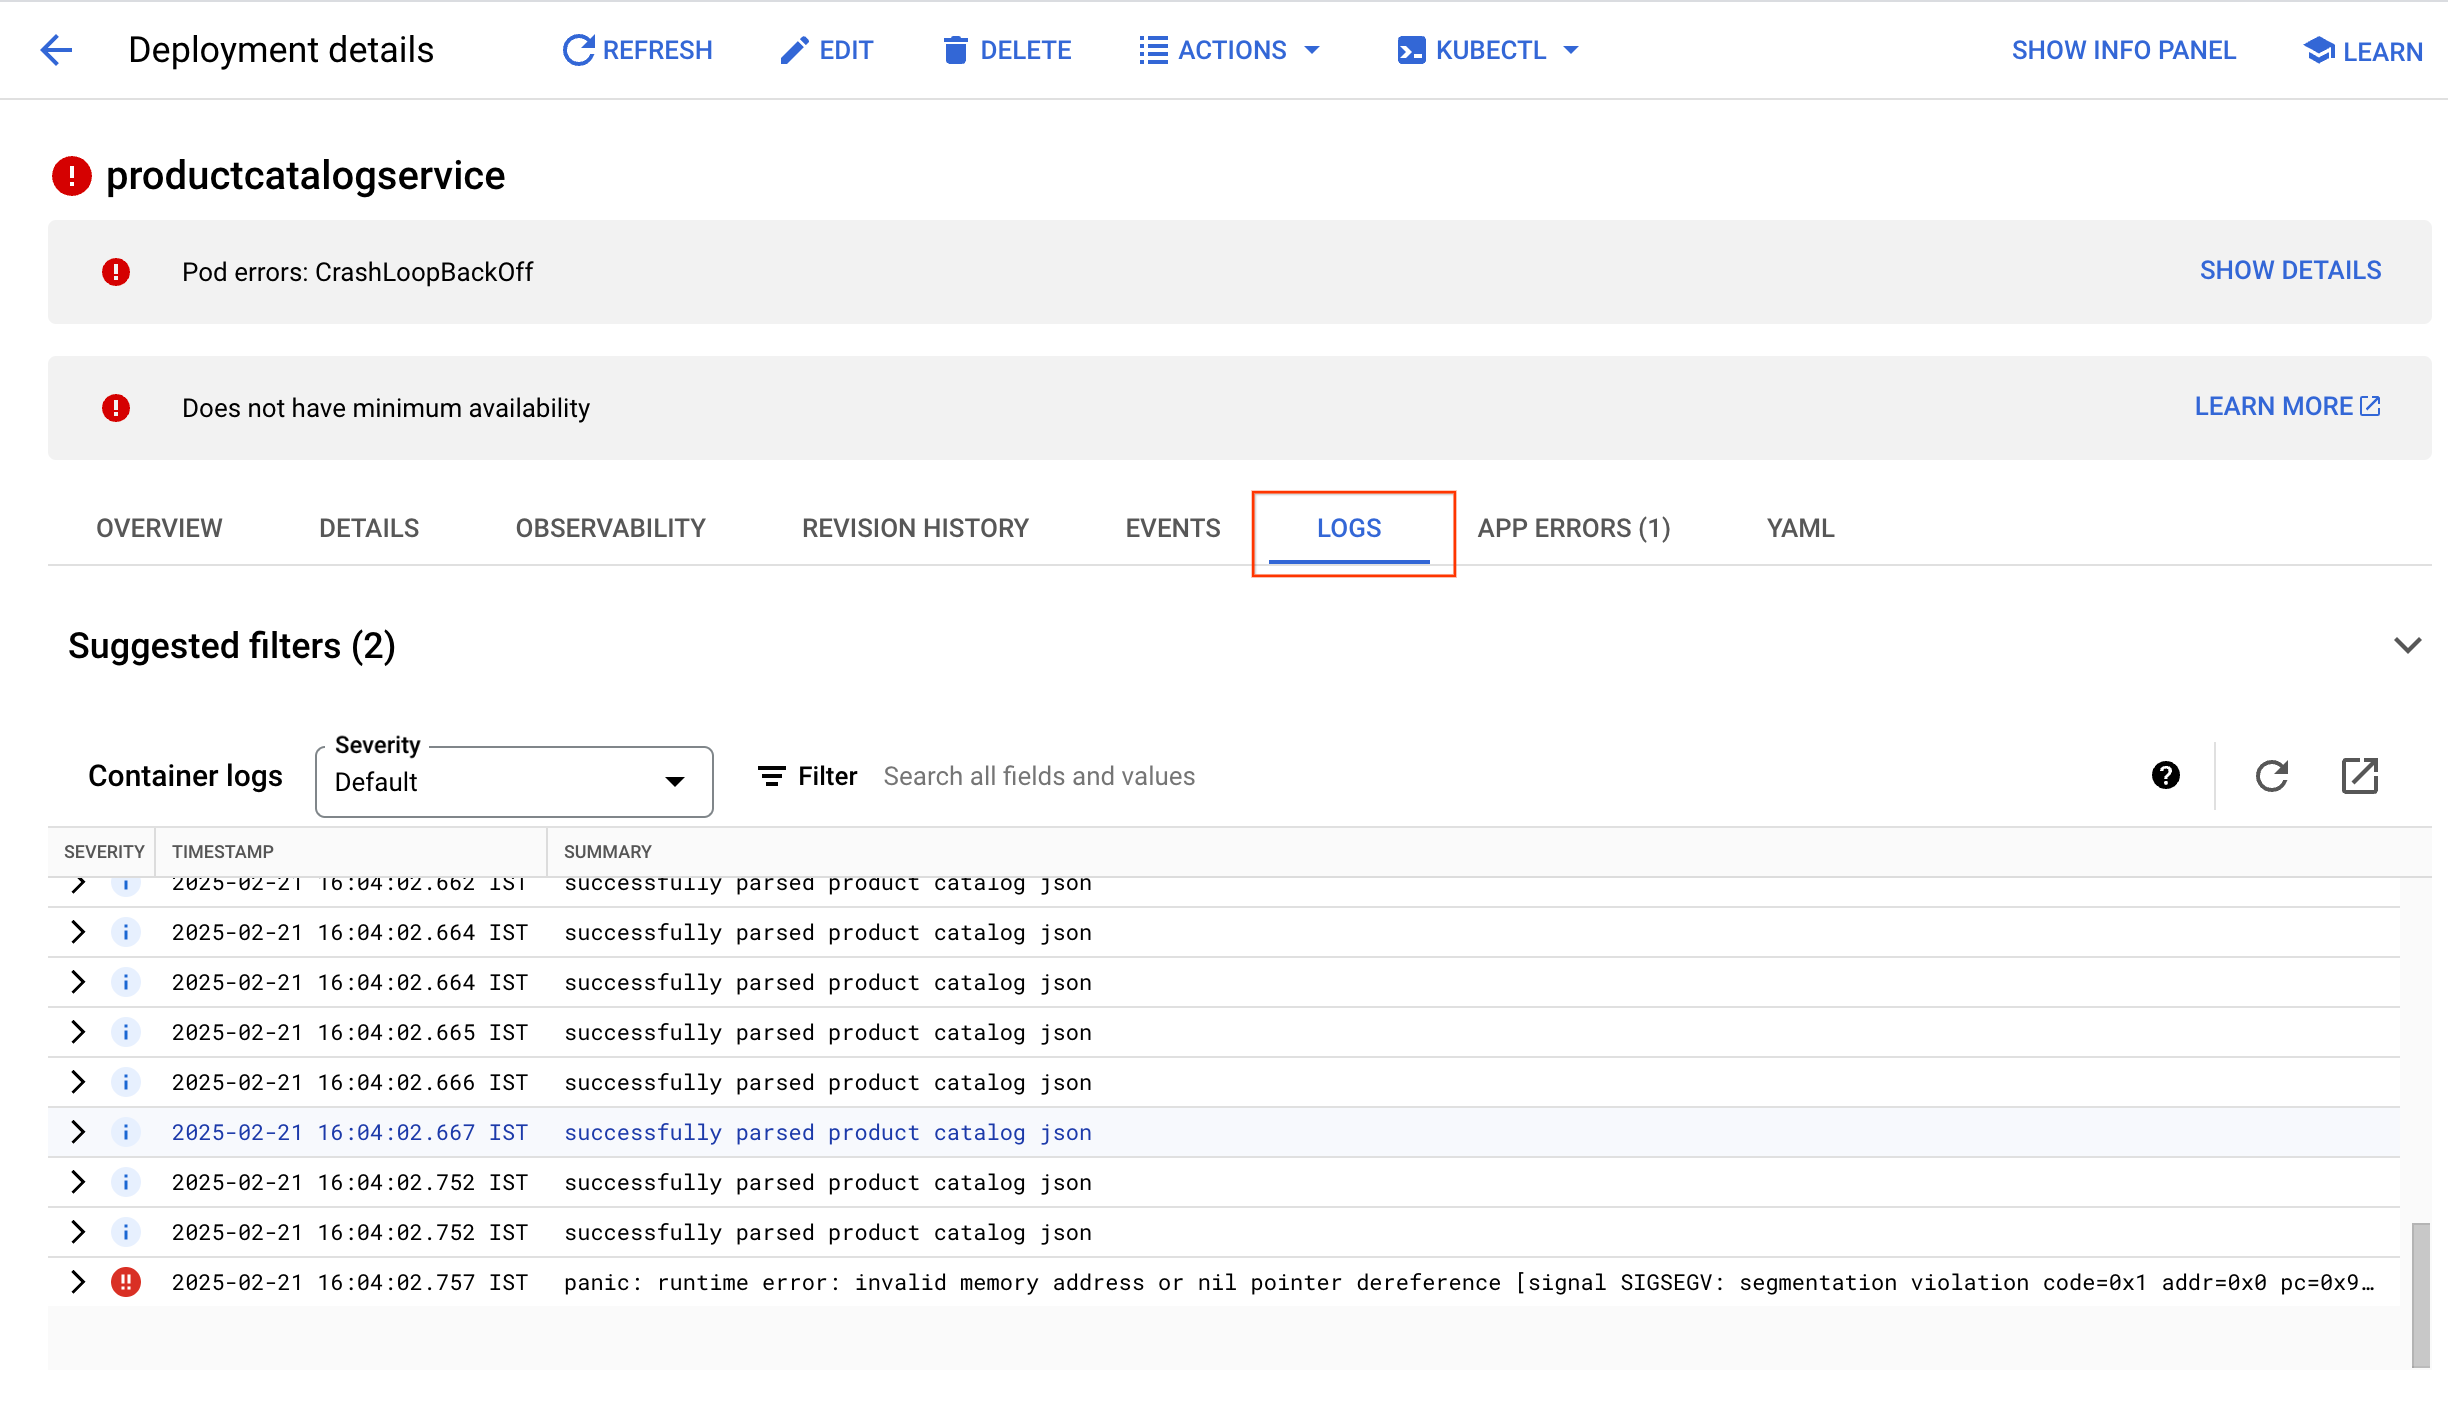
From the Log Viewer, both the log messages and the histogram show the container is repeatedly parsing product catalogs within a short period of time. It seems very inefficient.
At the bottom of the query results, there might also be a runtime error like the following one:
This could actually be causing the pod to crash.
To better understand the reason, search the log message in the code.
Your output should look like the following, which has the source file name with a line number.
Output:
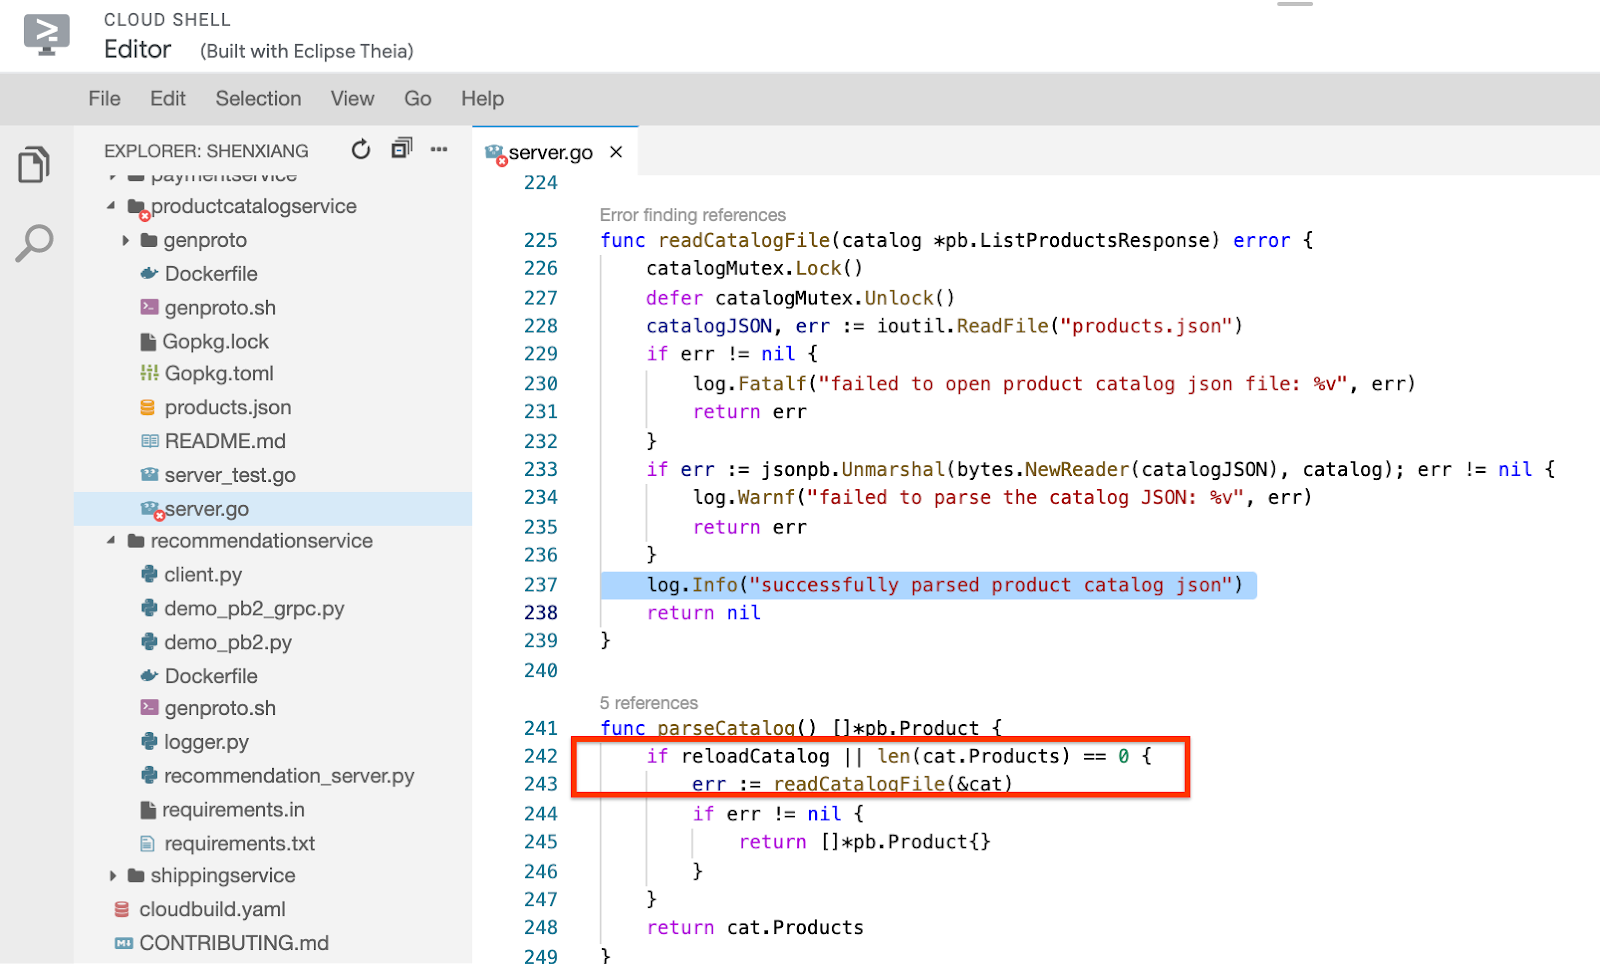
microservices-demo/src/productcatalogservice/server.go, scroll down to line 237, and you will find the readCatalogFile method logs this message:With a little more effort, you can see that if the boolean variable reloadCatalog is true, the service reloads and parses the product catalog each time it's invoked, which seems unnecessary.
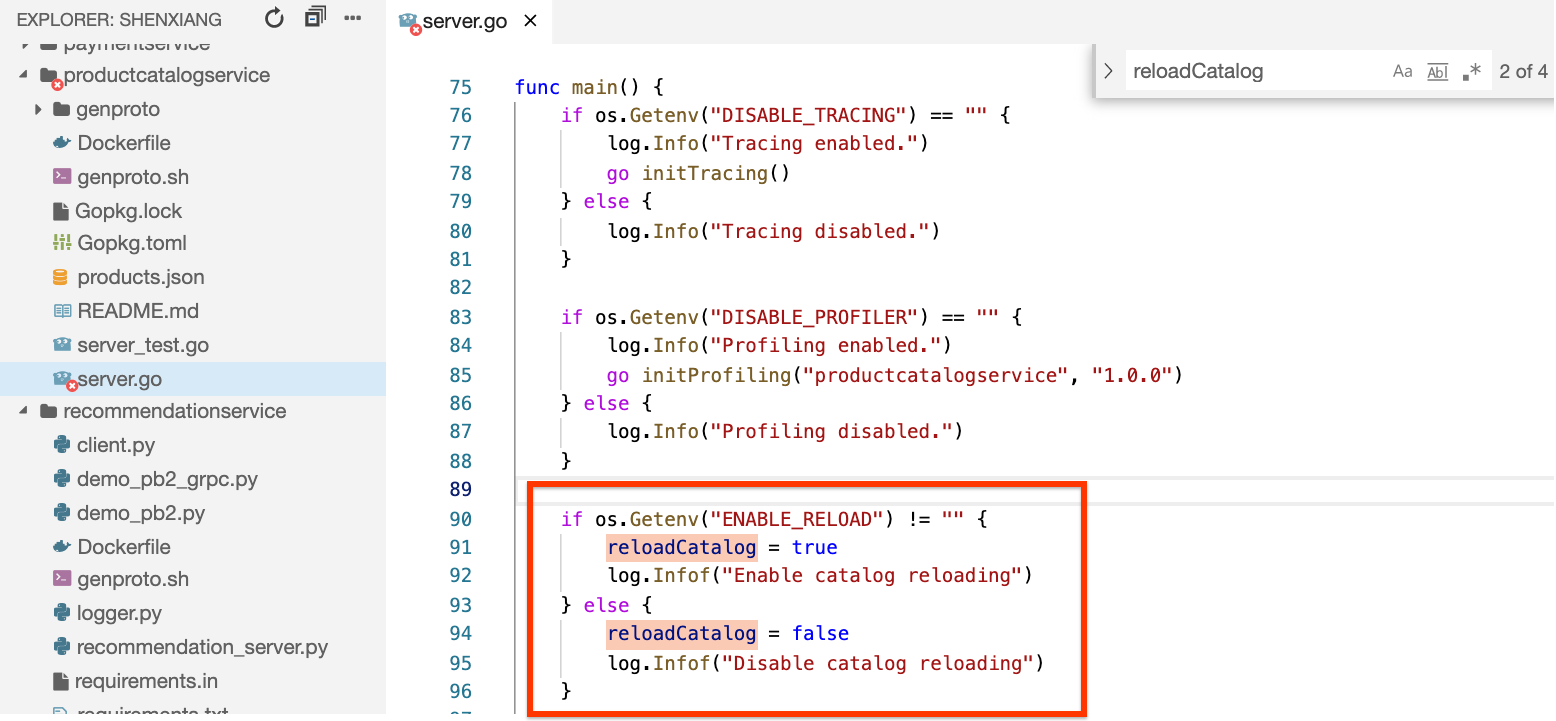
If you search the reloadCatalog variable in the code, you can see it's controlled by the environment variable ENABLE_RELOAD and writes a log message for its state.
server.go file open and Gemini Code Assist enabled in the IDE, notice the presence of the icon in the upper-right corner of the editor.In this instance, you decide to ask Gemini Code Assist for help explaining the server implementation to your new team member.
Click the Gemini Code Assist: Smart Actions
Gemini Code Assist opens a chat pane with the prefilled prompt of Explain this. In the inline text box of the Code Assist chat, replace the prefilled prompt with the following, and click Send:
The explanation for the code in the server.go file appears in the Gemini Code Assist chat.
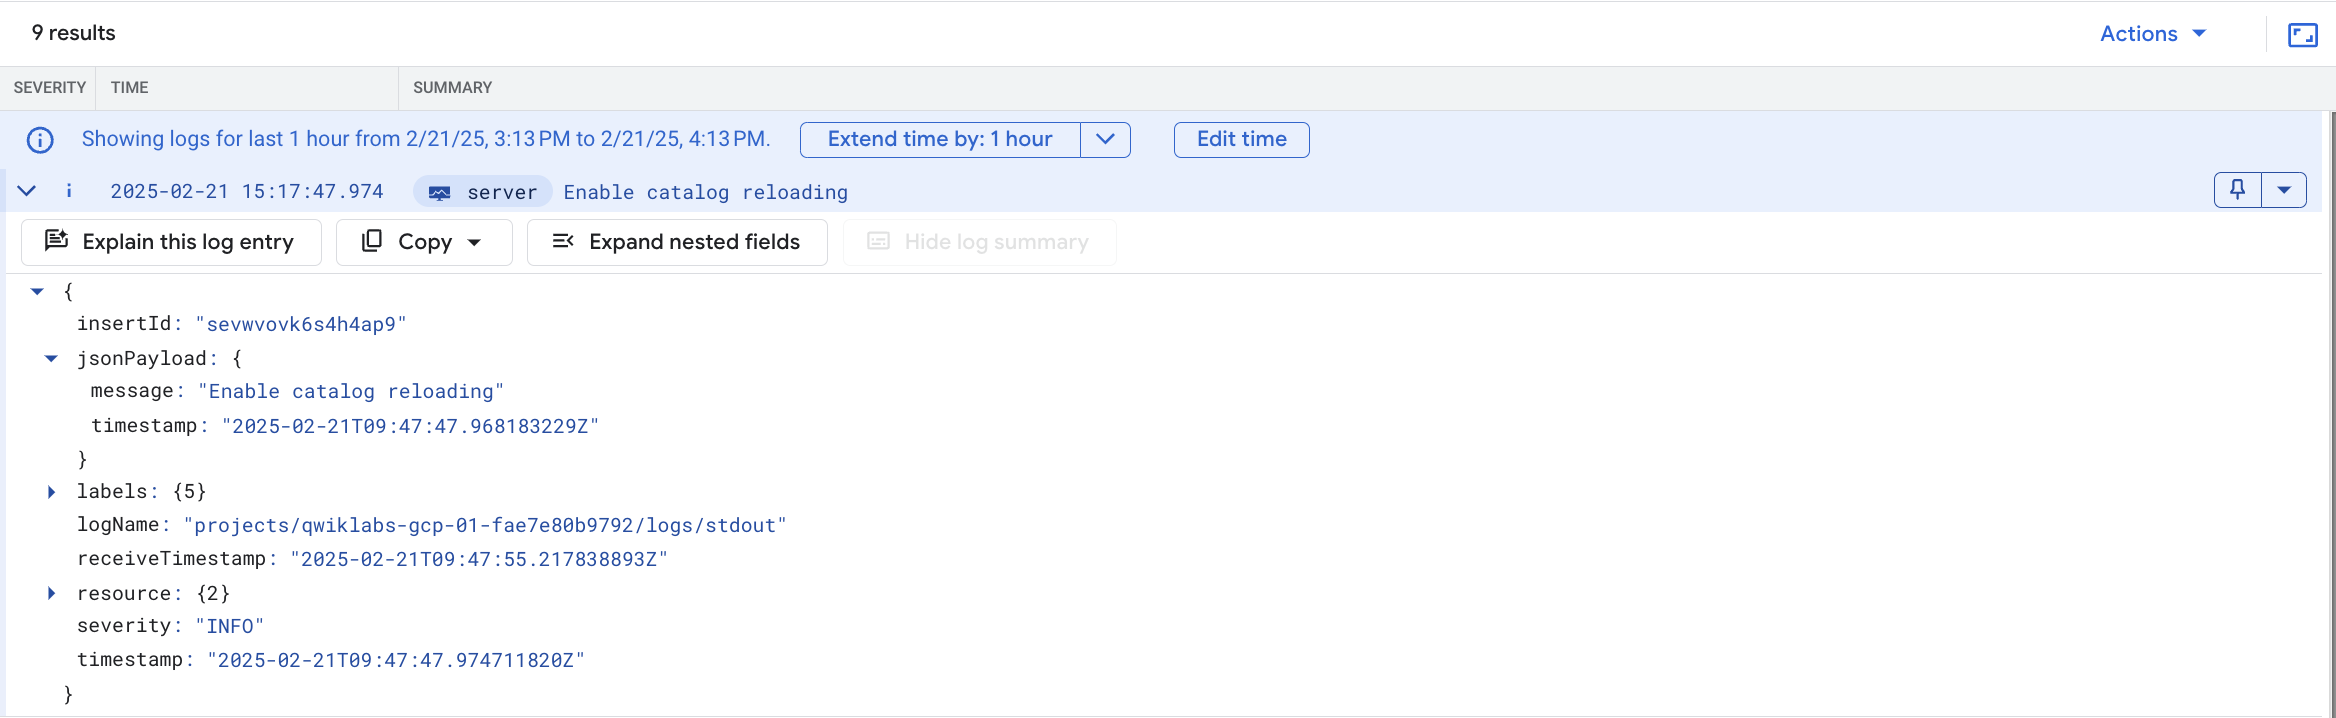
Check the logs again by adding a message to your query and determine if there are any entries that exist.
So the full query in your query builder is as follows:
At this point you can be certain the frontend error is caused by the overhead to load the catalog for every request. When you increased the load, the overhead caused the service to fail and generate the error.
Based on the code and what you're seeing in the logs, you can try to fix the issue by disabling catalog reloading.
In this task, you remove the ENABLE_RELOAD environment variable for the product catalog service. Once you make the variable changes, you redeploy the application and verify that the changes have addressed the observed issue.
Click the Open Terminal button to return to the Cloud Shell terminal if it has closed.
Run the following command:
The output shows the line number of the environment variable in the manifest file.
Output:
You should notice that only the productcatalogservice is configured. The other services are unchanged.
successfully parsing the catalog json messages are gone:If you go back to the webapp URL and click the products on the home page, it's also much more responsive and you shouldn't encounter any HTTP errors.
Go back to the load generator, click the Reset Stats button in the top right. The failure percentage is reset and you should not see it increasing anymore.
All these checks indicate that the issue is fixed. If you are still seeing the 500-error, wait another couple of minutes and try clicking on a product again.
You used Cloud Logging and Cloud Monitoring to find an error in an intentionally misconfigured version of the microservices demo app. This is a similar troubleshooting process that you would use to narrow down issues for your GKE apps in a production environment.
First, you deployed the app to GKE and then set up a metric and alert for frontend errors. Next, you generated a load and then noticed that the alert was triggered. From the alert, you narrowed down the issue to particular services using Cloud Logging. Then, you used Cloud Monitoring and the GKE UI to look at the metrics for the GKE services. To fix the issue, you then deployed an updated configuration to GKE and confirmed that the fix addressed the errors in the logs.
...helps you make the most of Google Cloud technologies. Our classes include technical skills and best practices to help you get up to speed quickly and continue your learning journey. We offer fundamental to advanced level training, with on-demand, live, and virtual options to suit your busy schedule. Certifications help you validate and prove your skill and expertise in Google Cloud technologies.
Manual Last Updated August 26, 2025
Lab Last Tested August 26, 2025
Copyright 2025 Google LLC. All rights reserved. Google and the Google logo are trademarks of Google LLC. All other company and product names may be trademarks of the respective companies with which they are associated.


This content is not currently available
We will notify you via email when it becomes available

Great!
We will contact you via email if it becomes available

One lab at a time
Confirm to end all existing labs and start this one